


A Data Flow Diagram (DFD) serves as a fundamental visual representation in systems analysis and design. It maps the flow of information through a system, highlighting how data moves from input to output. Unlike flowcharts that focus on control logic, DFDs concentrate on data movement. This guide outlines the methodology for constructing accurate diagrams without relying on specific proprietary tools. The process requires clear thinking and adherence to established notation standards.
🧐 Understanding the Core Purpose
Before drawing lines and shapes, one must understand the objective. A DFD models the functional requirements of a system. It shows what the system does, not necessarily how it is physically implemented. This distinction is crucial for analysts. It allows stakeholders to validate the logic of the business processes without getting bogged down in technical implementation details.
The diagram helps in identifying:
- Where data originates within the system boundaries.
- How data is transformed into useful information.
- Where data is stored for future retrieval.
- Where data exits the system to external parties.
By visualizing these elements, teams can detect bottlenecks, redundancies, or missing data paths early in the development lifecycle. It acts as a communication bridge between technical teams and business users.
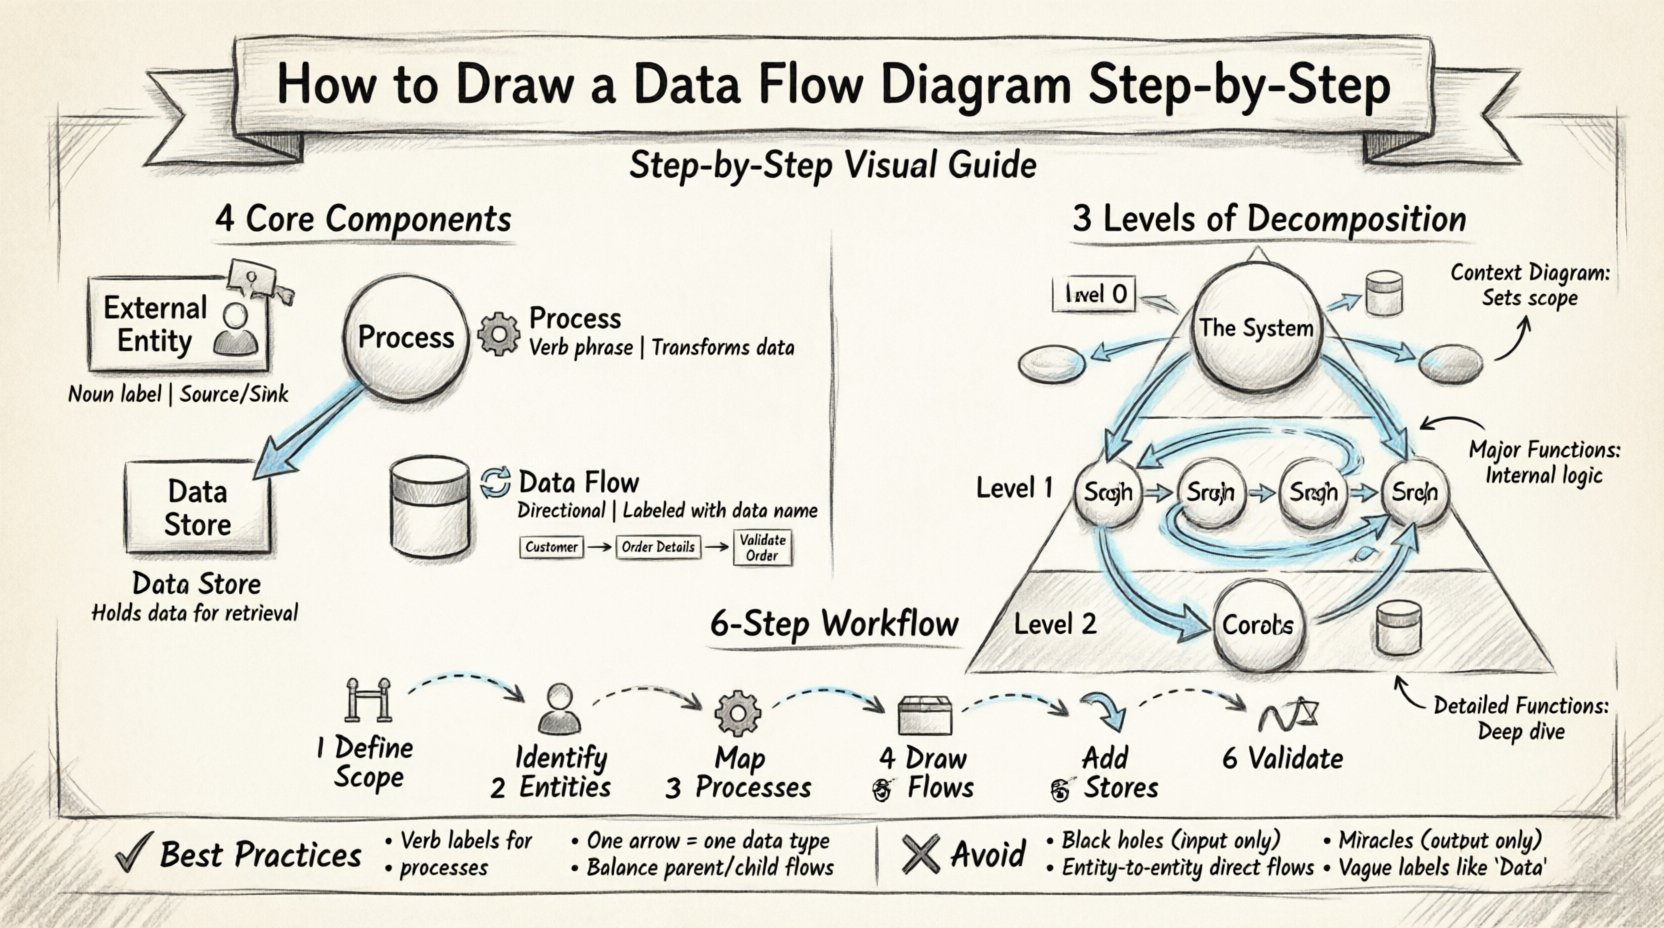
🛠️ The Four Fundamental Components
A complete DFD relies on four primary symbols. Every element drawn must fall into one of these categories. Using any other shape introduces ambiguity. The standard notation generally follows either the Yourdon & DeMarco method or the Gane & Sarson method. While symbols may vary slightly between these styles, the underlying logic remains identical.
1. External Entities 👤
External entities represent sources or destinations of data outside the system boundary. They are the actors interacting with the system. These can be people, organizations, or other systems.
- Source: The entity provides input data to the system (e.g., a customer placing an order).
- Sink: The entity receives output data from the system (e.g., a tax authority receiving reports).
In a diagram, these are typically represented by rectangles or squares. They are labeled with a noun phrase indicating their role.
2. Processes ⚙️
Processes represent actions that transform input data into output data. They are the heart of the diagram. A process must always have at least one input and one output.
- Transformation: It changes data from one form to another (e.g., converting raw sales figures into a summary report).
- Labeling: Processes are usually labeled with a verb phrase (e.g., “Calculate Tax”, “Validate User”).
They are often depicted as circles, rounded rectangles, or bubbles depending on the notation standard.
3. Data Stores 📂
Data stores represent where information is saved for later use. This is not a physical database file, but a logical repository. Data flows into a store for storage and flows out for retrieval.
- Open vs. Closed: Data can be read from and written to the store.
- Persistence: Data remains available even if the process that created it has finished.
Common symbols include open-ended rectangles or cylinders representing files and databases.
4. Data Flows 🔄
Data flows show the movement of data between entities, processes, and stores. They are directional arrows.
- Direction: The arrow points in the direction data is moving.
- Content: Each flow must be labeled with the specific data being transmitted (e.g., “Order Details”, “Payment Confirmation”).
- Consistency: Data cannot flow between two external entities without passing through a process.
| Component | Symbol Shape | Label Type | Function |
|---|---|---|---|
| External Entity | Rectangle / Square | Noun | Source or Destination |
| Process | Circle / Rounded Box | Verb Phrase | Transform Data |
| Data Store | Open Rectangle / Cylinder | Noun | Hold Data |
| Data Flow | Arrow | Data Name | Move Data |
📈 Levels of Decomposition
Complex systems cannot be understood in a single view. DFDs are hierarchical. You start with a high-level overview and progressively break down processes into more detail. This is known as decomposition.
Level 0: Context Diagram 🌍
The Context Diagram is the highest level. It shows the entire system as a single process bubble. It illustrates how the system interacts with the outside world.
- Only one process is drawn in the center.
- External entities surround the process.
- Data flows connect the entities to the single process.
- No data stores are shown at this level.
This diagram sets the scope. It defines the boundary of the project.
Level 1: Major Processes 🔍
Level 1 expands the single process from the Context Diagram into major sub-processes. This is where the internal logic begins to appear.
- The single process becomes a cluster of 3 to 7 major processes.
- Data stores are introduced here.
- External entities remain the same as Level 0.
- Flows must balance with Level 0 inputs and outputs.
Level 2: Detailed Functions 🔬
Level 2 breaks down specific processes from Level 1. This is used for complex operations that require further explanation.
- Focuses on a single process from the previous level.
- Shows detailed logic and sub-steps.
- Used when a Level 1 process is too complex to manage in one view.
| Level | Focus | Processes | Data Stores |
|---|---|---|---|
| Level 0 | System Scope | 1 (The System) | None |
| Level 1 | Major Functions | 3 to 7 | Yes |
| Level 2 | Specific Details | Dependent on Level 1 | Yes |
✍️ Step-by-Step Drawing Methodology
Creating a DFD requires a structured approach. Following these steps ensures consistency and clarity throughout the documentation.
Step 1: Define the Scope and Boundary 🚧
Begin by identifying what is inside the system and what is outside. This decision determines the placement of external entities. Everything outside the boundary is an external entity. Everything inside is a process, store, or flow. Do not include implementation details like hardware or code here.
Step 2: Identify External Entities 👥
List all parties that interact with the system. Ask questions like:
- Who sends information to the system?
- Who receives reports or output from the system?
- Are there other systems that exchange data with this one?
Draw these entities around the perimeter of your workspace. Use clear, descriptive names.
Step 3: Determine Major Processes ⚙️
Identify the main functions the system must perform to transform input into output. Group related activities. For example, “Order Management” might be a major process that includes “Validate Order” and “Update Inventory” as sub-processes.
- Keep the number of processes manageable (ideally under 7 for Level 1).
- Ensure every process has a clear purpose.
- Label processes with verbs (e.g., “Process Payment”).
Step 4: Map Data Flows 🔄
Draw arrows connecting entities to processes and processes to processes. Every arrow must have a label describing the data.
- Check that data moves logically.
- Ensure no flow crosses the system boundary without passing through a process.
- Label flows with the specific data packet (e.g., “Customer ID”, not just “Data”).
Step 5: Add Data Stores 📂
Identify where information needs to be kept. If data is required later, it must go into a store.
- Connect stores to the processes that read or write to them.
- Ensure data flows into a store to save it.
- Ensure data flows out of a store to use it.
Step 6: Validate and Balance ⚖️
This is the most critical technical step. Balancing ensures that the inputs and outputs of a parent process match the inputs and outputs of its child diagram (the next level down).
- If Level 0 has an input “Order”, Level 1 must also show “Order” entering the main process.
- If Level 1 splits a process, the sub-processes must handle the same data inputs and outputs as the parent.
- Check for orphan processes (processes with no data flow).
- Check for orphan data stores (stores with no data flow in or out).
🧠 Best Practices and Rules
Adhering to strict rules prevents confusion. Deviations can lead to misinterpretation of the system logic.
1. Naming Conventions 🏷️
Consistency is key. Use a standard naming convention for all elements.
- Entities: Plural nouns (e.g., “Customers”, “Vendors”).
- Processes: Verb phrases (e.g., “Update Inventory”).
- Stores: Nouns (e.g., “Inventory File”).
- Flows: Data names (e.g., “Stock Update”).
2. Avoid Control Logic 🚫
DFDs are not flowcharts. Do not include decision diamonds or loops that represent control flow. If a decision affects data flow, represent it by splitting the flow into different paths based on the data content, not the logic condition itself.
3. One Arrow, One Data Packet
Do not combine multiple types of data into a single arrow. If a process sends both “Order Data” and “Payment Data”, draw two separate arrows.
4. No Direct Entity-to-Entity Flows
Data cannot move directly from one external entity to another without passing through the system. If it does, it means the system is bypassed, or the diagram scope is incorrect.
5. Avoid Black Holes and Miracles
- Black Hole: A process that has inputs but no outputs. Data disappears. This is impossible.
- Miracle: A process that has outputs but no inputs. Data appears from nowhere. This is impossible.
⚠️ Common Mistakes to Avoid
Even experienced analysts make errors. Being aware of common pitfalls saves time during reviews.
Mistake 1: Mixing Levels
Combining Level 0 and Level 1 details on the same page creates clutter. Keep each level separate to maintain clarity.
Mistake 2: Inconsistent Flow Direction
Ensure arrows point in the correct direction. A common error is drawing an arrow from the store to the process when the process is actually writing data to the store.
Mistake 3: Vague Labels
Avoid labels like “Info”, “Data”, or “Details”. Be specific. “Customer Details” is better. “Data” is useless for analysis.
Mmistake 4: Ignoring Data Stores
Skipping data stores leads to an incomplete model. If data is used later, it must be stored. Failure to include stores implies a stateless system, which is rarely accurate for complex applications.
🔍 Advanced Considerations
As systems grow, DFDs require more rigorous maintenance. Consider the following for larger projects.
Physical vs. Logical DFDs
- Logical DFD: Focuses on the business requirements. It ignores technical implementation details like paper files vs. databases.
- Physical DFD: Reflects the actual implementation. It specifies hardware, software, and file types.
It is best practice to create the Logical DFD first to agree on requirements, then derive the Physical DFD for development.
Concurrency and Timing
Standard DFDs do not show time or concurrency. They show what happens, not when. For systems where timing is critical, other modeling techniques like State Transition Diagrams may be required alongside DFDs.
Security and Access Control
While DFDs do not explicitly show security protocols, data flows should indicate sensitive information. Flows containing “Password” or “Credit Card Number” should be noted. This helps security architects identify where encryption is needed.
📝 Summary of Workflow
Constructing a Data Flow Diagram is a disciplined exercise in systems thinking. It requires breaking down a complex system into manageable parts while maintaining the integrity of data movement. The process moves from the macro view of the Context Diagram to the micro view of detailed processes.
Success depends on:
- Clear identification of boundaries.
- Consistent labeling of components.
- Strict adherence to balancing rules.
- Validation with stakeholders.
By following these steps and avoiding common pitfalls, you create a reliable blueprint for system development. This document serves as a foundation for database design, software architecture, and process improvement initiatives. It remains a timeless tool for understanding how information flows through any organized system.