


In the architecture of complex software systems, clarity is the currency of success. Before a single line of logic is written, the movement of information must be understood. This is where the Data Flow Diagram (DFD) becomes indispensable. A DFD visualizes how data enters a system, how it is transformed, where it is stored, and how it exits. It is a structural blueprint that separates the “what” from the “how”. Unlike code, which dictates specific implementation details, a DFD focuses on the logical flow of information across the entire ecosystem.
Many teams rush into coding without a solid visual representation of data movement. This leads to spaghetti logic, redundant database queries, and interfaces that do not align with business processes. By mastering the construction and interpretation of DFDs, architects ensure that the system’s foundation supports its intended purpose. This guide details the mechanics, rules, and best practices for creating effective diagrams that bridge the gap between abstract requirements and concrete implementation.
🧩 Understanding the Core Components of a DFD
A Data Flow Diagram is a graphical representation of the flow of data through an information system. It does not show the control flow, such as loops or decision branches, but rather the data itself. To construct a valid diagram, one must understand the four fundamental symbols used in standard notation.
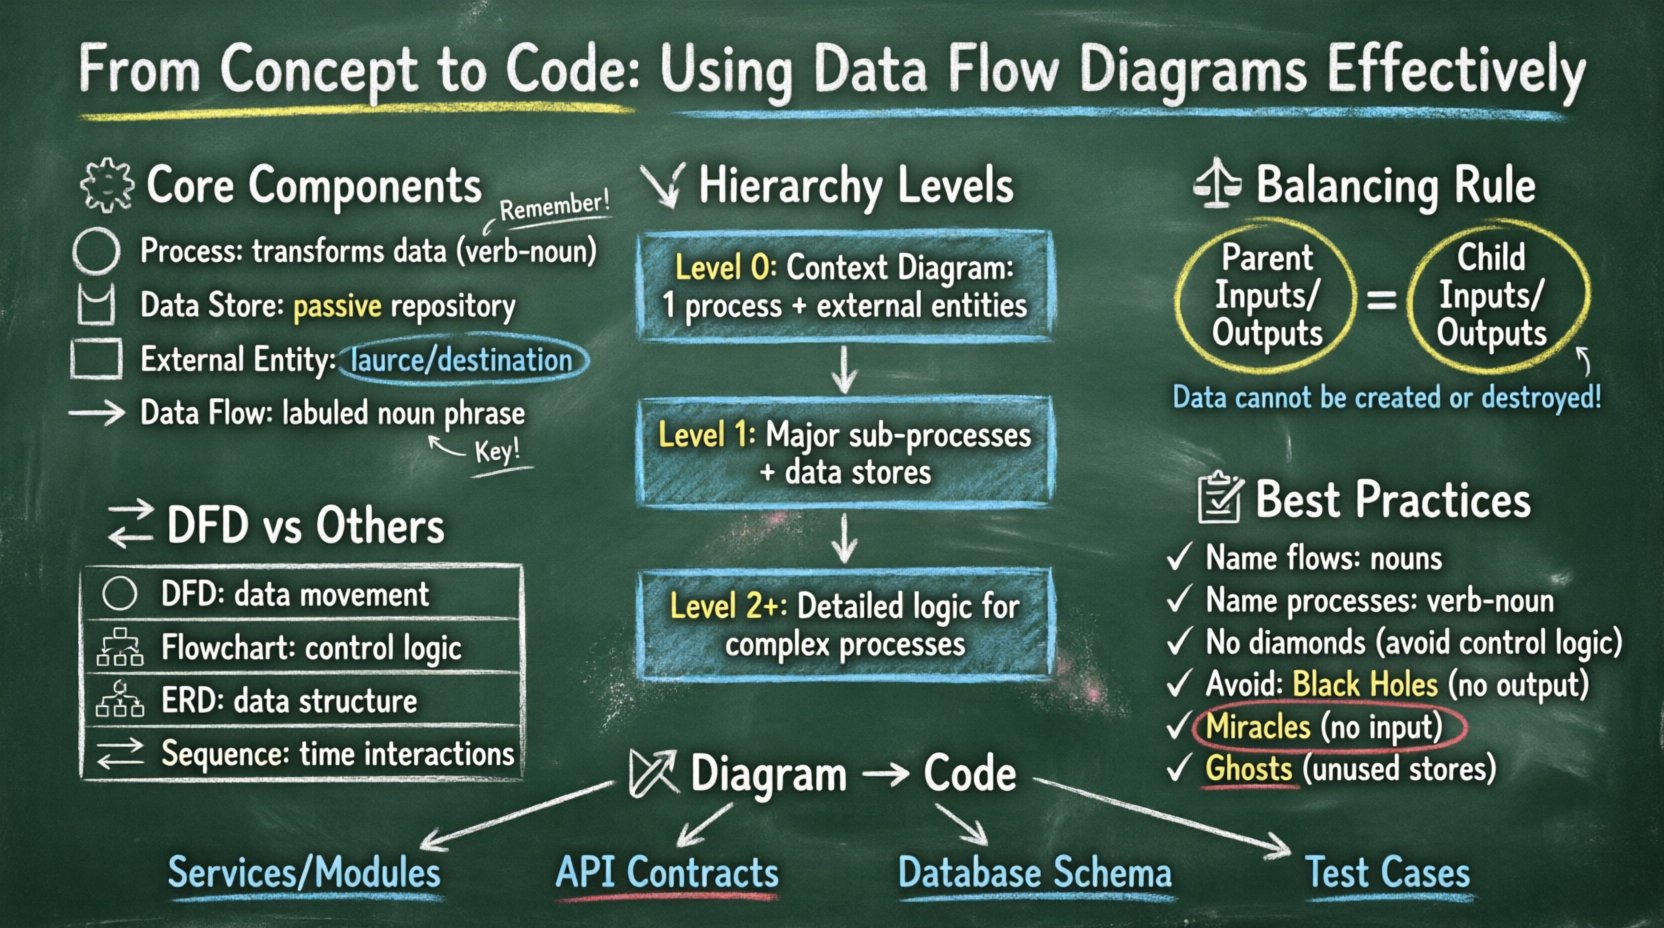
- Process: Represented by a circle or a rounded rectangle, a process transforms incoming data flows into outgoing data flows. It represents a change, calculation, or aggregation. A process cannot exist in isolation; it must have at least one input and one output.
- Data Store: Shown as an open-ended rectangle or parallel lines, this symbol represents a repository of data. It is passive storage where data rests between processes. Examples include database tables, flat files, or in-memory caches.
- External Entity: Also known as a terminator, this is a rectangle representing a source or destination of data outside the system boundaries. It could be a user, another system, or a physical device.
- Data Flow: Illustrated as a line with an arrow, this shows the movement of data between components. It represents the data itself, not the physical signal. Each flow must have a meaningful label describing the content.
Understanding the distinction between these components is critical. For instance, a common error is drawing a data flow directly from one external entity to another, bypassing the system. This implies the system is not processing the data, which violates the scope of the analysis. Similarly, connecting a data store directly to an external entity without a process implies unauthorized access or a lack of control.
📉 The Hierarchy of DFD Levels
Data Flow Diagrams are not static; they are hierarchical. This allows a system to be described from a high-level overview down to granular details. This decomposition helps manage complexity by breaking the system into manageable chunks. There are three primary levels of decomposition.
1. Context Diagram (Level 0)
The Context Diagram provides the highest level of abstraction. It depicts the entire system as a single process and shows its interaction with external entities. This diagram answers the question: “What is the system?” It is useful for stakeholders who need a quick overview without getting bogged down in internal details.
- Scope: One central process representing the whole system.
- Entities: All external sources and destinations.
- Flows: Major data inputs and outputs.
2. Level 1 Diagram
The Level 1 diagram decomposes the single process from the Context Diagram into major sub-processes. This is the most common level used for system design documentation. It reveals the main functional areas of the system. Each major function identified here becomes a distinct process node.
- Scope: Major functional modules.
- Interactions: Data moves between these modules and external entities.
- Storage: Primary databases or file systems are introduced.
3. Level 2 and Below
Level 2 diagrams break down specific processes from the Level 1 diagram into greater detail. This is reserved for complex processes that involve significant logic or data handling. Over-decomposition at this level can lead to diagrams that are too large to read, so caution is advised. Usually, only the most complex functions warrant this depth.
⚖️ The Principle of Balancing
One of the most critical rules in DFD construction is balancing. Balancing ensures that the inputs and outputs of a parent process match the inputs and outputs of its child processes. If a parent process has an input flow “Order Request”, the child process must also accept an “Order Request” (or a subset that logically sums up to it).
Violating this rule creates inconsistencies. A developer reading the child diagram might see an input that the parent diagram says never happens. This leads to implementation errors. When decomposing a process, you must ensure:
- All data flows entering the parent process also enter the child processes.
- All data flows leaving the child processes also leave the parent process.
- No new data flows are introduced without justification in the parent scope.
- No existing flows are lost in the decomposition.
Think of balancing as a conservation of data law. Data cannot be created or destroyed within the system boundaries; it is merely transformed. This principle forces the architect to justify every piece of data that enters or leaves the system.
🔄 DFD vs. Other Diagramming Techniques
Confusion often arises between DFDs, Flowcharts, and Entity-Relationship Diagrams (ERD). While they all model systems, they serve different purposes. Using the wrong diagram for a specific task can obscure the design intent.
| Diagram Type | Primary Focus | Best Used For |
|---|---|---|
| Data Flow Diagram (DFD) | Logical movement of data | System analysis, defining system boundaries, data transformation |
| Flowchart | Control flow and logic | Algorithm design, decision paths, specific process logic |
| Entity-Relationship Diagram (ERD) | Data structure and relationships | Database schema design, data modeling, storage normalization |
| Sequence Diagram | Interaction over time | API calls, user session flows, temporal dependencies |
For example, if you need to define how a user authentication token is validated, a Flowchart might be better to show the pass/fail logic. If you need to define where that token is stored and retrieved, a DFD shows the flow to the store, while an ERD shows the schema of the storage table. A DFD provides the functional map, while the other diagrams provide the structural and logical details.
🛠 Design Principles and Best Practices
Creating a diagram is not just about drawing boxes and arrows. It requires adherence to conventions that ensure the diagram remains readable and accurate over time. Adhering to these principles prevents documentation drift, where the diagram no longer matches the code.
1. Naming Conventions
Labels are the text that carries meaning. A DFD without clear labels is useless. Every data flow must have a noun phrase (e.g., “User ID”, “Transaction Log”). Every process must have a verb phrase (e.g., “Validate Password”, “Generate Invoice”). This grammatical distinction helps clarify the action versus the content.
- Process Names: Verb-Noun structure. Avoid single words like “Process” or “Logic”.
- Data Flow Names: Noun phrases describing the information packet.
- Data Store Names: Noun phrases, plural or singular, indicating the collection (e.g., “Customer Records”).
2. Avoiding Control Logic
A common pitfall is injecting control logic into a DFD. DFDs describe data movement, not decision making. You should not draw a diamond shape indicating a “Yes/No” branch. If a decision exists, it is a process that filters data. The flow should show the data entering the process and the specific data types leaving it. For example, instead of a branch, show two flows: “Approved Order” and “Rejected Order” leaving a “Process Order” node.
3. Managing Black Holes and Miracles
In system analysis, certain anomalies must be avoided:
- Black Hole: A process that has inputs but no outputs. This implies data is consumed and disappears without a result.
- Miracle: A process that has outputs but no inputs. This implies data is created from nothing.
- Ghost: A data store that has no data flows connecting to it. This indicates a storage location that is never used.
Identifying these anomalies during the design phase saves significant debugging time later. If a process has no output, the system is not delivering value for that input. If a store has no input, it is empty and irrelevant.
🔗 From Diagram to Code: Implementation Strategy
Once the DFD is finalized, it serves as a contract for the development team. Translating this visual model into executable code requires a systematic approach. The diagram informs the architecture, the database schema, and the API endpoints.
1. Identifying Services and Modules
Each process in the Level 1 diagram often corresponds to a microservice, a module, or a class. For example, a process named “Calculate Tax” might become a dedicated function within a billing module. A process named “Manage User Profile” might map to a User Service. This mapping ensures the code structure reflects the business logic.
2. Defining API Contracts
Data flows between external entities and processes often translate to API requests and responses. If an entity sends “Registration Data” to a process, the corresponding API endpoint must accept a payload matching that data structure. The DFD dictates the input and output schemas for these endpoints. This reduces the need for iterative negotiation between frontend and backend teams.
3. Database Schema Design
Data stores in the DFD represent the persistence layer. While a DFD does not show fields or keys, it identifies which data needs to be saved. “Order History” implies a table or collection for orders. “Active Sessions” implies a store for user state. Developers can use the DFD to prioritize which tables are critical and ensure that the relationships between data stores align with the flow of information.
4. Validation and Testing
Test cases can be derived directly from the data flows. Every arrow represents a potential test path. “If I send an Order, does the System return an Invoice?” This traceability ensures that every line of code serves a purpose defined in the initial design. It prevents “feature creep” where code is added that does not appear in the data flow.
🛡 Maintenance and Documentation Lifecycle
A diagram is only as good as its currency. A DFD that does not reflect the current system becomes technical debt. It misleads new developers and obscures the actual logic. Therefore, maintenance is part of the development lifecycle.
- Versioning: Treat the DFD like code. When the system changes, the diagram must be updated. Tag versions to match software releases.
- Review Cycles: Include DFD updates in code review processes. If a developer adds a new data flow, they must update the diagram.
- Accessibility: Keep diagrams in the same repository or documentation system as the code. This ensures they are not lost when the team switches tools.
- Simplification: If a diagram becomes too complex, consider splitting it. A single page containing 50 processes is hard to read. Modular diagrams are easier to maintain.
Regularly auditing the diagram against the codebase reveals discrepancies. Are there data stores in the code that are not in the diagram? Are there processes in the diagram that have been refactored away? Addressing these gaps maintains the integrity of the system documentation.
🌟 Summary of Benefits
Implementing a disciplined approach to Data Flow Diagrams yields tangible results. It forces the team to think about data before logic. It provides a common language for stakeholders who may not understand code but understand business processes. It serves as a communication bridge between analysts, architects, and developers.
By adhering to the rules of balancing, avoiding control logic, and maintaining the hierarchy of levels, teams can produce diagrams that are both accurate and useful. The transition from concept to code becomes smoother because the destination is clearly mapped. Data flows are validated, storage is justified, and external interactions are defined. This reduces rework, minimizes ambiguity, and builds a system that is robust by design.
Start with the Context Diagram. Decompose with care. Balance your flows. Keep your labels precise. And remember that the diagram is a living artifact, not a one-time deliverable. With these practices, the complexity of modern systems becomes manageable, and the path from idea to implementation remains clear.