


Designing software architecture requires precision. When systems grow in size and intricacy, understanding how data moves becomes critical. Data Flow Diagrams (DFDs) serve as a visual language that maps the flow of information within a system. They are not just drawings; they are blueprints for logic and interaction. For complex environments involving multiple services, databases, and external interfaces, clarity is the primary goal.
This guide details the methodology for constructing accurate diagrams. It covers the structural elements, the hierarchy of detail, and the strategies for managing complexity without sacrificing readability. By following these principles, teams can ensure that every stakeholder understands the system’s behavior regarding data movement and transformation.
🧱 Understanding the Foundations
A Data Flow Diagram is a structured technique for representing the flow of data. Unlike a flowchart, which shows control flow and decision points, a DFD focuses on data. It depicts how data enters the system, how it is processed, where it is stored, and how it exits. This distinction is vital for system analysts and developers.
In complex systems, the volume of data is high. The paths it takes are often non-linear. Without a clear map, assumptions lead to errors in implementation. A well-constructed DFD acts as a single source of truth. It aligns the expectations of business analysts, engineers, and QA specialists.
- Focus on Data: Track the information, not the timing or logic branches.
- Process-Centric: Center the diagram around transformations of data.
- External Context: Clearly define what lies inside the system boundary versus what lies outside.
When building for complex architectures, such as distributed networks or microservices, the diagram must accommodate concurrency and state. It should not merely show a linear path but illustrate the ecosystem where data resides and travels.
🔍 The Anatomy of a DFD
To create a professional diagram, one must understand the standard symbols. While variations exist in different notations, the core components remain consistent across the industry. Using these standard elements ensures that anyone reviewing the document can interpret it correctly.
Core Components
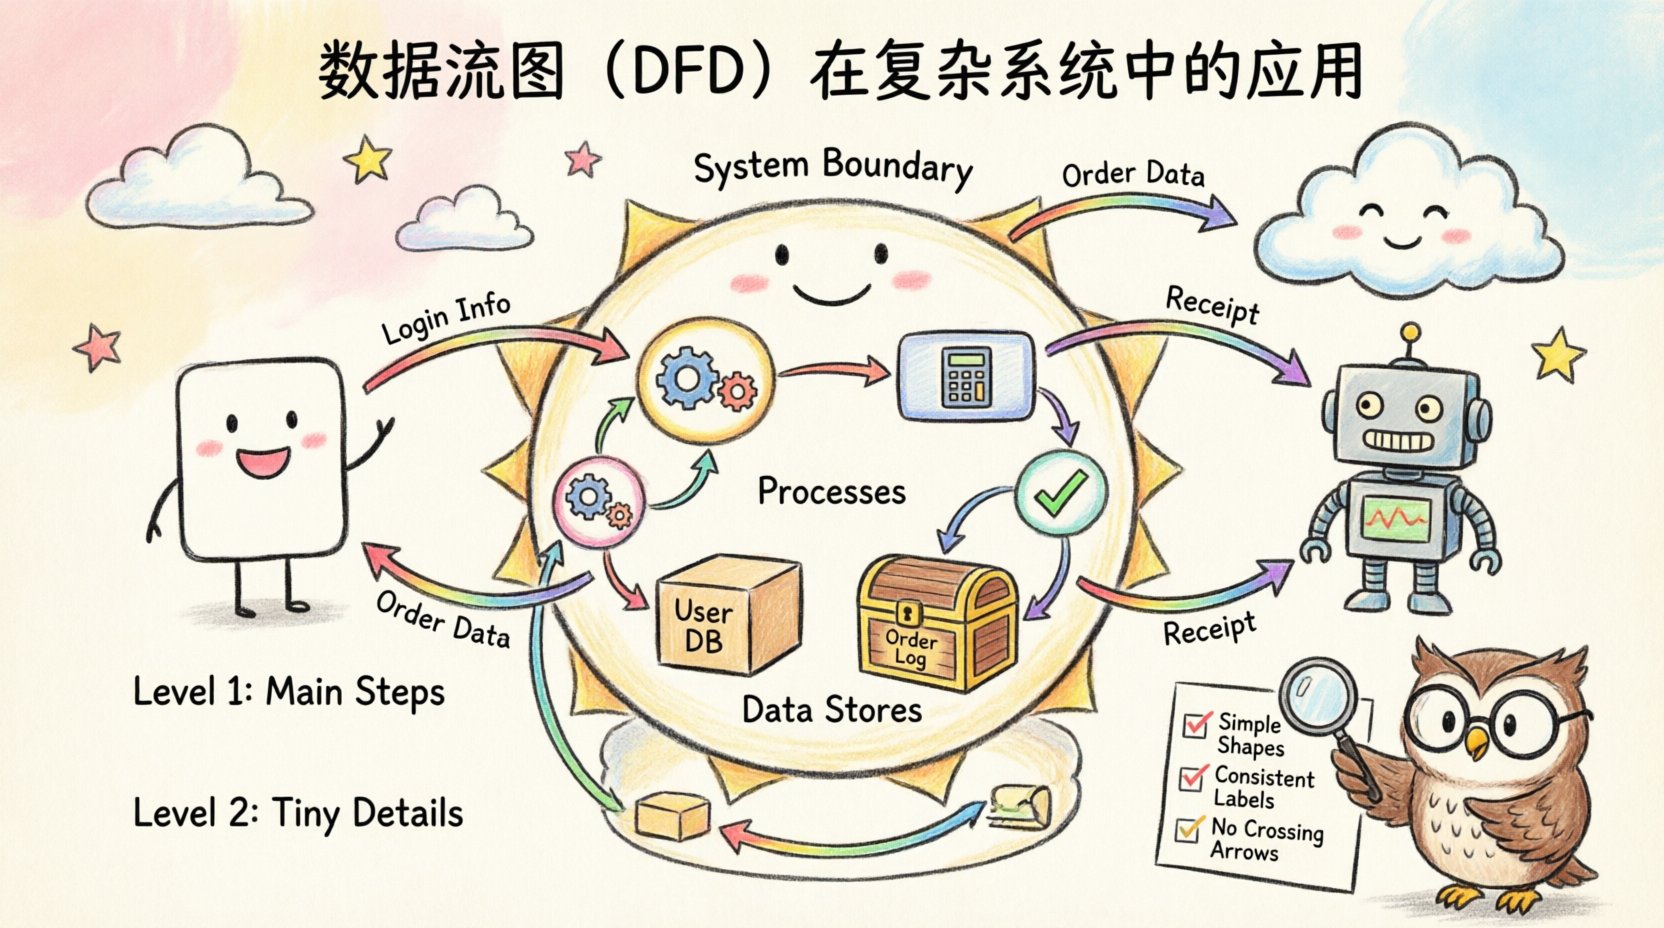
- External Entities: These are sources or destinations of data outside the system. They could be users, other systems, or hardware devices. They are usually depicted as squares or rectangles.
- Processes: A process represents a transformation of data. It takes input data, changes it, and produces output. In a complex system, processes are often nested or decomposed into smaller sub-processes.
- Data Stores: These are repositories where data is held for later use. They include databases, file systems, or even temporary memory buffers.
- Data Flows: These are the arrows connecting the components. They show the direction in which data moves. Every arrow must have a label describing the content of the data packet.
Visualizing the Symbols
| Component | Visual Shape | Function | Example |
|---|---|---|---|
| External Entity | Rectangle | Source or Sink | Customer, Payment Gateway |
| Process | Circle or Rounded Rectangle | Transformation | Calculate Tax, Validate Login |
| Data Store | Open Rectangle | Storage | User Database, Order Log |
| Data Flow | Arrow | Movement | Invoice Data, Search Query |
Consistency in labeling is paramount. Every arrow must describe the data payload. Avoid generic labels like “Information” or “Data.” Be specific, such as “Customer ID” or “Transaction Receipt.” This specificity reduces ambiguity during the development phase.
🌳 Hierarchical Decomposition
Complex systems cannot be understood in a single view. Attempting to draw every detail on one page results in a tangled mess that is impossible to read. The solution is hierarchical decomposition. This approach breaks the system down into manageable layers of abstraction.
Level 0: The Context Diagram
The top level is the Context Diagram. It shows the entire system as a single process. It identifies the major external entities and the high-level data flows entering and leaving the system. This provides the scope boundary. It answers the question: “What does the system do overall?”
- Identify the system boundary clearly.
- List all major external interactions.
- Ensure no data stores are shown at this level (data is internal to the system).
Level 1: Major Processes
The next level decomposes the single process from Level 0 into its major sub-processes. This reveals the primary functions of the system. For a complex system, this level might contain 5 to 9 processes. If there are more, the system may be too loosely coupled or require re-evaluation of module boundaries.
Level 2 and Below: Detailed Logic
Further decomposition occurs for each major process. Level 2 breaks down specific sub-processes from Level 1. This continues until the processes are simple enough to be implemented directly as code or logic without further explanation. The goal is to reach a level of granularity that developers can use for implementation.
🛠️ Step-by-Step Construction Process
Building a diagram is a disciplined activity. It requires following a sequence to ensure logical consistency. Skipping steps often leads to errors that propagate through the entire design.
- Define the Scope: Determine what is inside the system and what is outside. This boundary is the most critical decision in the diagram’s creation.
- Identify External Entities: List all users, systems, or devices that interact with the data. Do not include internal components here.
- Map High-Level Flows: Draw the arrows connecting entities to the system. Label them with the data being exchanged.
- Decompose Processes: Break down the main system function into logical steps. Ensure every input has a corresponding output.
- Add Data Stores: Identify where data must be saved. Ensure every store has at least one read and one write flow.
- Validate Balancing: Check that the inputs and outputs of a parent process match the inputs and outputs of its children.
Consistency Checks
Validation is not optional. A diagram is only useful if it is accurate. Use these checks to verify integrity:
- Black Hole Check: Ensure every process has at least one input and one output. A process with no input is a creation; a process with no output is a deletion.
- Gray Hole Check: Ensure the output data is logically derived from the input data. If a process outputs “Order Confirmation” but only receives “Search Query,” the data flow is impossible.
- Data Store Check: Ensure no direct flow exists between two data stores. Data must pass through a process to be transformed or validated before being stored.
- Entity Check: Ensure external entities are not connected directly to other external entities. All communication must pass through the system boundary.
🏗️ Navigating Complexity in Modern Architecture
Modern systems often utilize microservices, cloud infrastructure, and asynchronous messaging. These environments introduce complexity that traditional diagrams struggle to capture. Standard DFDs focus on synchronous data, but real-world systems often rely on queues and events.
Handling Asynchronous Flows
In event-driven architectures, data flows are not always immediate. A message might be placed in a queue and processed later. When diagramming this, clearly indicate the storage aspect of the queue. Treat the queue as a Data Store. This clarifies that the process is decoupled from the producer.
- Use specific labels for message types.
- Indicate whether the flow is synchronous (blocking) or asynchronous (non-blocking).
- Document the retry mechanisms in the process descriptions, not the diagram itself.
Security Considerations
Data flow diagrams should also reflect security boundaries. In complex systems, data often crosses trust zones. While the DFD does not explicitly map encryption keys, it should show where data leaves a secure zone.
- Mark flows crossing firewalls or public networks.
- Identify sensitive data types, such as Personally Identifiable Information (PII).
- Note authentication requirements at the process level.
Concurrency and State
DFDs do not typically show time. However, in concurrent systems, race conditions are a risk. When multiple processes access the same data store simultaneously, conflicts can occur. The diagram should highlight shared resources. This alerts the team to implement locking mechanisms or version control on data.
⚠️ Common Pitfalls to Sidestep
Even experienced architects make mistakes. Recognizing common errors prevents rework later in the project lifecycle.
- Too Much Detail: Trying to show every variable in a flow makes the diagram unreadable. Aggregate data where possible. Show “User Profile” instead of “First Name, Last Name, Email, Address” unless the specific fields are critical.
- Control Flow Leakage: Do not draw logic arrows, such as “if error” or “loop.” DFDs show data, not control. If a decision changes the data path, show the different data flows resulting from the decision.
- Inconsistent Naming: Use the same terminology throughout. If a process is called “Calculate Total” in one place, do not call it “Sum Amount” in another. This confuses developers and maintains ambiguity.
- Missing Data Stores: Sometimes diagrams omit storage to look cleaner. Never do this. If data persists, it must be stored. If it is transient, it is not a store.
- Overlapping Boundaries: Ensure the system boundary is distinct. Do not allow external entities to appear inside the process cloud.
🔄 Keeping Diagrams Current
A diagram is a snapshot of the system at a specific point in time. As the system evolves, the diagram becomes outdated. In agile environments, this is a constant challenge. The diagram must remain a living document.
Integration with Development
Update the diagram when the code changes. If a new API endpoint is added, the DFD must reflect the new data flow. If a database schema is altered, the data store representation should update. This ensures that documentation matches the reality of the codebase.
- Assign ownership of the diagram to a specific role, such as the System Architect or Lead Engineer.
- Review the diagram during sprint planning or design reviews.
- Version control the diagram files alongside the code repository.
Documentation Standards
Accompany the visual diagram with text. The diagram shows the “what,” while the text explains the “how” and “why.” Include a legend for complex symbols. Add a glossary of terms to ensure everyone interprets labels the same way.
🤝 Collaboration and Communication
The primary value of a DFD is communication. It bridges the gap between technical and non-technical stakeholders. Business analysts can use the diagram to verify requirements. Developers use it to understand integration points. QA teams use it to design test cases.
- For Business Stakeholders: Focus on Level 0 and Level 1 diagrams. These show the high-level value and major inputs/outputs without technical clutter.
- For Developers: Provide Level 2 and deeper diagrams. These show the specific data transformations required for implementation.
- For Operations: Highlight data stores and security boundaries. They need to know where data lives and how it is protected.
📝 Summary of Best Practices
Success in creating Data Flow Diagrams relies on discipline and adherence to standards. It is not about making the diagram look artistic; it is about making it accurate and functional. Here are the core takeaways for maintaining high quality.
- Simplicity: Use the fewest symbols necessary to convey the logic.
- Consistency: Maintain uniform naming and notation conventions.
- Completeness: Ensure every data flow has a source and a destination.
- Clarity: Avoid crossing lines where possible. Use connectors to manage complexity.
- Validation: Regularly review the diagram against the actual system behavior.
By treating the Data Flow Diagram as a critical deliverable rather than an optional artifact, teams reduce risk and improve efficiency. The investment in clear documentation pays dividends during maintenance, debugging, and future expansion phases. A clear map ensures that the journey through the system architecture remains navigable for everyone involved.
Ultimately, the goal is to demystify the complexity. When data flows are clear, system design becomes more robust. Stakeholders gain confidence in the architecture. The path from requirement to implementation becomes smoother. This clarity is the foundation of reliable software engineering.