


Creating a Data Flow Diagram (DFD) is a critical step in system analysis and design. These visual representations map the movement of data through a system, highlighting inputs, outputs, and storage. When drawn accurately, a DFD serves as a blueprint for developers and stakeholders, ensuring everyone understands the logic and flow of information. However, creating a precise diagram requires discipline and adherence to specific standards. This guide outlines the essential practices for drawing effective Data Flow Diagrams without relying on specific software tools.
🔍 Understanding the Purpose of a DFD
Before diving into the mechanics, it is important to understand why these diagrams matter. A Data Flow Diagram is not a flowchart. It does not show control flow or decision points like “if-then” statements. Instead, it focuses strictly on the data itself. It answers questions like: Where does the data come from? Where does it go? How is it transformed? Where is it kept?
- Communication Tool: It bridges the gap between technical teams and business stakeholders.
- Analysis Aid: It helps identify bottlenecks, missing data, or redundant processes.
- Design Foundation: It provides the structure for database design and code architecture.
🧱 The Core Components of a DFD
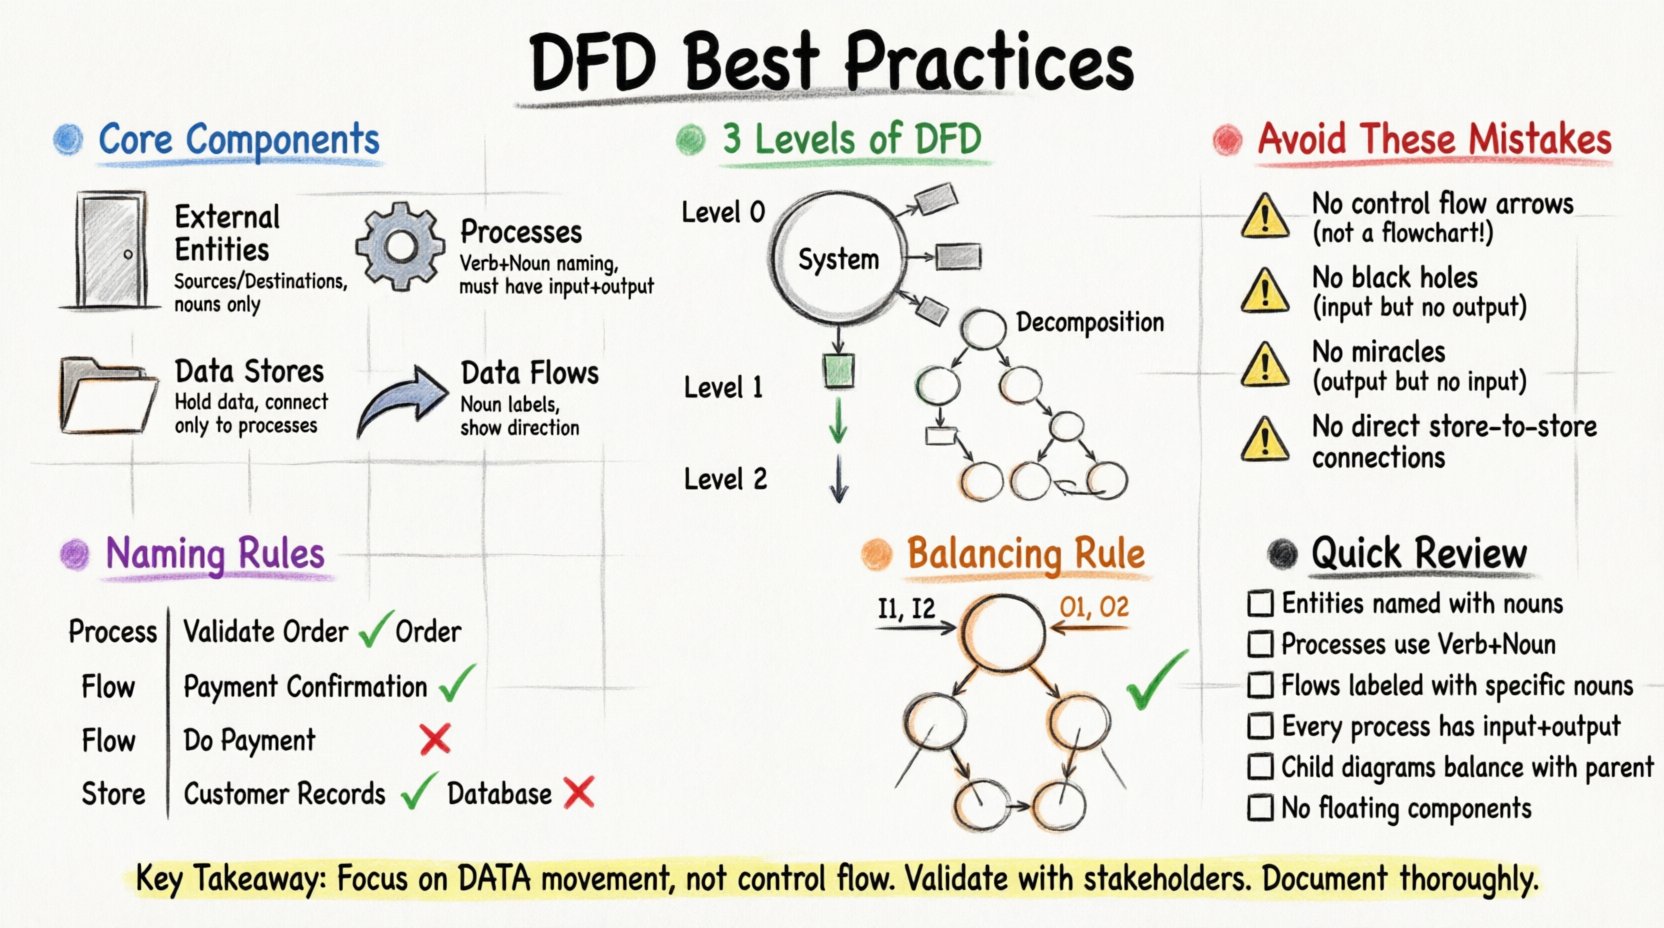
To draw an accurate diagram, you must master the four fundamental symbols. Each has a strict definition that must be followed to maintain consistency.
1. External Entities (Sources and Destinations) 🚪
These represent the people, organizations, or systems that interact with your system. They are the boundaries of your scope. Data flows in from them or out to them. They are not part of the system itself.
- Example: A Customer, a Vendor, or an External Payment Gateway.
- Rule: Do not confuse a user inside the system with an external entity. Only external sources or sinks belong here.
2. Processes (Transformations) ⚙️
Processes are where data changes. They take input data, manipulate it, and produce output data. They are the heart of the system. Every process must have at least one input and one output.
- Example: Calculate Tax, Validate Login, Generate Report.
- Rule: Name processes using verbs. A process is an action, not a noun.
3. Data Stores (Repositories) 📂
Data stores hold data for later use. They represent databases, files, or even physical filing cabinets. Unlike processes, data stores do not change the data; they simply hold it.
- Example: Customer Database, Order Log, Inventory List.
- Rule: Data stores must be connected to processes. Data cannot just appear in or disappear from a store without a process handling it.
4. Data Flows (Movement) 🔄
These are the arrows that connect the components. They show the direction of data movement. Every arrow must have a label describing exactly what data is moving.
- Example: Order Details, Payment Confirmation, User Credentials.
- Rule: Arrows should be labeled with nouns, not verbs. The label describes the content of the flow.
📉 Levels of Abstraction in DFDs
Complex systems cannot be shown on a single page. It is standard practice to break down a system into levels. This is known as decomposition.
Level 0: The Context Diagram 🌍
The Context Diagram is the highest level view. It shows the entire system as a single bubble. It connects this single process to all external entities. It defines the boundaries clearly.
- Focus: Inputs and Outputs only.
- Detail: Minimal. No internal processes or data stores.
Level 1: The Main Processes 🔢
Level 1 breaks the single bubble of the Context Diagram into major sub-processes. This is where you start to see the internal logic. It typically contains the main functional areas of the system.
- Focus: Major functional groups.
- Detail: Includes major data stores and flows between the main processes.
Level 2: Detailed Breakdown 🔍
Level 2 decomposes one specific process from Level 1. It is used when a specific process is too complex to understand at the Level 1 view.
- Focus: Specific, complex operations.
- Detail: High granularity. Shows every step of that specific function.
✍️ Naming Conventions for Clarity
Naming is the most common source of confusion in DFDs. Clear names prevent misunderstandings between analysts and developers.
Process Names
Always use a verb followed by a noun. This describes an action being performed on data.
- Good: “Validate User Login”
- Bad: “Login” or “User Login Process”
Data Flow Names
Use the specific noun representing the data packet moving.
- Good: “Validated Credentials”
- Bad: “Login Data” or “Do Login”
Data Store Names
Use the noun representing the collection of data.
- Good: “User Accounts”
- Bad: “Users” or “Database”
⚖️ Balancing and Conservation of Data
One of the most critical rules in DFD design is balancing. When you decompose a parent process into child processes, the inputs and outputs must remain consistent.
What is Balancing?
Imagine you have a Level 1 process called “Process Order.” This process receives “Customer Order” and outputs “Shipping Confirmation.” If you break “Process Order” down into Level 2 sub-processes, those sub-processes combined must still receive “Customer Order” and produce “Shipping Confirmation.”
Why is this Important?
- Consistency: It ensures that no data is lost during decomposition.
- Traceability: It allows you to trace every piece of data from the top level down to the bottom level.
- Validation: It acts as a check for missing requirements.
How to Check for Balancing
- List all inputs and outputs of the parent process.
- List all inputs and outputs of the child processes.
- Compare the two lists. They must match exactly.
🚫 Common Mistakes to Avoid
Even experienced analysts make errors. Avoiding these common pitfalls will improve the quality of your diagrams significantly.
1. Mixing Control Flow with Data Flow
A DFD is not a flowchart. Do not use arrows to show the sequence of events or decisions. If a decision is made, the data still flows to a process that handles the outcome. The arrow represents data, not control.
2. Black Holes and Miracles
- Black Hole: A process that has inputs but no outputs. This implies data is disappearing, which is logically impossible.
- Miracle: A process that has outputs but no inputs. This implies data is created out of nowhere.
3. Unconnected Components
Every component must be connected to at least one other component via a data flow. A floating process or a disconnected data store indicates an error in logic.
4. Data Stores without Processes
Data stores cannot talk to each other directly. There must always be a process between two data stores. This ensures that data is validated or transformed before being stored or retrieved.
📋 DFD Review Checklist
Use this table to validate your work before finalizing the diagram. This ensures a high standard of accuracy.
| Check | Criteria | Pass/Fail |
|---|---|---|
| Entity Naming | Are all external entities named with nouns? | ⬜ |
| Process Naming | Are all processes named with Verb + Noun? | ⬜ |
| Flow Naming | Are all data flows labeled with specific nouns? | ⬜ |
| Conservation | Does every process have at least one input and one output? | ⬜ |
| Balancing | Do child diagrams match parent inputs/outputs? | ⬜ |
| Connectivity | Are there any floating components? | ⬜ |
| Data Stores | Are data stores connected only to processes? | ⬜ |
| External Entities | Are external entities never connected to other entities? | ⬜ |
🔄 Logical vs. Physical DFDs
It is important to distinguish between the logical view of the system and the physical view. Both are valid, but they serve different purposes.
Logical DFD
This focuses on the business requirements. It ignores how the system is actually built. It answers “What does the business do?”
- Example: “Process Payment” is a process.
- Benefit: It remains valid even if the technology changes.
Physical DFD
This focuses on the implementation. It answers “How is the system built?” It includes specific hardware, software modules, or manual tasks.
- Example: “Run Credit Card API” or “Print Receipt on Laser Printer”.
- Benefit: It guides developers and engineers directly.
🤝 Stakeholder Engagement
A DFD is a communication tool. It is useless if the stakeholders do not understand it or if it does not reflect their reality.
- Walkthroughs: Schedule sessions where you walk stakeholders through the diagram step-by-step.
- Feedback Loops: Allow stakeholders to point out missing data flows or incorrect process names.
- Validation: Ensure the diagram matches their mental model of how the business operates.
When stakeholders validate the diagram, it becomes a contract of sorts. It confirms that the system design meets the business needs. This reduces the risk of rework later in the development cycle.
🛠️ Maintaining Diagrams Over Time
Systems evolve. Requirements change. A DFD that was accurate yesterday might be outdated today. To keep your documentation valuable, you must maintain it.
- Version Control: Keep records of different versions of the DFD to track changes over time.
- Update Triggers: Establish rules for when a DFD needs updating (e.g., new feature request, process change).
- Central Repository: Store diagrams in a location accessible to the whole team.
🔎 Deep Dive: Handling Complex Data Flows
Sometimes, data flows are complex. They may carry multiple pieces of information or change based on conditions. Here is how to handle them without cluttering the diagram.
Grouping Data
Do not draw an arrow for every single data field. Group related data into a logical packet.
- Example: Instead of drawing arrows for “Name”, “Address”, and “Phone” separately, draw one arrow labeled “Customer Information”.
Conditional Flows
While DFDs do not typically show decision logic, sometimes data only flows under certain conditions. You can label the arrow to indicate this.
- Example: Label an arrow “Approved Order” to distinguish it from “Rejected Order”.
📝 Documentation Best Practices
The diagram is only part of the story. You must document the definitions of the components to ensure clarity.
- Glossary: Create a glossary for all terms used in the diagram (e.g., what defines a “Validated User”?).
- Process Specifications: For complex processes, write a short description of the logic involved.
- Data Dictionary: Define the structure of the data stores and flows.
Documentation supports the diagram. It provides the necessary context that the visual symbols cannot convey. Without it, the diagram is open to interpretation.
🎯 Summary of Key Takeaways
Accurate Data Flow Diagrams are built on consistency, clarity, and strict adherence to rules. By following the practices outlined here, you can create diagrams that effectively communicate system logic.
- Focus on Data: Keep the focus on data movement, not control flow.
- Use Consistent Naming: Verbs for processes, nouns for data.
- Decompose Carefully: Maintain balance between levels.
- Validate with Stakeholders: Ensure the model reflects reality.
- Document Thoroughly: Provide context alongside the visuals.
Investing time in drawing accurate DFDs pays off in reduced development errors and clearer communication. It sets a strong foundation for any system analysis project.