


Data Flow Diagrams (DFDs) serve as a foundational tool in systems analysis and design. They provide a visual representation of how data moves through a system, highlighting processes, data stores, external entities, and the flows connecting them. However, creating a valid DFD is not always straightforward. Errors can creep in during the modeling process, leading to logical inconsistencies that compromise the entire system architecture.
This guide provides a comprehensive approach to identifying and resolving common issues found in Data Flow Diagrams. By following structured troubleshooting methods, analysts can ensure their models accurately reflect system requirements and operational realities.
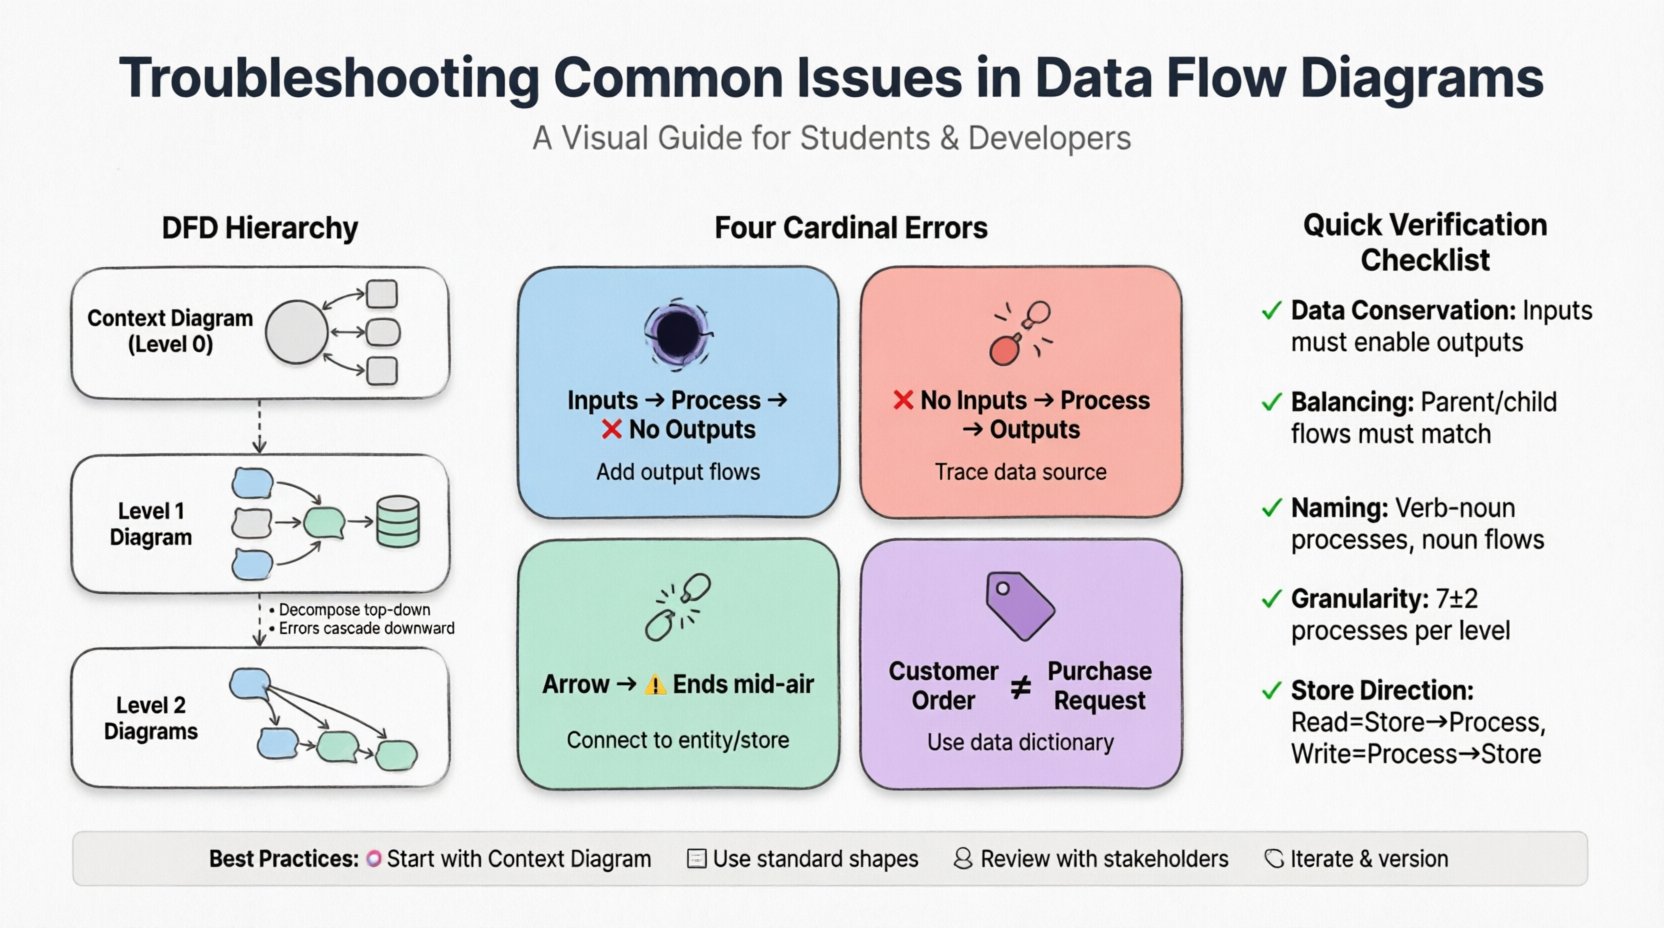
Understanding the Hierarchy of DFDs 🏗️
Before troubleshooting specific errors, it is essential to understand the structure of a DFD. A complete modeling effort typically involves a hierarchy of diagrams:
- Context Diagram (Level 0): The highest level view. It shows the system as a single process interacting with external entities. It defines the system boundaries.
- Level 1 Diagram: Decomposes the main process from the Context Diagram into major sub-processes. It reveals the primary data stores and major flows.
- Level 2 Diagrams: Further decomposes specific processes from Level 1 into more granular steps.
Troubleshooting often begins at the Context level and cascades down. Inconsistencies at the top level will propagate errors through all lower-level diagrams.
The Four Cardinal Errors 🚫
There are four specific types of logical errors that frequently appear in DFDs. Identifying these requires a careful review of data inputs and outputs for every process.
1. The Black Hole
A Black Hole occurs when a process has inputs but no outputs. This implies that data enters the process and disappears without any result or transformation being recorded. In a real-world system, this is impossible. Every input should trigger some action, whether it is storing data, sending a response, or updating a record.
How to fix:
- Trace every data flow entering the process.
- Verify if the process is supposed to generate a report, update a database, or trigger a notification.
- If no output exists, add the necessary data flows to ensure data conservation.
2. The Miracle
The opposite of a Black Hole is a Miracle. This happens when a process produces outputs without any inputs. It suggests that data is being generated out of thin air. This is a critical logical flaw because every piece of data must originate from somewhere within the system or an external source.
How to fix:
- Identify the data element being produced.
- Determine the source of this data (e.g., a user input, a sensor reading, or a previous process).
- Add the missing input flow to the process bubble.
3. Dangling Data
Dangling Data refers to a flow that does not connect to anything. This could be a line that stops abruptly in the middle of the diagram or connects to a blank space. It indicates a break in the data path.
How to fix:
- Ensure every arrow connects a source to a destination.
- Check if a data store or external entity is missing.
- Verify that the destination process actually requires this specific data element.
4. Inconsistent Naming
Data flows must be labeled consistently across all levels. If a flow is labeled “Customer Order” in the Level 1 diagram, it should not be renamed to “Purchase Request” in the Level 2 diagram unless the meaning has fundamentally changed. Inconsistent naming confuses stakeholders and developers.
How to fix:
- Create a data dictionary to standardize terminology.
- Perform a cross-reference check between parent and child diagrams.
- Ensure that the name of a flow entering a process matches the name of the flow exiting the same process (unless transformed).
Process Granularity and Decomposition 🧩
One of the most common issues in DFDs is improper decomposition. A process bubble should not be too large (too much logic) nor too small (trivial steps).
Too Many Processes
If a Level 1 diagram has more than seven to nine processes, it becomes difficult to read and manage. This often indicates that the analyst has not grouped related functions together.
- Solution: Group processes by functional area or business capability.
- Solution: Consider if a process should be split into two separate processes if it handles two distinct logical functions.
Too Few Processes
Conversely, if a process is responsible for handling everything from user login to database backup, it is too complex. This makes it impossible to design specific algorithms or interfaces for that bubble.
- Solution: Decompose complex processes into sub-processes for Level 2 diagrams.
- Solution: Ensure each process has a single verb-noun name (e.g., “Validate Login” instead of “Login and Validate and Save”).
Data Store Integrity 🗄️
Data stores represent the repositories where data is saved for future use. Errors here can lead to data loss or corruption.
Missing Data Stores
It is common to forget to add a data store when a process needs to save information for later retrieval. For example, a “Process Order” function must save the order details somewhere before the transaction is complete.
- Check: Look for processes that modify state without a corresponding data store connection.
Incorrect Data Flow Direction
Arrows connecting data stores must indicate the correct direction of data movement. A flow from a data store to a process means reading data. A flow from a process to a data store means writing data. Confusing these can lead to logic errors in database design.
- Check: Verify that read operations go from Store to Process.
- Check: Verify that write operations go from Process to Store.
Verification and Validation Techniques 🧐
Once the diagram is drawn, it must be validated against the actual business requirements. Several techniques help ensure accuracy.
1. The Data Conservation Rule
This rule states that the inputs and outputs of a process must be sufficient to perform the function described. If a process is labeled “Calculate Tax,” the inputs must include the taxable amount and the tax rate, and the output must be the calculated tax value.
2. The Process Decomposition Rule
Inputs and outputs at Level 1 must match the aggregate inputs and outputs of the child processes at Level 2. If the Level 1 diagram shows an input “Customer ID” entering the “Process Order” bubble, the Level 2 child diagram must show “Customer ID” entering at least one of the child processes.
3. Balancing Check
Ensure that the data flows entering a parent process are the same as the data flows entering the collection of child processes. This maintains the integrity of the hierarchy.
Common Troubleshooting Checklist 📋
Use the following table to systematically review your diagrams.
| Issue Type | Description | Impact | Remediation Step |
|---|---|---|---|
| Black Hole | Process has inputs but no outputs | Data loss; broken workflow | Add output flows or redefine process function |
| Miracle | Process has outputs but no inputs | Invalid data generation | Trace data source and add input flows |
| Dangling Flow | Arrow does not connect to anything | Broken data path | Connect to appropriate entity, process, or store |
| Naming Inconsistency | Same data named differently | Confusion for developers | Standardize terminology in data dictionary |
| Unbalanced Decomposition | Child inputs/outputs differ from parent | Logic gaps in hierarchy | Adjust flows to match parent process |
Naming Conventions and Clarity 🏷️
Clear naming is crucial for stakeholder communication. Process names should be verbs followed by nouns (e.g., “Update Inventory”). Data flow names should be nouns (e.g., “Inventory Report”).
When troubleshooting naming issues:
- Avoid Acronyms: Use full words unless the acronym is universally understood within the organization.
- Be Specific: “Data” is too vague. Use “Customer Address” or “Payment Record”.
- Consistent Tense: Keep process names in the present tense (“Generate Report” not “Generated Report”).
Integration with Other Models 🔄
Data Flow Diagrams do not exist in isolation. They often need to align with other modeling techniques.
Entity Relationship Diagrams (ERD)
DFD data stores should align with the tables defined in an ERD. If a DFD shows a data store “Customer Info” but the ERD has “Users” and “Contact_Details”, the DFD needs to be adjusted to reflect the physical database structure.
State Transition Diagrams
DFDs focus on data movement, while State Diagrams focus on system states. Ensure that the processes in the DFD correctly trigger the state changes identified in the State Diagram.
Maintaining the Diagram Over Time 📅
Systems evolve. A DFD created during the requirements phase may become outdated after the implementation phase. Maintenance requires a version control strategy.
- Versioning: Label each diagram with a version number and date.
- Change Logs: Document why a change was made (e.g., “Updated to reflect new payment gateway”).
- Review Cycles: Schedule periodic reviews with business stakeholders to ensure the diagram still matches business reality.
Tools vs. Manual Review 🖥️
While modeling tools exist to assist with DFD creation, they are not infallible. Automated tools can check for syntax errors (like dangling lines), but they cannot verify business logic. A human analyst must review the diagram to ensure it makes sense in the context of the business operations.
When using generic modeling software:
- Utilize the built-in validation features to check for basic connectivity.
- Do not rely on the software to name your processes; use human judgment.
- Export diagrams to PDF for stakeholder reviews where editing is disabled to prevent accidental changes.
Case Study: Troubleshooting a Retail System 🛒
Consider a scenario where a retail system DFD was failing during user acceptance testing.
The Problem
Users reported that inventory levels were not updating when sales were made. The Level 1 diagram showed a process “Process Sale” taking “Sale Details” as input.
The Diagnosis
Upon closer inspection of the Level 2 decomposition, the “Process Sale” bubble was split into “Calculate Total” and “Record Transaction”. However, the data flow connecting “Record Transaction” to the “Inventory Store” was missing. This was a classic Black Hole on the inventory side, even though the process itself had an output.
The Resolution
Analysts added the data flow “Inventory Update” from the “Record Transaction” process to the “Inventory Store”. The system was re-tested, and inventory levels updated correctly.
Best Practices for Analysts 👨💻
To minimize troubleshooting efforts in the future, adopt these practices from the start:
- Start Small: Begin with a clear Context Diagram before decomposing.
- Use Templates: Adopt standard shapes for processes (rounded rectangles) and data stores (open-ended rectangles) to avoid confusion.
- Engage Stakeholders: Walk through the diagram with business users. If they understand the flow, it is likely correct.
- Iterate: Expect to redraw diagrams multiple times. The first draft is rarely the final version.
Conclusion on System Integrity ✅
Troubleshooting Data Flow Diagrams is a critical skill for ensuring system reliability. By understanding the four cardinal errors, maintaining naming consistency, and validating against business rules, analysts can create robust models. These models serve as the blueprint for developers, ensuring that the final software behaves as intended.
Regular review and adherence to the data conservation rules will prevent logical gaps. Remember that a DFD is a communication tool as much as it is a technical document. Clarity for the reader is just as important as accuracy for the machine.