


In the landscape of system analysis and software engineering, visualizing information movement is paramount. A Data Flow Diagram, commonly abbreviated as DFD, serves as a graphical representation of the flow of data through an information system. Unlike flowcharts that map control flow, a DFD focuses strictly on data inputs, outputs, and storage. This distinction is critical for architects and analysts who need to understand what data a system handles without becoming entangled in the procedural logic of how that data is processed.
Developed in the 1970s, the DFD remains a cornerstone technique for requirements engineering. It provides a high-level view of a system, allowing stakeholders to validate that all necessary data inputs are captured and all required outputs are generated. By breaking complex systems into manageable components, DFDs facilitate communication between technical teams and business users. This guide details the structural elements, notation variations, and methodological rules required to construct accurate diagrams.
Core Components of a Data Flow Diagram 🔍
To construct a valid DFD, one must understand the four fundamental building blocks. Every diagram, regardless of complexity, relies on these elements to depict the system’s boundaries and internal operations. Misidentifying these components can lead to models that are ambiguous or logically inconsistent.
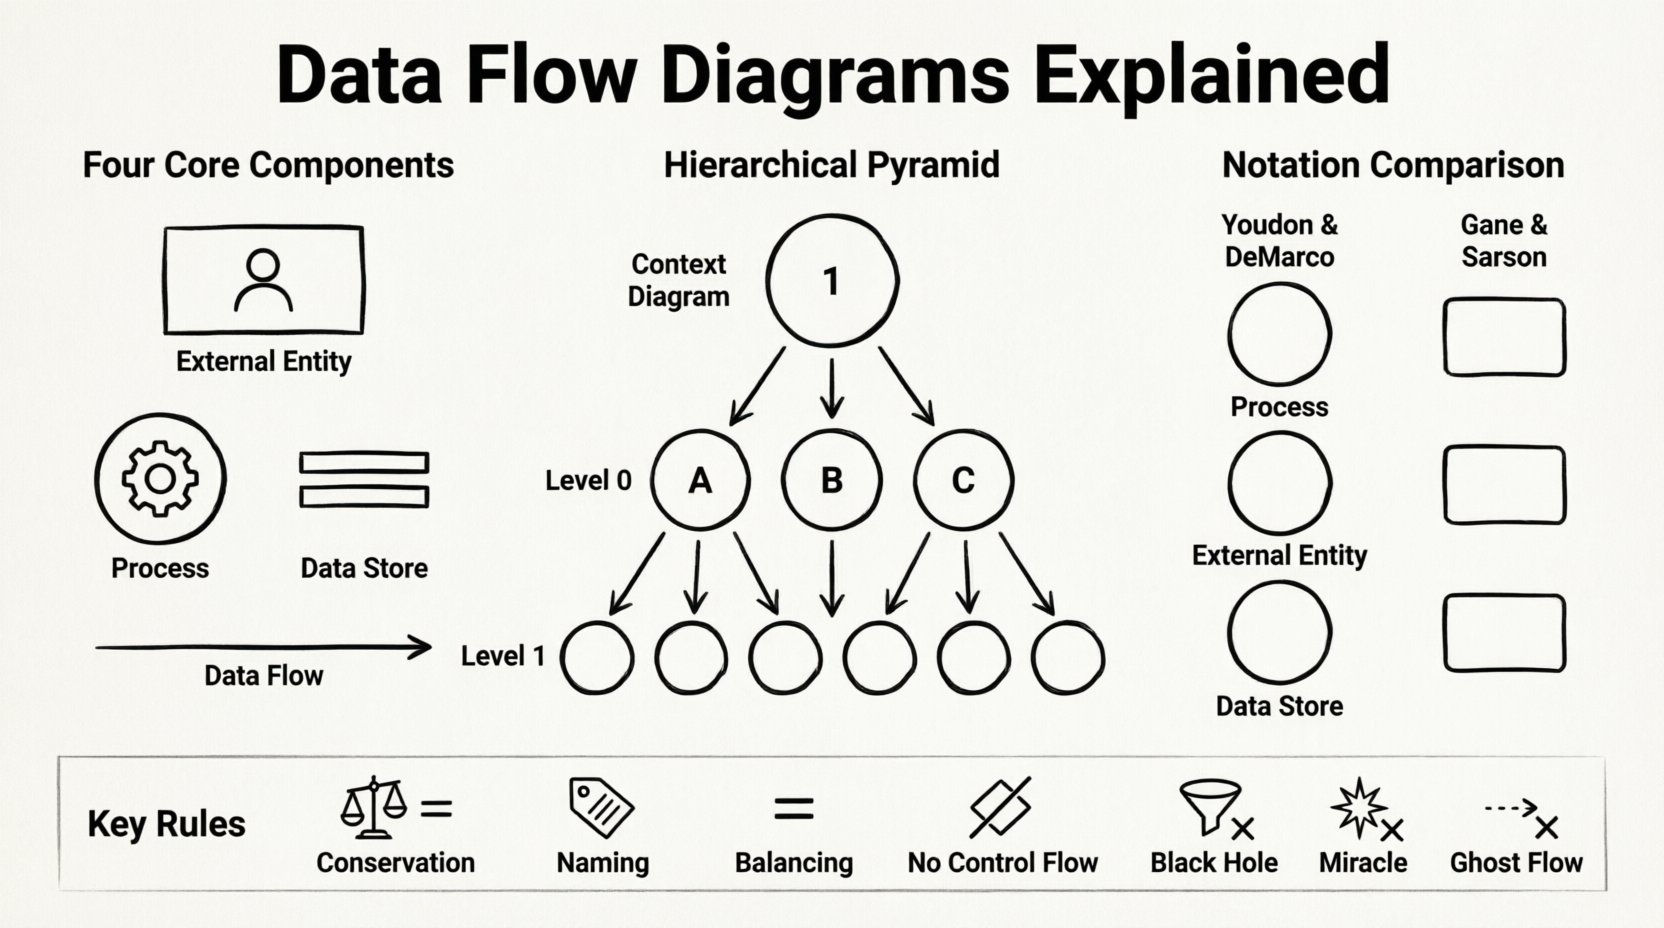
- External Entities: Also known as terminators or sources, these represent people, organizations, or external systems that interact with the system being modeled. They are the starting or ending points of data flows. An entity exists outside the system boundary and sends data into the system or receives data from it. For example, a customer placing an order or a government tax agency receiving reports.
- Processes: These are the actions or transformations that occur within the system. A process takes data from one or more sources, modifies it, and sends it to other destinations. It is crucial to remember that a process does not store data; it only transforms it. Processes are typically labeled with a verb phrase, such as “Calculate Tax” or “Verify User Credentials”.
- Data Stores: These represent repositories where data is held for later use. Unlike processes, data stores do not perform calculations. They are passive containers. In a physical context, these might be database tables, files, or physical filing cabinets. In a logical context, they simply denote where information is persisted. Data flows must enter and leave data stores to indicate updates or retrievals.
- Data Flows: These are the arrows connecting the components. They represent the movement of data. A data flow must have a name that describes the content of the data packet, such as “Order Details” or “Payment Confirmation”. Every data flow should connect two components; it cannot start or end in mid-air.
Types of Data Flow Diagrams 🗺️
DFDs are hierarchical. A complex system cannot be understood in a single view. Therefore, the standard practice is to decompose the system into multiple levels of abstraction. This approach allows analysts to zoom in on specific areas without losing the context of the whole.
1. Context Diagram (Level 0)
This is the highest level of abstraction. It depicts the entire system as a single process bubble. It shows the relationship between the system and the external entities. No internal processes or data stores are visible at this stage. The purpose is to define the system boundary clearly. It answers the question: “What does this system do for the outside world?”
2. Level 0 Diagram (Diagram 0)
Also known as the conceptual model, this diagram explodes the single process from the Context Diagram into major sub-processes. It provides a roadmap of the system’s major functions. It shows how the major data flows connect the primary processes to the data stores and external entities. It is often the first step in detailed design.
3. Level 1 and Decomposition
As the analysis deepens, Level 0 processes are broken down further into Level 1 diagrams. This continues until the processes are simple enough to be implemented directly. Each child diagram must balance with its parent. This means the inputs and outputs of a process in the parent diagram must match the inputs and outputs of the child diagram containing the exploded process.
Notation Standards Comparison 📐
There is no single universal standard for drawing DFDs. Two major schools of thought dominate the industry. Both convey the same logical information but use different shapes to represent components. Selecting one standard and sticking to it is vital for consistency within a project.
| Component | Yourdon & DeMarco Notation | Gane & Sarson Notation |
|---|---|---|
| Process | Circle or Rounded Rectangle | Rounded Rectangle |
| Data Store | Two parallel horizontal lines | Open-ended rectangle |
| External Entity | Rectangle | Rectangle |
| Data Flow | Curved or Straight Arrow | Straight Arrow |
| Annotation | Text near the flow | Text near the flow |
While the shapes differ, the rules governing the connections remain identical. The Yourdon & DeMarco style is often preferred in older legacy documentation, whereas the Gane & Sarson style is frequently adopted in modern systems due to its cleaner rectangular aesthetics.
The Logical vs. Physical Distinction 🔄
A critical concept in DFD modeling is the separation of logical design from physical design. This distinction ensures that the model remains valid even if the underlying technology changes.
- Logical DFD: Focuses on the business requirements. It describes what the system does, not how it does it. In a logical diagram, a “Database” might be represented generically as a data store, without specifying if it is SQL, NoSQL, or a flat file. A “Process” might be “Approve Loan” regardless of whether the approval is done by a human, a script, or an AI algorithm.
- Physical DFD: Focuses on the implementation details. It describes how the system is built. Here, the data store might be specified as “Oracle Tables in Server A”. The process might be “Java Servlet Processing Request”. Physical diagrams are used by developers during the coding phase.
Mixing these levels in a single diagram creates confusion. It is best practice to maintain a logical view for stakeholder review and a physical view for technical implementation.
Rules for Constructing a DFD ⚙️
Creating a diagram is not merely about drawing shapes; it is about adhering to strict logical rules. Violating these rules renders the diagram technically invalid and useless for analysis.
1. Conservation of Data
Data cannot be created or destroyed within a process. If data enters a process, it must either leave the process or be stored. A process cannot output data that was not input, unless that data is derived from other inputs. This prevents “miracles” in the system design.
2. Naming Conventions
Every element must have a unique name. Data flows should be nouns (e.g., “Invoice”). Processes should be verb-noun phrases (e.g., “Process Invoice”). Data stores should be plural nouns (e.g., “Invoices”). Consistency in naming allows for easier navigation and understanding of the system.
3. Balancing
This rule applies to the hierarchical decomposition. If a process is broken down into sub-processes, the inputs and outputs of the parent process must equal the sum of the inputs and outputs of the child processes. No data can disappear or appear magically during decomposition.
4. Avoiding Control Flow
DFDs are not control flow diagrams. They do not show decision points like “If X, then Y”. They show the movement of data. Decision logic is handled within the process description, not on the diagram itself. This keeps the visual representation clean and focused on data.
Common Pitfalls to Avoid ❌
Even experienced analysts can introduce errors into a DFD. Being aware of common mistakes helps maintain the integrity of the model.
- Black Holes: A process that has inputs but no outputs. This implies data is being consumed and never used, which is a logical error.
- Miracles: A process that has outputs but no inputs. This implies data is being generated out of thin air.
- Ghost Flows: Data flows that do not connect to any component. Every arrow must have a clear source and destination.
- Overlapping Functions: When a single process box tries to do too much. If a process box has more than seven inputs or outputs, it is likely trying to do too many things and should be split.
- External Entity Cycles: External entities should not connect directly to other external entities. All interaction must go through the system boundary.
Benefits in System Analysis 🛠️
Why invest time in creating these diagrams? The value extends beyond simple documentation.
- Communication: It bridges the gap between technical and non-technical stakeholders. Visual models are easier to discuss than text requirements.
- Gap Analysis: By mapping the flow, analysts can identify missing data requirements. If a user needs a report, but there is no data flow leading to a data store that supports that report, a gap is identified early.
- Testing Foundation: The data flows define the test cases. If a specific data flow is defined, a test must verify that data moves correctly through that flow.
- System Documentation: As systems evolve, DFDs serve as a living map. When new features are added, the diagram is updated, ensuring documentation remains synchronized with the code.
Frequently Asked Questions ❓
What is the difference between a DFD and a Flowchart?
A flowchart maps the control logic and decision points of an algorithm. It shows the sequence of steps. A DFD maps the data. It shows where data comes from and goes, regardless of the order of operations. Flowcharts are for code logic; DFDs are for system architecture.
Can a DFD show security controls?
Standard DFDs do not explicitly show security protocols like encryption or authentication. However, a security analyst can annotate data flows to indicate where sensitive data is handled or where access controls are enforced. It is often represented as a note attached to the specific data flow.
Is there a specific tool required to draw DFDs?
No. While many software tools exist, the diagram is a conceptual artifact. It can be drawn on paper, whiteboards, or using any vector graphics tool. The medium does not change the logic of the model.
How do DFDs handle real-time data?
DFDs are generally static representations. They do not inherently show timing or latency. For real-time systems, DFDs are often paired with state transition diagrams or timing diagrams to capture the temporal aspects of data movement.
Conclusion on Methodology
Constructing a Data Flow Diagram is a disciplined exercise in abstraction. It requires the analyst to strip away implementation details and focus on the essence of data movement. By adhering to the structural rules and notation standards, teams can create a clear blueprint of their information systems. This clarity reduces risk, improves communication, and ensures that the final system meets the actual needs of the data it processes.
The DFD remains relevant because it addresses a fundamental question: “Where does the data go?” In an era of complex, distributed systems, tracing the path of information is more critical than ever. Whether for a simple web application or a large-scale enterprise system, the principles of DFD modeling provide a stable foundation for design and analysis.