


Data Flow Diagrams (DFDs) act as a critical blueprint for system analysis and design. They provide a visual representation of how information moves through a system, focusing on the flow of data rather than the control logic. Whether you are designing a new enterprise resource planning system or analyzing an existing legacy application, understanding the movement of data is essential for clarity and efficiency. This guide explores the mechanics, rules, and best practices for creating effective DFDs without relying on specific commercial tools.
What is a Data Flow Diagram? 🤔
A Data Flow Diagram is a structured analysis technique used to visualize the flow of data within a system. It breaks down a complex system into smaller, manageable parts, showing how data is input, processed, stored, and output. Unlike other diagrams that might focus on time sequences or decision logic, DFDs strictly track data entities and their transformations.
These diagrams serve several critical purposes in the software development lifecycle:
- Communication: They bridge the gap between technical teams and stakeholders by providing a visual language.
- Gap Analysis: They help identify missing processes or data paths during the requirements gathering phase.
- Documentation: They act as a reference for future maintenance and troubleshooting.
- Optimization: They reveal bottlenecks where data accumulates or moves inefficiently.
DFDs are hierarchical. A complex system is rarely depicted in a single view. Instead, it is decomposed into multiple levels of detail, allowing analysts to zoom in on specific areas as needed.
The Four Core Components 🧩
To construct a valid Data Flow Diagram, you must understand the four fundamental building blocks. Every element in a DFD falls into one of these categories.
| Component | Symbol Description | Function | Example |
|---|---|---|---|
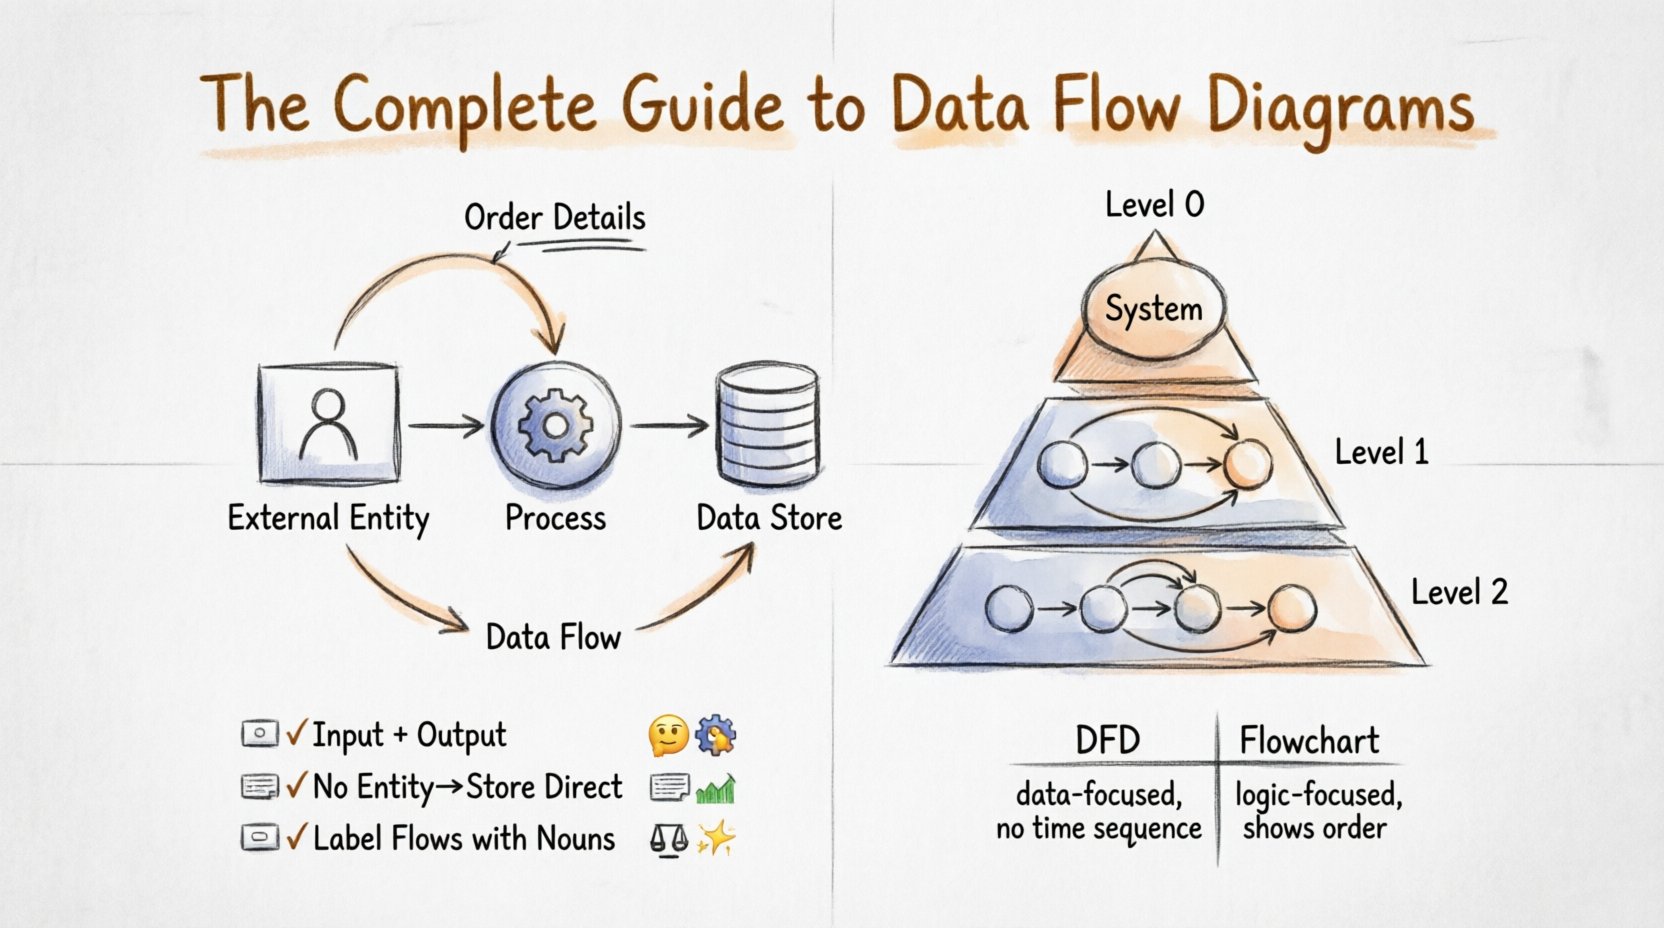
| External Entity | Rectangle or Square | Source or destination of data outside the system boundary. | Customer, Admin, Third-Party API |
| Process | Circle or Rounded Rectangle | Transforms input data into output data. | Calculate Tax, Validate User, Generate Report |
| Data Store | Open-ended Rectangle or Parallel Lines | Where data is saved for later retrieval. | Database, File System, Email Inbox |
| Data Flow | Arrow | The path along which data moves between components. | Order Details, Login Credentials, Invoice |
1. External Entities 🧑💼
Also known as terminators, these represent people, organizations, or other systems that interact with your system but exist outside of its control. They are the starting points or ending points of data flows. It is crucial to define the system boundary clearly to determine what constitutes an external entity versus an internal process.
2. Processes ⚙️
Processes are the active elements where work happens. They take data in, transform it, and send it out. A process must always have at least one input and one output. If a process has input but no output, it is a “black hole.” If it has output but no input, it is a “miracle.” Both are errors in logic.
3. Data Stores 🗃️
Data stores represent passive repositories where information rests. They do not process data; they hold it. This could be a physical database, a paper filing cabinet, or a cloud bucket. In a DFD, data flows into a store to be saved and flows out to be retrieved.
4. Data Flows ➡️
Data flows are the connectors. They represent the movement of information. Every flow must be labeled with a noun phrase indicating what is moving (e.g., “Payment Info”), not a verb (e.g., “Send Payment”). Flows cannot cross system boundaries without a process or store in between.
DFD Levels Explained 📈
DFDs are structured hierarchically. This allows you to manage complexity by breaking the system down into layers of abstraction.
Level 0: The Context Diagram
The Context Diagram is the highest-level view. It shows the entire system as a single process bubble. It identifies all external entities and the major data flows entering and leaving the system. This diagram answers the question: “What does the system do?” It establishes the system boundary clearly.
Level 1: Major Processes
Level 1 expands the single process from the Context Diagram into its major sub-processes. This level reveals the main functional areas of the system. For example, a “Sales System” might break down into “Order Processing,” “Inventory Management,” and “Billing.” The data stores are also introduced here.
Level 2: Detailed Processes
Level 2 provides a deeper look into specific processes from Level 1. This is where you map out the granular steps. For instance, the “Billing” process from Level 1 might be broken down into “Calculate Charges,” “Apply Discounts,” and “Generate Invoice.” This level is often the most detailed and is used for implementation guidance.
Notation Styles 📐
There are two primary notations used to draw DFDs. Both convey the same logical information but use different shapes.
- Yourdon and DeMarco Notation: Uses circles for processes and open-ended rectangles for data stores. This style is often associated with older methodologies but remains widely recognized.
- Gane and Sarson Notation: Uses rounded rectangles for processes and parallel horizontal lines for data stores. This style is often preferred in modern system design for its clarity.
When creating diagrams, consistency is key. Choose one notation and stick to it throughout the entire documentation set to avoid confusion among stakeholders.
Essential Rules & Constraints ⚖️
To ensure the integrity of your Data Flow Diagram, you must adhere to specific rules. Violating these rules renders the diagram logically invalid.
- Data Balance: Every process must have at least one input flow and one output flow. Data cannot be created from nothing or destroyed without trace.
- No Direct Entity-to-Store Flow: Data cannot flow directly from an external entity to a data store. It must pass through a process first. This ensures that all data is validated or transformed before being saved.
- No Direct Store-to-Store Flow: Data cannot move directly from one store to another. A process must mediate the transfer to ensure data integrity.
- Consistent Naming: Data flows must have unique, descriptive names. If the same data moves in multiple places, it should carry the same name to maintain traceability.
- Decomposition: When breaking a process down into lower levels, the inputs and outputs must match the parent process. This is known as “balancing.”
Common Pitfalls to Avoid ⚠️
Even experienced analysts can make mistakes when modeling data flows. Being aware of common errors helps maintain diagram quality.
1. Black Holes
A black hole is a process that receives data but produces no output. This implies data is disappearing into the system with no result. In a valid DFD, this is impossible. Every piece of data entering a process must result in some change or output.
2. Gray Holes
A gray hole is a process where the input data does not match the output data logically. For example, if the input is “Customer Name” but the output is “Shipping Address,” there is a missing transformation process. The data required to create the output must be accounted for.
3. Too Many Flows
Overloading a single process with too many data flows makes the diagram unreadable. If a process has more than seven inputs or outputs, it is likely doing too much and should be decomposed into smaller sub-processes.
4. Control Flow Confusion
DFDs do not show control flow, time sequences, or loops. Do not use arrows to indicate “start here” or “then do this.” All arrows represent data movement. If you need to show logic or timing, use a flowchart instead.
DFD vs Flowchart 🔄
It is common to confuse Data Flow Diagrams with Flowcharts. While both use arrows and shapes, they serve different purposes.
| Feature | Data Flow Diagram (DFD) | Flowchart |
|---|---|---|
| Focus | Data movement and storage. | Control flow and decision logic. |
| Processes | Transform data. | Execute steps or decisions. |
| Time | Does not show sequence. | Shows order of operations. |
| Decision Points | Not used. | Used heavily (Diamond shapes). |
| Best For | System analysis and requirements. | Algorithm design and programming logic. |
Step-by-Step Creation Process 🛠️
Creating a DFD requires a structured approach. Follow these steps to build a robust model.
- Identify the System Boundary: Define what is inside the system and what is outside. This determines your external entities.
- Draw the Context Diagram: Place the system as one process in the center. Draw arrows to all external entities showing high-level data movement.
- Identify Major Processes: Decompose the central process into Level 1 processes. These are the main functions of the system.
- Add Data Stores: Determine where data needs to be saved between processes. Connect them to the relevant processes.
- Refine Data Flows: Draw arrows between processes, stores, and entities. Ensure all labels are clear nouns.
- Check for Balancing: Verify that the inputs and outputs of Level 1 processes match the Context Diagram.
- Decompose Further: If a Level 1 process is too complex, create a Level 2 diagram to detail its internal workings.
Benefits for System Architecture 🏗️
Implementing DFDs offers tangible advantages for system architecture and development teams.
- Clarity: Visual models reduce ambiguity in requirements. Stakeholders can see exactly what data they are sending and receiving.
- Scalability: Hierarchical diagrams allow architects to scale the system design without overwhelming the team with detail.
- Integration: DFDs make it easier to identify how different subsystems interact, which is vital for microservices or distributed systems.
- Security: By mapping data flows, security teams can identify where sensitive data travels and apply encryption or access controls at the right points.
Maintenance and Iteration 🔁
A DFD is not a one-time artifact. Systems evolve, and data requirements change. Keeping the diagram up to date is crucial.
- Version Control: Treat diagrams as code. Use versioning to track changes over time.
- Change Management: When a new requirement is added, update the DFD immediately to reflect the new data paths.
- Review Cycles: Schedule regular reviews with stakeholders to ensure the diagram still matches the business reality.
- Retirement: When a process is removed, ensure all associated data flows are also removed to prevent orphaned data references.
Best Practices for Clarity ✨
To ensure your Data Flow Diagrams are effective, follow these guidelines.
- Use Descriptive Labels: Name processes with a verb and a noun (e.g., “Process Order”). Name data flows with a noun (e.g., “Order Details”).
- Avoid Crossing Lines: Arrange elements to minimize arrow crossings. If they cross, use a “jump” symbol or rearrange the layout.
- Keep it Simple: Aim for a maximum of seven items per process. If you exceed this, split the process.
- Consistent Orientation: Keep external entities on the left and right, and data stores at the bottom or top for consistency.
- Review with Users: Show the diagram to the actual users of the system. They can often spot missing data flows that technical analysts overlook.
Final Considerations 🔍
Data Flow Diagrams remain a cornerstone of structured analysis. They provide a neutral way to discuss system requirements without getting bogged down in technical implementation details. By focusing on data movement, teams can identify inefficiencies and logical gaps early in the design phase.
Remember that a diagram is a tool for thinking, not just documentation. The act of drawing the flows often reveals problems that were previously hidden in text descriptions. Whether you are working in an agile environment or a traditional waterfall model, the discipline of mapping data flows ensures a robust and maintainable system architecture.
By adhering to the rules, avoiding common pitfalls, and maintaining the diagrams as the system evolves, you ensure that your documentation remains a reliable source of truth throughout the lifecycle of the software.