Now Reading: Comprehensive Guide to AI-Powered Chart Generation with Visual Paradigm Online
-
01
Comprehensive Guide to AI-Powered Chart Generation with Visual Paradigm Online
Comprehensive Guide to AI-Powered Chart Generation with Visual Paradigm Online
Introduction
AI-powered chart generation leverages artificial intelligence to automatically analyze your data and recommend or create the most suitable visualizations. This technology streamlines the process of turning raw data into clear, compelling charts, making data visualization more accessible and efficient. This guide will walk you through the process of using Visual Paradigm Online to generate AI-powered charts.

How AI-Powered Chart Generation Works
-
Data Analysis:
- The AI examines the structure and type of your data to understand key patterns, relationships, and metrics.
-
Chart Recommendation:
- Based on the analysis, the AI suggests appropriate chart types (e.g., bar, line, pie, scatter) that best represent the data story.
-
Automatic Creation:
- The AI generates an initial chart design quickly, saving time compared to manual chart creation.
-
Customization:
- Users can then refine the chart by adjusting colors, labels, titles, and other design elements to fit their specific needs and audience.
Benefits of AI-Powered Chart Generation

- Saves Time: Automates the selection and creation process, enabling users to produce professional charts in seconds.
- Improves Clarity: Helps avoid guesswork by recommending the most effective visualization for the data.
- Accessible: Makes data visualization more approachable for users without advanced technical or design skills.
- Versatile: Suitable for various fields such as business analytics, education, healthcare, and marketing.
Getting Started with Visual Paradigm Online
-
Import Your Data:
- Upload or input your dataset into Visual Paradigm Online. The platform supports various data formats, making it easy to import your data.
-
Generate Suggestions:
- Use the AI feature to receive chart type recommendations based on your data. Visual Paradigm Online will analyze your data and suggest the most suitable chart types.
-
Customize and Edit:
- Adjust the chart’s design elements to match your presentation style or branding. Visual Paradigm Online offers a range of customization options, including colors, labels, titles, and more.
-
Export and Share:
- Download or embed the chart for reports, presentations, or online sharing. Visual Paradigm Online allows you to export your charts in various formats, making it easy to share your visualizations.
Step-by-Step Guide to Using Visual Paradigm Online
-
Access Visual Paradigm Online:
- Go to the Visual Paradigm Online website and log in to your account. If you don’t have an account, you can sign up for free.
-
Import Your Data:
- Click on the “Import Data” button and select the file containing your dataset. Visual Paradigm Online supports various file formats, including CSV, Excel, and more.
-
Generate Chart Suggestions:
- Once your data is imported, click on the “AI Chart Generator” button. The AI will analyze your data and suggest the most suitable chart types.
-
Select a Chart Type:
- Review the chart type recommendations and select the one that best represents your data story. Visual Paradigm Online provides a preview of each chart type to help you make an informed decision.
-
Customize Your Chart:
- Use the customization options to adjust the chart’s design elements. You can change colors, labels, titles, and more to match your presentation style or branding.
-
Export and Share:
- Once you are satisfied with your chart, click on the “Export” button to download your chart in the desired format. You can also embed the chart in reports, presentations, or online platforms.
Tips for Effective Chart Customization
- Color Scheme: Choose a color scheme that is visually appealing and easy to read. Avoid using too many colors, as this can make the chart difficult to interpret.
- Labels and Titles: Ensure that labels and titles are clear and concise. Use descriptive titles to help viewers understand the chart’s purpose.
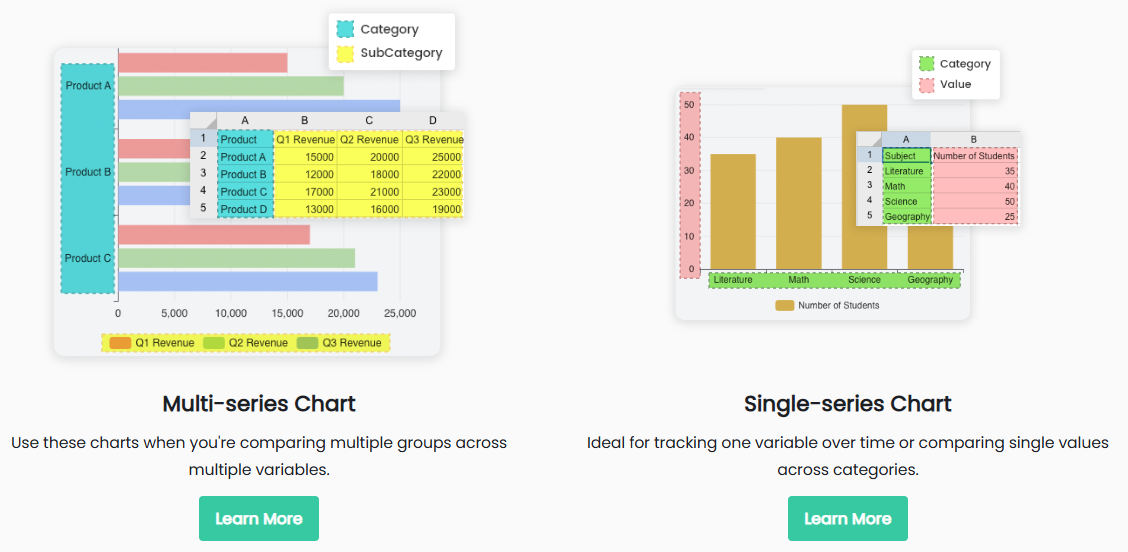
- Data Representation: Use appropriate chart types to represent your data accurately. For example, use bar charts for comparing categories and line charts for showing trends over time.
- Consistency: Maintain consistency in your chart design. Use the same color scheme, font, and style throughout your presentation to create a cohesive look.
Conclusion
AI-powered chart generation with Visual Paradigm Online makes it easier than ever to create professional, compelling charts. By leveraging AI technology, you can save time, improve clarity, and make data visualization more accessible. Follow this comprehensive guide to get started with Visual Paradigm Online and unlock the full potential of AI-powered chart generation.


