💡 Key Takeaways
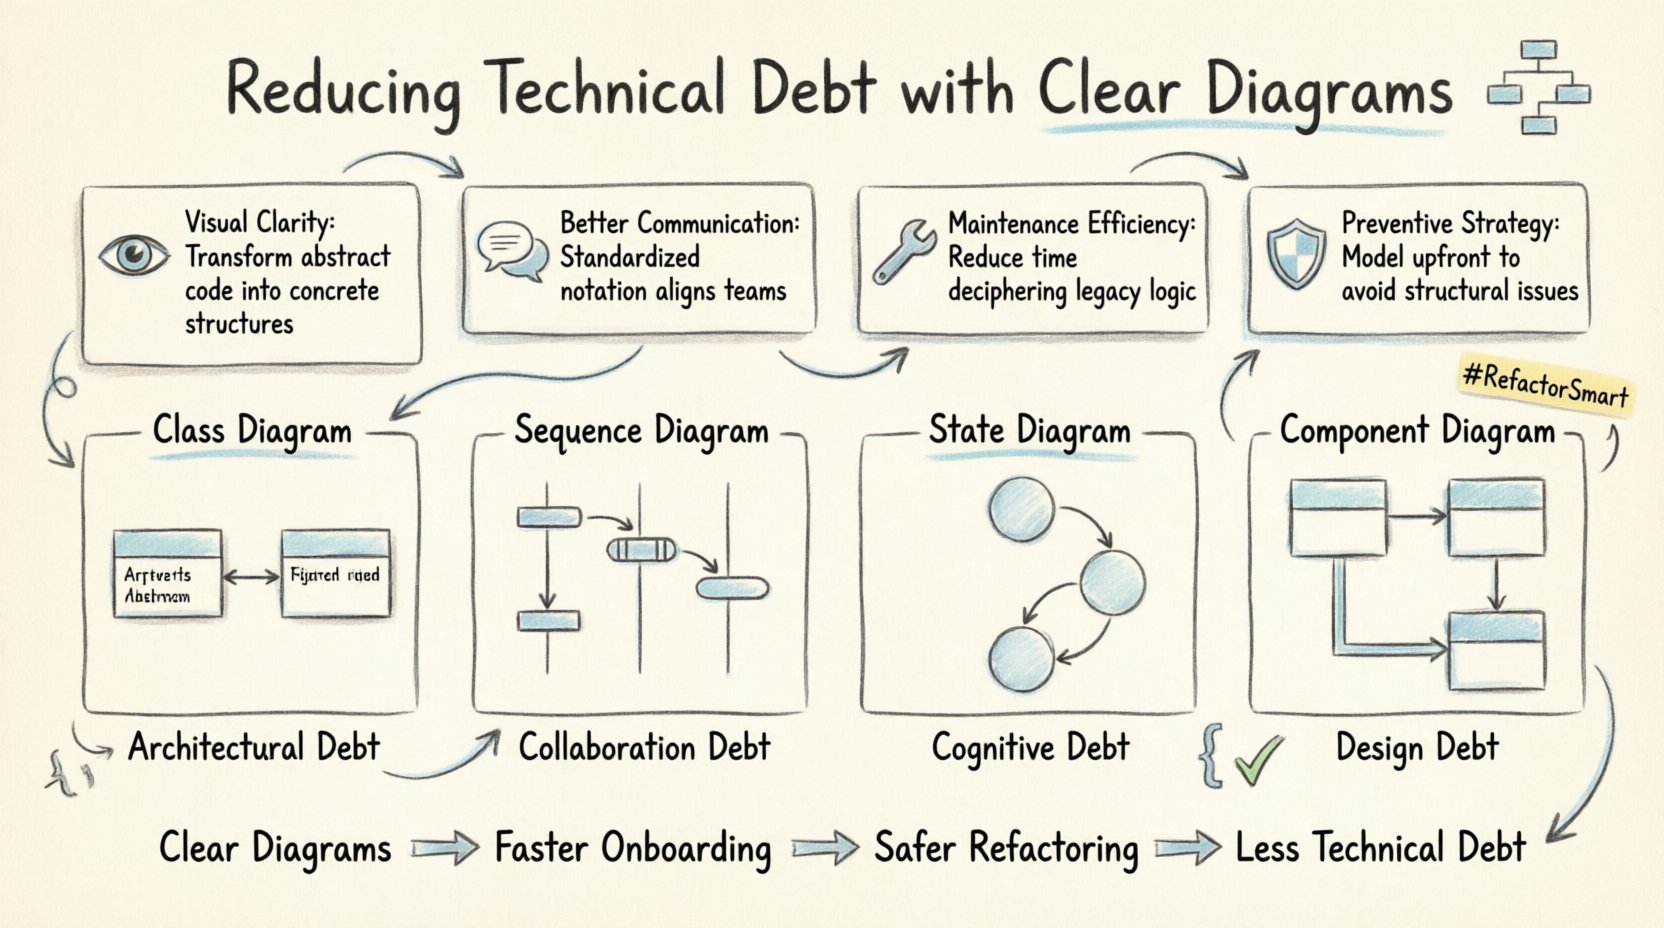
- Visual Clarity: Diagrams transform abstract code into concrete structures, making hidden complexities visible before they become problems.
- Better Communication: Standardized notation ensures developers, stakeholders, and architects share the same understanding of system behavior.
- Maintenance Efficiency: Clear documentation reduces the time spent deciphering legacy logic during refactoring or bug fixes.
- Preventive Strategy: Modeling upfront prevents structural issues that often accumulate as technical debt over time.
Technical debt accumulates when short-term coding decisions compromise long-term maintainability. It is not merely a financial concept but a structural one. In complex software systems, the accumulation of hidden dependencies, undocumented logic, and inconsistent patterns creates a fragile foundation. One of the most effective ways to mitigate this is through the use of clear, standardized visual modeling, specifically the Unified Modeling Language (UML). These diagrams serve as a blueprint, translating abstract logic into a format that is accessible to human cognition.
When teams rely solely on code, the intent of the architecture often becomes obscured by implementation details. Diagrams bridge this gap. They allow architects and developers to reason about the system as a whole rather than focusing on isolated functions. By establishing a visual contract for how components interact, organizations can identify potential issues before writing a single line of code. This proactive approach reduces the cost of fixing errors, which increases exponentially as the system matures.
Understanding the Cost of Invisible Complexity 📉
Technical debt often grows silently. It is not always a matter of writing poor code; it is often a result of misalignment between the written code and the intended design. Without visual aids, understanding the flow of data or the relationship between modules requires reading through multiple files and tracing execution paths manually. This process is error-prone and time-consuming.
When a developer joins a project, they must learn the system’s architecture. If that architecture exists only in the minds of previous team members or in scattered code comments, the learning curve is steep. This delay in productivity is a form of debt. Clear diagrams reduce this friction. They act as a single source of truth that can be referenced during onboarding, code reviews, and planning sessions.
Consider the scenario where a system requires a significant change. Without a diagram, the developer must analyze the codebase to find all affected components. This is risky; a missed dependency can cause a failure in production. With a well-maintained diagram, the impact analysis becomes a visual inspection. The developer can see connections clearly, ensuring that changes are implemented safely.
The Role of UML in Structural Integrity 📐
UML provides a standardized set of notations that describe the static and dynamic aspects of a system. It is not about drawing pictures for the sake of it; it is about creating precise specifications. Using UML helps teams enforce consistency and clarity.
Class Diagrams and Architecture Debt
Class diagrams describe the structure of the system. They show classes, attributes, operations, and relationships. When these diagrams are up to date, they reveal architectural issues such as tight coupling or circular dependencies. These are common sources of technical debt. If the diagram shows that Module A depends heavily on Module B, but Module B is unstable, the team knows to refactor the relationship before the instability causes a cascade of failures.
Refactoring without a diagram is like renovating a house without a floor plan. You might fix a wall, but you could accidentally compromise the foundation. Class diagrams provide the map needed to navigate structural changes safely.
Sequence Diagrams and Logic Debt
Logic debt occurs when the flow of execution becomes convoluted. Sequence diagrams illustrate how objects interact over time. They show the order of messages passed between components. This is crucial for understanding complex business logic. When a sequence diagram is created, it forces the developer to think about the lifecycle of data and the timing of operations.
Often, logic debt manifests as spaghetti code where the control flow is difficult to follow. A sequence diagram breaks this down into linear steps. It highlights unnecessary complexity, such as redundant checks or inefficient data transfers. By visualizing the flow, teams can simplify the logic, reducing the cognitive load required to maintain the code.
Communication as a Debt Reduction Strategy 🗣️
A significant portion of technical debt stems from miscommunication. Developers, stakeholders, and designers often have different mental models of the system. This disconnect leads to features that do not meet expectations or implementations that are technically flawed.
Diagrams facilitate a common language. When a diagram is used during a meeting, everyone looks at the same representation. Ambiguity is reduced. Questions can be answered by pointing to a specific part of the diagram. This clarity prevents the rework that occurs when assumptions are not validated early in the process.
Furthermore, diagrams serve as documentation. Code comments become outdated quickly. A diagram that is reviewed alongside code changes remains relevant longer. This ensures that knowledge is not lost when team members leave. The institutional memory of the system is preserved in the visual artifacts.
Table: Diagram Types and Debt Reduction
| Diagram Type | Focus Area | Debt Type Addressed |
|---|---|---|
| Class Diagram | Structure & Relationships | Structural Complexity |
| Sequence Diagram | Interaction & Flow | Logic Complexity |
| State Diagram | Lifecycle & States | Consistency Issues |
| Component Diagram | Deployment & Modules | Integration Debt |
Maintaining Diagrams for Long-Term Value 🔄
Diagrams can become a burden if they are not maintained. If a diagram diverges from the code, it creates confusion rather than clarity. This is known as “diagram debt.” To avoid this, diagrams should be treated as living documents.
The best practice is to keep diagrams synchronized with the codebase. This can be achieved through round-trip engineering tools or by integrating diagram updates into the code review process. When a developer submits a change that affects the architecture, they should also update the relevant diagram. This ensures that the documentation remains accurate.
Automating the generation of diagrams from code can help, but it should not replace manual review. Automated diagrams often lack context and business logic. They show the structure, but not the intent. A hybrid approach, where diagrams are manually drafted for design and then synchronized for reference, is often the most effective.
Impact on Maintenance and Refactoring 🛠️
Maintenance is where technical debt is most felt. As the system ages, changes become more difficult. Teams spend more time understanding the code than writing new features. Clear diagrams accelerate this understanding.
During refactoring, the goal is to improve the internal structure without changing the external behavior. Diagrams provide a safety net. They allow the team to verify that the refactored code still matches the intended design. If a refactoring effort introduces a new dependency that was not in the diagram, the team can catch it immediately.
Moreover, diagrams help in identifying areas that are candidates for refactoring. If a component diagram shows a module with too many connections, it is a signal to break it down. This proactive identification prevents the accumulation of further debt.
Building a Culture of Clarity 🌱
Adopting diagramming is not just a technical decision; it is a cultural one. It requires discipline and commitment from the team. It means taking the time to visualize before building. It means updating documents when code changes.
Leadership plays a key role here. If management values speed over clarity, teams may skip documentation. However, the long-term cost of skipping documentation is higher. Investing in clear diagrams reduces the time spent on debugging and maintenance. It allows the team to move faster in the long run by building a stable foundation.
Training is also essential. Not every developer is familiar with UML notation. Providing resources and time to learn these skills ensures that diagrams are used correctly. When everyone speaks the same visual language, collaboration becomes smoother.
Conclusion: A Sustainable Approach 🏁
Reducing technical debt is an ongoing process. It requires vigilance and the right tools. UML diagrams are one of the most powerful tools available for this purpose. They bring order to chaos, clarity to complexity, and consistency to collaboration. By visualizing the system, teams can make better decisions, avoid common pitfalls, and maintain a healthy codebase over time.
The investment in creating and maintaining diagrams pays dividends in reduced maintenance costs and improved system reliability. It transforms technical debt from a hidden burden into a manageable aspect of the development lifecycle. With clear diagrams, the path forward is visible, and the journey to a robust system becomes much smoother.