


Data Flow Diagrams (DFDs) remain a cornerstone of system analysis and design. While often introduced in introductory courses, their application in complex software engineering environments requires a nuanced approach. This guide explores advanced techniques for constructing, analyzing, and maintaining data flow diagrams. We move beyond basic box-and-arrow representations to address concurrency, data integrity, and architectural alignment. Whether you are refactoring legacy systems or designing new microservice architectures, mastering these diagrams ensures clarity in communication and precision in implementation.
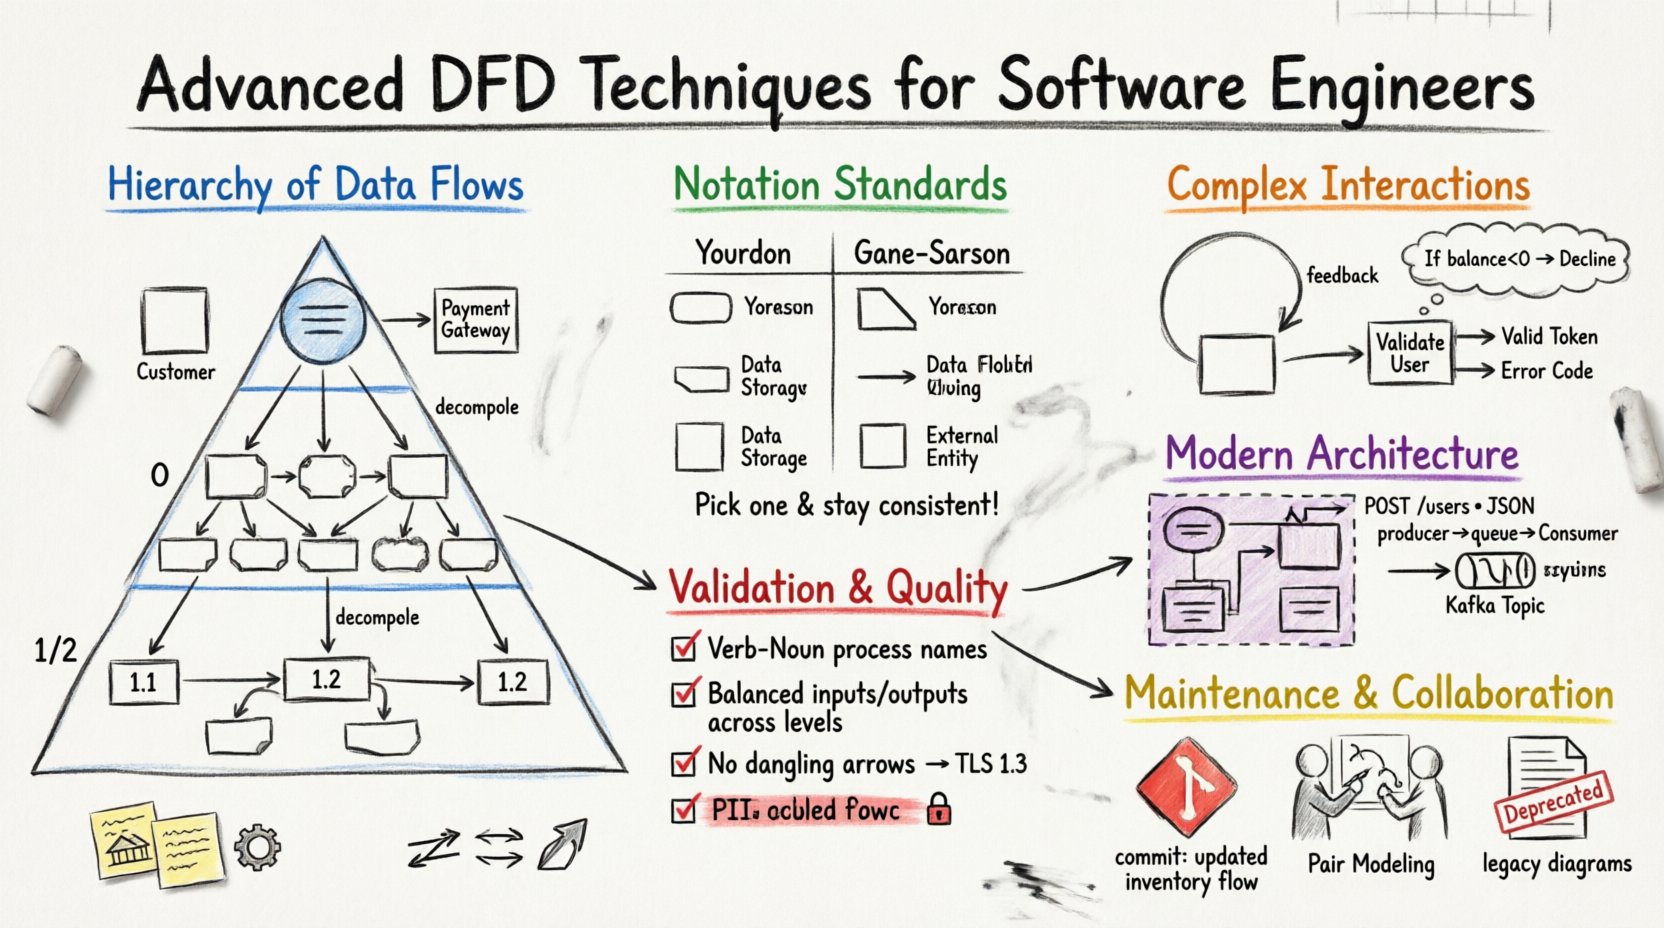
🏗️ Understanding the Hierarchy of Data Flows
A robust DFD strategy relies on a layered approach. Visualizing a system at a single level often obscures critical dependencies. By decomposing the system into specific levels, engineers can manage complexity and maintain focus on relevant details.
🌐 Context Diagrams: The Macro View
The context diagram serves as the boundary definition for the system. It represents the software as a single process and identifies all external entities interacting with it. This level is crucial for defining the scope of a project.
- External Entities: These are users, other systems, or hardware devices outside the boundary. Examples include a Customer, a Payment Gateway, or a Legacy Database.
- Data Flows: Arrows indicate the movement of information into or out of the system. Labels must specify the content, such as “Order Request” or “Invoice Data”.
- Single Process: The system itself is depicted as one rounded rectangle, often labeled with the system name.
When creating a context diagram, avoid including internal processes. The goal is to establish the interface contract. If an entity sends data but never receives it, verify if that flow is necessary. Similarly, ensure all required inputs from external sources are captured.
📉 Level 0: The System Overview
Also known as the “Top-Level” or “Parent” diagram, Level 0 expands the single process from the context diagram into major subsystems or functional areas. This level provides a high-level map of the system’s capabilities without detailing internal logic.
Key characteristics of Level 0 include:
- Major Processes: Typically 5 to 9 processes. Too many indicates a need for higher-level grouping; too few suggests missing functionality.
- Data Stores: Identify where persistent data is held. This level shows *that* data is stored, not necessarily how it is structured.
- Flow Consistency: Every input and output from the context diagram must appear here. This ensures the decomposition has not altered the system’s external contract.
🧩 Level 1 and 2: Decomposition Strategies
As you drill down into Level 1 and Level 2, the focus shifts to specific functions and data manipulation. This is where the logic of the engineering work is documented.
- Decomposition: Break down Level 0 processes into sub-processes. For example, “Process Order” might become “Validate Inventory”, “Charge Payment”, and “Generate Receipt”.
- Detailing: Each process should be numbered (e.g., 1.0, 1.1, 1.2) to track relationships across diagrams.
- Data Store Access: Clearly mark which processes read from or write to which data stores. Avoid direct connections between external entities and data stores; all access must go through a process.
When decomposing, ensure that data flows are not lost. A common error is omitting a data flow in a child diagram that existed in the parent. This is known as a “balancing” violation.
🔣 Notation Standards and Symbol Semantics
Choosing the right notation system ensures that diagrams are universally understood by the development team. While standards vary, two primary schools of thought dominate the industry.
| Feature | Your-Donnell Notation | Gane-Sarson Notation |
|---|---|---|
| Processes | Rounded Rectangles | Rectangles with cut corners |
| Data Stores | Open-ended rectangles | Open-ended rectangles |
| External Entities | Squares | Squares |
| Data Flows | Lines with arrows | Lines with arrows |
| Labels | Noun Phrases | Noun Phrases |
Consistency is paramount. Mixing notations within the same documentation suite creates confusion. Select one standard and adhere to it across all diagrams. The choice often depends on the engineering culture or existing documentation templates.
⚙️ Managing Complex Data Interactions
Real-world systems are rarely linear. They involve loops, branching logic, and asynchronous events. Representing these dynamics in a static diagram requires specific techniques.
🔄 Handling Loops and Iterations
DFDs are not flowcharts; they do not explicitly show control flow (if-then-else). However, data loops are common. For example, a “Calculate Tax” process might send data to a “Rate Lookup” store and receive the result back.
- Feedback Loops: Use arrows that return to a process to indicate re-evaluation. Label these clearly to show what data is being updated.
- Iterative Processes: If a process repeats until a condition is met, denote the condition in the process description or text annotation. Avoid drawing the loop as a control flow line.
- Data Updates: Show the data flow returning to the data store to indicate an update operation.
🧭 Representing Decision Points
Decision logic belongs in the process description, not the diagram itself. A process named “Validate User” implies internal logic. Do not split the process into “Validate” and “Deny”. Keep the process atomic.
- Output Differentiation: If a process sends different data based on an internal decision, use distinct data flow labels (e.g., “Valid Token” vs. “Error Code”).
- Annotations: Use text boxes to clarify decision criteria. For example, “If balance < 0, flow 'Decline'".
- Atomicity: Ensure each process performs one logical function. If it handles multiple distinct decisions, consider splitting it into separate processes.
🔗 Integrating DFDs with Modern Architectures
Software engineering has evolved. The shift towards distributed systems, cloud computing, and API-driven designs changes how we view data flows. DFDs must adapt to reflect these realities without becoming obsolete.
☁️ Microservices and API Endpoints
In a monolithic architecture, a process might represent a module. In a microservices environment, a process often represents a service instance. The data flow becomes an API call.
- Service Boundaries: Draw a box around a set of processes that constitute a single microservice. Data flows crossing this boundary are network requests.
- API Contracts: Label data flows with the specific API endpoint or payload structure (e.g., “POST /users”, “JSON Payload”).
- Statelessness: If a service is stateless, do not show a data store inside the service boundary unless it is for temporary caching. Persistent storage should be external.
📨 Asynchronous Messaging and Queues
Not all data flows happen in real-time. Background jobs and event-driven architectures rely on queues.
- Queues as Data Stores: Represent message queues (e.g., RabbitMQ, Kafka topics) using the data store symbol. This clarifies that data is persisted temporarily.
- Producer/Consumer: Show the producer process writing to the queue and the consumer process reading from it. The flow is decoupled.
- Latency Implications: Note in annotations that data is not immediately available after writing. This is critical for understanding system behavior during failure scenarios.
🛡️ Validation and Consistency Checks
A diagram is only useful if it accurately reflects the system. Validation ensures the model is mathematically and logically sound. Engineers should perform these checks before finalizing documentation.
⚖️ Data Balance Verification
Every data flow entering a diagram must be accounted for. This is the principle of conservation of data.
- Input/Output Matching: Ensure every input from the parent diagram appears in the child diagram. No input can disappear.
- Output Completeness: All outputs defined at the higher level must be present at the lower level. If a child process generates a new output, it must be justified as a new requirement or an internal side-effect.
- Store Consistency: Data stores must be consistent across levels. If a store is created in Level 1, it must exist in Level 0.
🏷️ Naming Conventions
Clarity in naming prevents ambiguity. Poor labels are the most common source of misinterpretation in technical documentation.
- Verb-Noun Format: Processes should be named with a verb and a noun (e.g., “Calculate Tax”, “Update Profile”). Avoid nouns only (e.g., “Tax”) or verb phrases without objects (e.g., “Calculating”).
- Data Flow Labels: Use specific nouns (e.g., “Invoice ID”, “User Session”). Avoid vague terms like “Data” or “Info”.
- Entity Names: External entities should be consistent. “Customer” should not switch to “Client” or “User” within the same diagram set.
🔄 Maintenance and Documentation Lifecycle
DFDs are not static artifacts. They must evolve as the software changes. A diagram that is outdated is worse than no diagram, as it creates a false sense of understanding.
📦 Version Control for Diagrams
Treat diagrams as code. Store them in a version control system alongside the source code repository.
- Commit Messages: Document changes in diagram commits. “Added payment gateway process”, “Updated inventory flow”.
- Visual Diffing: Use tools that allow visual comparison of diagrams to spot unintended structural changes.
- Linkage: Link diagrams to the specific pull requests or tickets that caused the change. This provides traceability.
🤝 Collaboration Strategies
Documentation is a team effort. Relying on a single architect to maintain DFDs leads to bottlenecks and stale information.
- Pair Modeling: Have two engineers draw a diagram together during the design phase. This catches errors early.
- Review Cycles: Include DFD reviews in the standard code review process. If the code changes, the diagram should be updated or noted as out of sync.
- Living Documents: Avoid archiving old diagrams. Instead, mark them as “Deprecated” or “Legacy” within the repository. This preserves history without cluttering the current view.
🧠 Advanced Implementation Considerations
Beyond the visual representation, the underlying data structures and logic dictate the flow. Engineers must consider the physical constraints of the data.
📏 Data Volume and Throughput
DFDs describe logical flow, not performance. However, high-volume flows impact design.
- Bulk Data Flows: If a flow involves large files or logs, indicate this with a label. This might trigger a decision to use a different transport mechanism.
- Compression: Note if data is compressed before transmission. This affects the processing load on the receiving end.
- Encoding: Specify character encodings if the flow crosses platform boundaries (e.g., UTF-8 vs. ASCII).
🔒 Security and Access Control
Security is not an afterthought. It must be visible in the data flow.
- Encryption: Mark flows that require encryption. Use a label like “Encrypted Stream” or “TLS 1.3”.
- PII Handling: Highlight flows containing Personally Identifiable Information. This ensures compliance requirements are met in the design.
- Authentication: Show where credentials are passed. Avoid showing passwords in plain text flows; label as “Auth Token”.
📝 Checklist for Diagram Quality
Before finalizing a set of data flow diagrams, run through this validation checklist.
- Are all external entities clearly defined?
- Do all data flows have descriptive labels?
- Is every process named with a Verb-Noun structure?
- Are there any crossed lines that can be rerouted for clarity?
- Does every input in the parent diagram appear in the child diagram?
- Are data stores properly separated from processes?
- Is the diagram balanced with the context diagram?
- Are there any dangling arrows (flows with no destination)?
- Is the notation consistent throughout the document set?
- Have security constraints been noted on sensitive flows?
By adhering to these advanced techniques, software engineers can produce documentation that serves as a reliable blueprint for development. DFDs bridge the gap between abstract requirements and concrete implementation. They facilitate communication between stakeholders, reduce ambiguity in logic, and provide a baseline for testing. When maintained with discipline and updated rigorously, they remain a powerful tool in the engineering arsenal.
🚀 Final Thoughts on System Modeling
The value of a Data Flow Diagram lies in its ability to simplify complexity. It strips away the noise of syntax and implementation details to focus on the movement of value. For software engineers, this focus is essential. It allows for early detection of design flaws, clearer onboarding for new team members, and a shared mental model of the system architecture. Commit to the process of modeling. It requires effort, but the return on investment in system clarity is substantial.
Remember that the diagram is a means to an end. It supports the code, not the other way around. Keep the diagrams lean, accurate, and accessible. As the system evolves, let the diagrams evolve with it. This dynamic approach ensures that documentation remains a living asset rather than a static burden.