


A Data Flow Diagram (DFD) serves as a fundamental tool in systems analysis and design. It provides a visual representation of how information moves through a system. Unlike flowcharts, which focus on control flow and logic, a DFD emphasizes the transformation of data. This guide details the core components, notation styles, and structural rules required to construct accurate diagrams.
Understanding the Purpose of a DFD 🎯
Before selecting symbols or drawing flows, it is essential to understand the objective of the diagram. A DFD answers specific questions regarding data movement:
- Where does the data originate?
- How is the data transformed?
- Where does the data end up?
- What data is stored for future use?
These diagrams act as a bridge between technical requirements and business needs. They allow stakeholders to verify that the system will handle information correctly without needing to understand the underlying code. By visualizing the system as a series of processes and flows, analysts can identify bottlenecks, missing data, or redundant steps early in the development lifecycle.
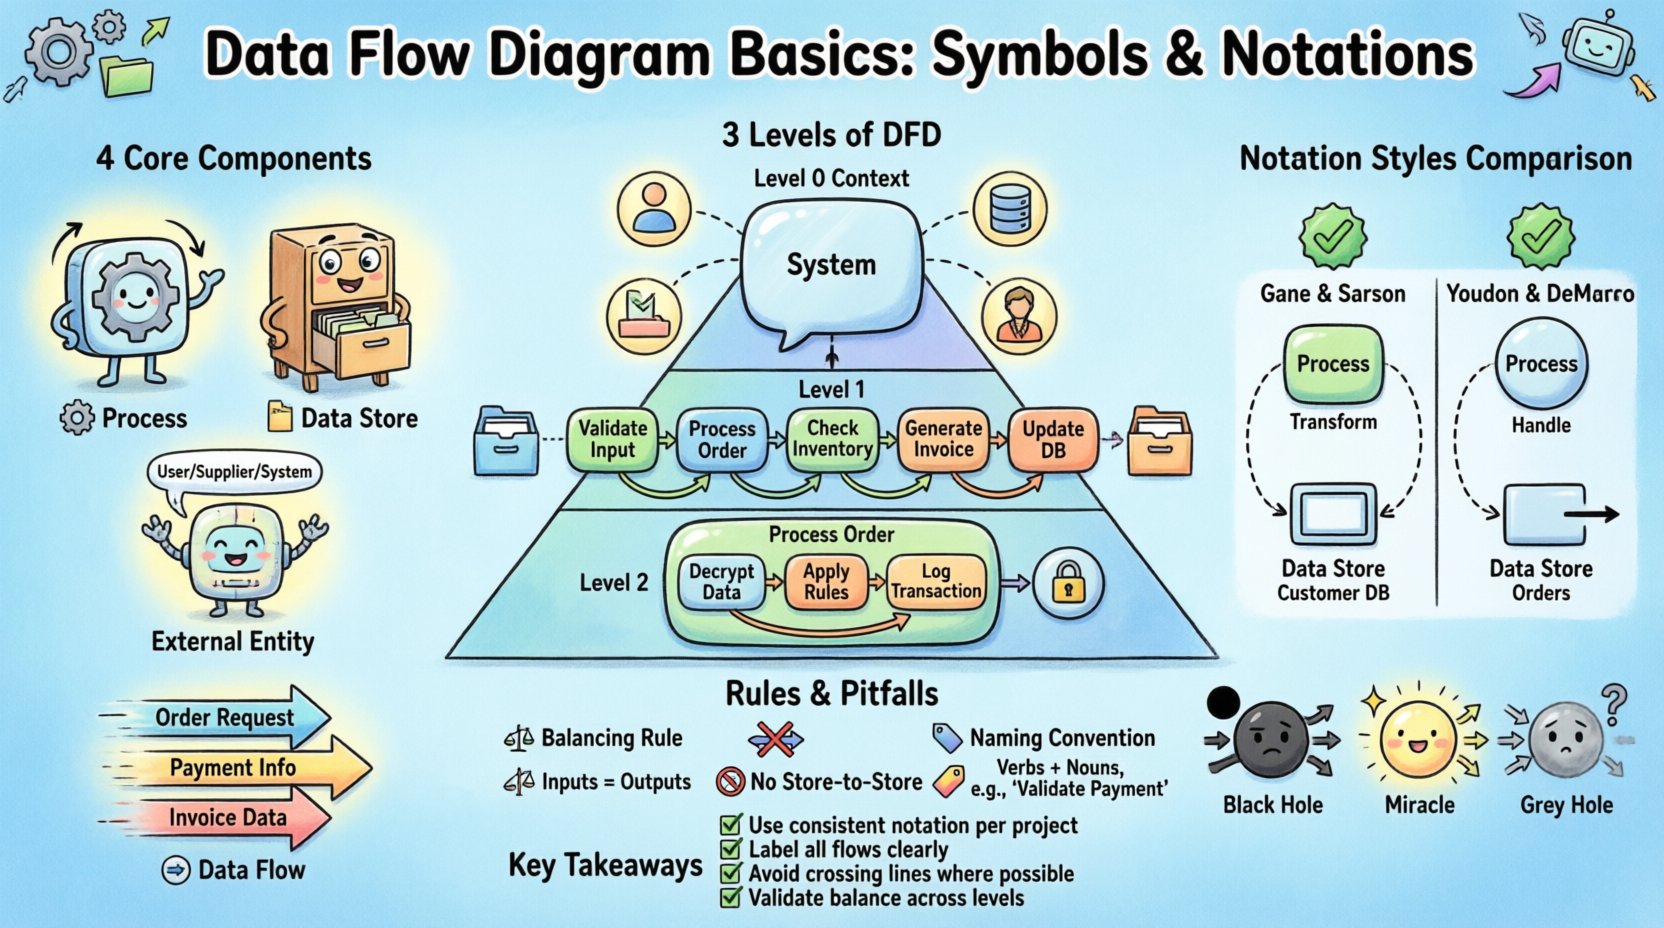
The Four Core Components of DFD 🧩
Every Data Flow Diagram relies on four distinct elements. These symbols define the behavior and relationships within the system. Mastery of these components ensures the diagram remains consistent and interpretable by all team members.
1. Process (Transformation) ⚙️
A process represents an action or function that changes data. It takes input data, performs a calculation or transformation, and produces output data. In a DFD, processes are not the actual code but the logical function being performed.
- Function: Converts inputs into outputs.
- Identifier: Each process must have a unique name and number.
- Verb-Noun: Names typically follow a verb-noun structure (e.g., Calculate Tax, Validate User).
- Decomposition: Complex processes can be broken down into sub-processes in lower-level diagrams.
2. Data Store (Repository) 📂
A data store represents a place where data rests at rest. It holds information that is not currently being processed but is needed later. This could be a database table, a file, or a physical filing cabinet.
- Persistence: Data remains in the store between system sessions.
- Access: Processes must read from or write to a store.
- Direction: Data stores do not create data; they only hold it.
- Naming: Names should be plural nouns (e.g., Orders, Customers).
3. External Entity (Source/Sink) 🌐
An external entity is a person, organization, or system outside the boundary of the current system. It acts as the source of data (input) or the destination of data (output).
- Boundary: Anything outside the scope of the diagram is an external entity.
- Role: Can be a human user, a third-party API, a government agency, or a hardware device.
- Interaction: Data flows between the system and the entity.
4. Data Flow (Movement) ➡️
Data flow represents the movement of information between components. It is the connection that binds the diagram together. Arrows indicate the direction of data.
- Labeling: Every arrow must be labeled with the name of the data packet.
- Atomicity: A single data flow should carry one logical piece of information.
- Direction: Flow is unidirectional in a standard DFD.
- Logic: Data must flow through a process; it cannot flow directly between data stores.
Levels of Data Flow Diagrams 📉
DFDs are hierarchical. A single system is too complex to show in one view. Therefore, diagrams are broken down into levels of detail. This approach allows analysts to manage complexity while maintaining the integrity of the overall system.
Level 0: Context Diagram 🌍
The context diagram provides the highest-level view of the system. It defines the system boundary and shows how the system interacts with external entities.
- Single Process: The entire system is represented as one single process.
- Inputs/Outputs: Shows major data entering and leaving the system.
- Scope: Establishes the boundaries for the project.
Level 1: Major Processes 🔍
Level 1 decomposes the single process from the context diagram into major sub-processes. It shows the primary functions that make up the system.
- Expansion: The main process is split into 3 to 7 major processes.
- Introduction of Stores: Data stores are introduced to show where information is saved.
- Detail Level: Enough detail to understand the major logic without getting bogged down.
Level 2: Detailed Processes 🛠️
Level 2 further decomposes specific processes from Level 1. This is used for complex areas that require precise logic definition.
- Granularity: Focuses on specific workflows or modules.
- Validation: Ensures that all data flows balance with the parent process.
- Implementation: Often used as a direct reference for developers.
Notation Styles: Comparison Guide 🔄
There are two primary notations used for DFDs. While they convey the same logical information, the visual representation of the symbols differs. Understanding these differences is crucial when collaborating with teams that have specific conventions.
| Component | Gane & Sarson | Yourdon & DeMarco |
|---|---|---|
| Process | Rounded Rectangle | Circle or Rounded Rectangle |
| Data Store | Open Rectangle (2 parallel lines) | Rectangle with right-side open |
| External Entity | Rectangle | Rectangle |
| Data Flow | Arrow | Arrow |
| Connector | Arrow | Arrow |
Gane & Sarson: This notation is widely used in the United States and Europe. It uses a rounded rectangle for processes and a specific double-line shape for data stores. It emphasizes the process as a container for logic.
Yourdon & DeMarco: This notation originated earlier and is common in academic and legacy systems. It uses circles for processes. The data store is represented by a rectangle with one side missing. Both notations are valid, but consistency within a project is mandatory.
Rules for Data Flow Integrity ⚖️
To ensure a DFD is logically sound, specific rules must be followed. Violating these rules creates ambiguity and can lead to system design failures. These rules govern how data moves and transforms.
1. The Balancing Rule ⚖️
When decomposing a diagram from one level to the next, the inputs and outputs must remain consistent. This is known as data flow balancing.
- If the parent process has an input of Order Data, the child diagram must account for receiving Order Data.
- New inputs cannot appear in a child diagram that did not exist in the parent.
- Existing outputs must be preserved in the decomposition.
2. No Direct Store-to-Store Flow 🚫
Data cannot move directly from one data store to another. A process must exist to transform or move the data.
- Reason: Data movement usually requires logic (e.g., updating a record, copying a file).
- Implication: Every transfer of information must involve a processing step.
3. Data Flow Naming Conventions 🏷️
Labels on data flows must be descriptive and singular.
- Single Concept: An arrow labeled Customer Info implies a specific packet of data, not a stream of all customer data.
- Consistency: The same data packet should have the same name across all diagrams.
- No Control Flow: Do not label flows with logic (e.g., Yes/No). DFDs focus on data, not control.
4. Data Store Logic 🗄️
Data stores must be accessed logically.
- Read/Write: A process should indicate if it is reading from or writing to a store.
- Existence: A data store must be accessed by at least one process.
- Isolation: A store cannot exist without a process to manage its data.
Common DFD Errors and Pitfalls 🚨
Even experienced analysts can make mistakes when constructing diagrams. Recognizing these common errors helps in debugging and validating system designs.
1. Black Hole Process ⚫
A black hole is a process that has input but no output. It consumes data without producing any result.
- Implication: The system is consuming resources without delivering value.
- Fix: Identify what the process should produce and add the necessary data flow.
2. Miracle Process ✨
A miracle process is the opposite of a black hole. It has output but no input. It creates data from nothing.
- Implication: The system is generating data without a source.
- Fix: Trace the source of the data back to an external entity or a data store.
3. Grey Hole Process 🌫️
A grey hole occurs when the inputs and outputs of a process do not match in volume or type during decomposition.
- Implication: Data is disappearing or appearing inconsistently between levels.
- Fix: Ensure that the decomposition preserves all data flows from the parent level.
4. Crossing Data Flows ⤵️
While not always forbidden, crossing data flows can make a diagram difficult to read.
- Clarity: Use connectors to route lines around intersections if possible.
- Layout: Arrange processes and stores to minimize line crossings.
Data Flow Diagrams and the Data Dictionary 📚
A DFD cannot stand alone. It requires a Data Dictionary to define the precise structure of the data flowing through the diagram. The Data Dictionary is a repository of information about the data elements used in the system.
- Definition: Specifies the data type, length, and format of each data element.
- Relationship: Links the DFD symbols to specific database fields.
- Consistency: Ensures that the label on a DFD arrow matches the definition in the dictionary.
Without a Data Dictionary, a DFD remains a high-level abstraction. With it, the diagram becomes a blueprint for database design and application logic. This integration ensures that the visual model translates accurately into technical implementation.
Best Practices for Maintenance 🛡️
Systems evolve over time. A DFD must be maintained to reflect changes in requirements or architecture.
- Version Control: Keep track of diagram versions to manage changes.
- Change Impact: When a process changes, check all connected flows and stores.
- Review Cycles: Conduct regular reviews with stakeholders to ensure the diagram matches reality.
- Documentation: Annotate diagrams with notes explaining complex logic.
Conclusion on System Modeling 🏁
Creating a Data Flow Diagram is a disciplined activity that requires attention to detail and adherence to structural rules. By using the correct symbols and following the balancing rules, analysts can create a clear map of system behavior. The distinction between Gane & Sarson and Yourdon & DeMarco notations allows for flexibility, but consistency remains the priority. Avoiding common errors like black holes and miracles ensures logical integrity. When paired with a Data Dictionary, the DFD becomes a powerful instrument for defining system requirements and guiding development.
The value of a DFD lies in its ability to communicate complex data movements to non-technical stakeholders. It simplifies the system into understandable components, facilitating better decision-making throughout the project lifecycle. Whether designing a new application or analyzing an existing one, the principles of DFDs provide a stable foundation for system analysis.
Summary of Key Takeaways ✅
- Core Elements: Processes, Data Stores, External Entities, and Data Flows form the basis of every diagram.
- Hierarchy: Use Level 0, 1, and 2 to manage complexity and detail.
- Notation: Choose one standard (Gane & Sarson or Yourdon & DeMarco) and stick to it.
- Integrity: Ensure all flows balance between parent and child diagrams.
- Logic: Avoid data flow errors like miracles and black holes.
- Documentation: Always link DFD elements to a Data Dictionary.
Applying these principles ensures that the resulting documentation is accurate, maintainable, and useful for the entire development team. A well-constructed DFD reduces ambiguity and aligns technical execution with business goals.