


Introduction
Data Flow Diagrams (DFDs) remain one of the most powerful tools in a software developer’s arsenal for understanding, designing, and communicating system architecture. The top-down decomposition approach allows teams to break down complex systems into manageable, understandable components—moving from a high-level overview to granular details systematically.

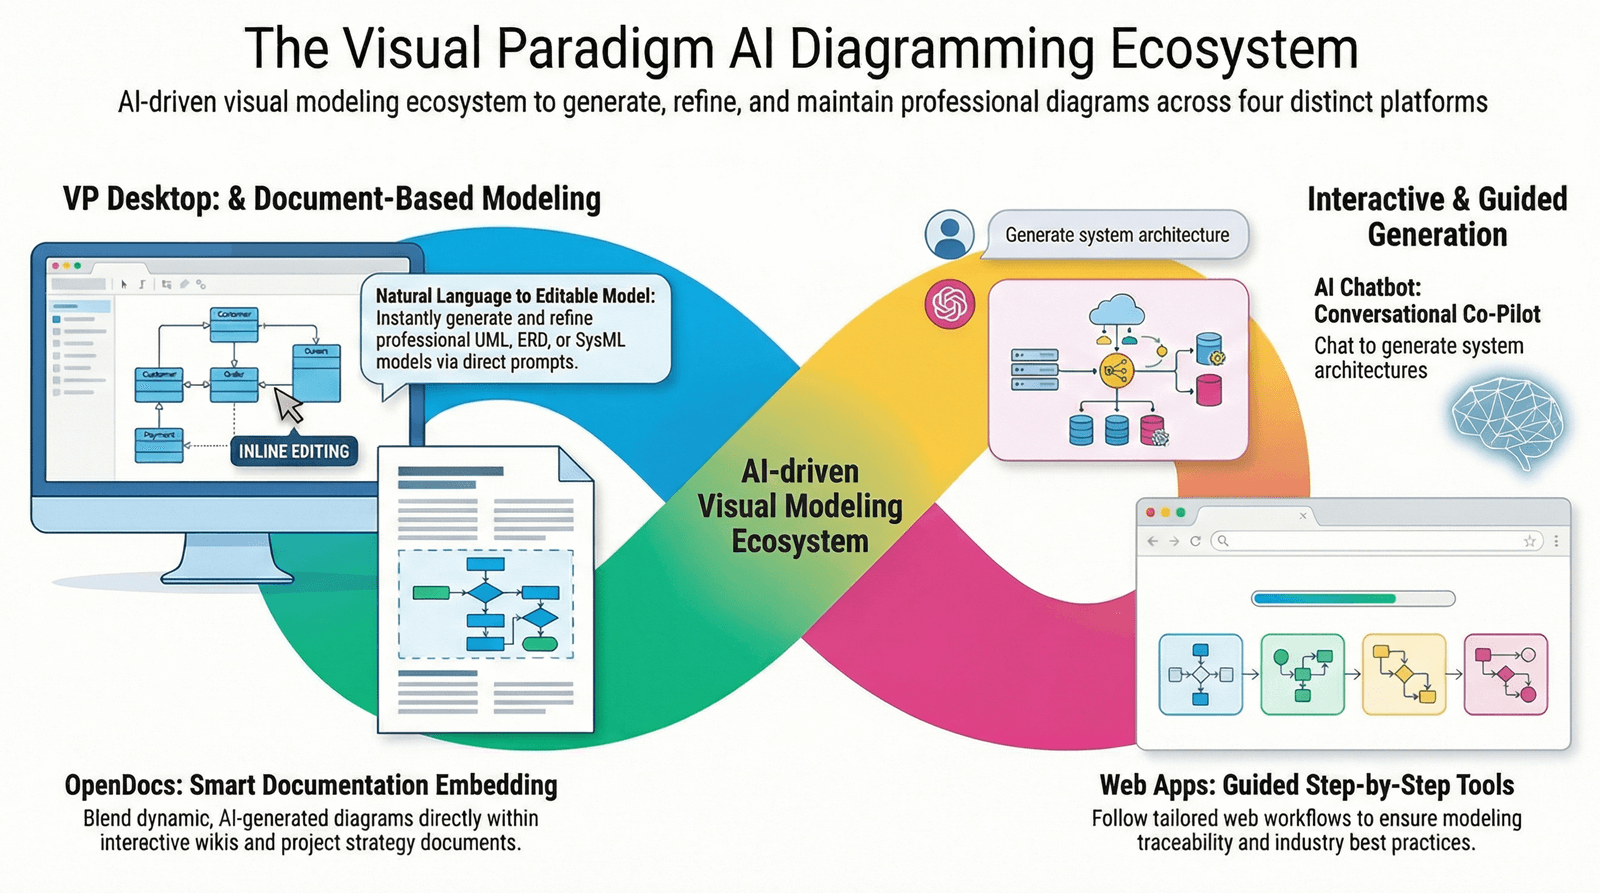
This guide explores the principles of DFD top-down decomposition and demonstrates how Visual Paradigm’s AI-powered ecosystem can revolutionize how your development team approaches system design and documentation.
Understanding DFD Top-Down Decomposition
Top-down decomposition is a systematic approach that starts with a broad, abstract view of the entire system and progressively breaks it down into smaller, more detailed components. This method mirrors how humans naturally understand complex systems: by first grasping the big picture before diving into specifics.
The Core Philosophy
The infographic illustrates three critical levels of decomposition:
-
Start Simple: Begin with the system as a single black box
-
Break It Down: Decompose into major functional processes
-
Refine Further: Explode individual processes into sub-processes
This approach prevents overwhelm, ensures nothing is missed, and creates a clear audit trail from requirements to implementation.
The Three Levels of DFD Decomposition
Level 0: Context Diagram – The 30,000-Foot View
The Context Diagram represents your entire system as a single process (labeled “System” in the infographic) interacting with external entities:
External Entities Identified:
-
Users: Primary end-users interacting with the system
-
Admin: Administrative personnel with elevated privileges
-
Database System: External database services
-
Database Gateway: Middleware or API gateways for data access
Key Characteristics:
-
Single process circle representing the entire system
-
Arrows showing data flow direction between system and entities
-
No internal details revealed
-
Establishes system boundaries and scope
When to Use:
-
Project initiation and scope definition
-
Stakeholder presentations
-
Requirements gathering sessions
-
System boundary clarification
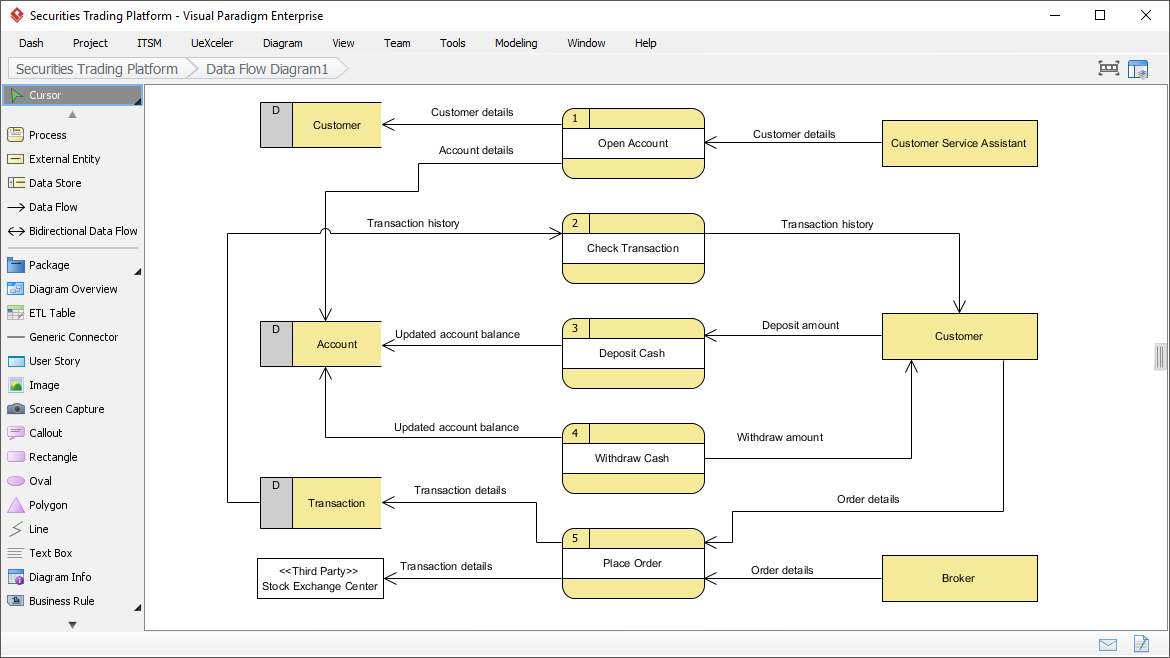
Level 1 DFD – Major Process Breakdown
At Level 1, the black box opens up to reveal the system’s major functional processes:
Processes Shown:
-
P1: Initial order processing
-
P2: Order input handling
-
P3: User input processing
-
P4: Report generation
Data Flows Identified:
-
Order Data: Flowing from P1 to P3
-
Order Input: Moving from P1 to P2
-
User Input: From P3 to data store DS2
-
Report: Output from the process chain
Data Stores:
-
DS2: User input storage
Key Characteristics:
-
Shows 3-9 major processes (cognitive load management)
-
Reveals data flow patterns between processes
-
Identifies data stores
-
Maintains connection to external entities
When to Use:
-
System architecture design
-
Team role assignment
-
Module identification
-
Integration planning
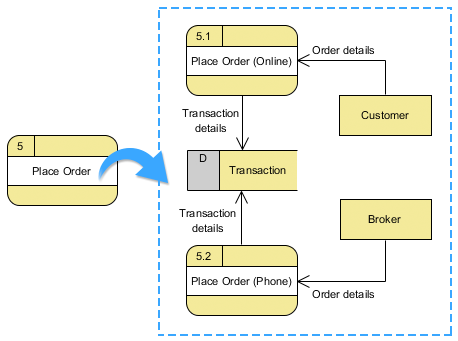
Level 2 DFD – Granular Detail
Level 2 explodes a single Level 1 process (P1 in this case) into its constituent sub-processes:
Sub-Processes:
-
P1.1: First sub-process of order handling
-
P1.2: Second sub-process (likely validation or transformation)
-
P1.3: Third sub-process (completion or handoff)
Data Store:
-
DS1.1: Detailed data storage for P1 operations
Key Characteristics:
-
Shows detailed workflow within a single major process
-
Reveals implementation-specific logic
-
Identifies specific data manipulation points
-
Bridges design to code
When to Use:
-
Detailed design documentation
-
Developer task assignment
-
Code structure planning
-
Test case development
Benefits for Software Development Teams
1. Progressive Complexity Management
Teams avoid cognitive overload by focusing on one level of abstraction at a time. Architects see the big picture; developers see implementation details.
2. Clear Communication Across Stakeholders
-
Executives: Context Diagram shows system scope and boundaries
-
Product Managers: Level 1 reveals feature areas and dependencies
-
Developers: Level 2 provides implementation roadmaps
3. Modular Development
Each process bubble can become a module, microservice, or class, enabling parallel development and clear ownership.
4. Requirements Traceability
Every data flow and process can be traced back to business requirements, ensuring nothing is built without purpose.
5. Risk Identification
Complex data flows and numerous external dependencies become immediately visible, allowing proactive risk management.
6. Documentation That Stays Relevant
Unlike lengthy text documents, DFDs are visual, scannable, and easier to maintain as systems evolve.
How Visual Paradigm’s AI & Tool Ecosystem Transforms DFD Development
Visual Paradigm (VP) has evolved from a simple diagramming tool into an AI-powered software development ecosystem that dramatically accelerates and enhances the DFD creation process. Here’s how:
1. AI-Powered Diagram Generation
Text-to-Diagram AI
Visual Paradigm’s AI can analyze natural language requirements and automatically generate initial DFD structures:
Example Workflow:
Input: "Users submit orders through a web interface.
The system validates the order, checks inventory,
processes payment, and sends confirmation emails."

VP AI Output:
- Suggests Context Diagram with User entity
- Proposes Level 1 processes: Validate Order,
  Check Inventory, Process Payment, Send Confirmation
- Identifies data stores: Orders DB, Inventory DB
Benefits:
-
80% faster initial diagram creation
-
Reduces human error in identifying entities and flows
-
Ensures consistency with requirements
-
Perfect for agile teams needing rapid documentation
2. Smart Decomposition Assistant
VP’s AI can automatically suggest decomposition paths:
Features:
-
Process Complexity Analysis: AI identifies processes that are too complex and should be decomposed to Level 2
-
Balanced Decomposition: Ensures all inputs/outputs are preserved across levels
-
Naming Convention Enforcement: Suggests consistent naming (P1, P1.1, P1.2, etc.)
Real-World Impact:
A development team working on an e-commerce platform used VP’s decomposition assistant to break down a monolithic “Order Processing” process into 12 sub-processes, revealing hidden dependencies that prevented a potential production outage.
3. Code Engineering & Reverse Engineering
Forward Engineering: DFD to Code
Visual Paradigm can generate code skeletons from DFD processes:
DFD Process P1.1 → Java Class: OrderValidator.java
DFD Data Store DS2 → Database Schema SQL
DFD Data Flow → API Endpoint Definitions
Supported Languages:
-
Java, C#, Python, JavaScript/TypeScript
-
PHP, Ruby, Swift
-
SQL (multiple dialects)
Reverse Engineering: Code to DFD
More impressively, VP can analyze existing codebases and automatically generate DFDs:
Use Case:
Your team inherits a legacy system with no documentation. VP’s reverse engineering:
-
Scans the codebase
-
Identifies data flows, processes, and stores
-
Generates Level 1 and Level 2 DFDs automatically
-
Highlights undocumented external dependencies
Time Savings: What would take weeks of manual analysis completes in hours.
4. Collaborative Modeling Environment
Real-Time Team Collaboration
Visual Paradigm’s cloud-based platform enables:
-
Multi-user editing: Business analysts, architects, and developers work simultaneously
-
Comment threads: Discuss specific processes or data flows
-
Version control: Track diagram evolution over time
-
Role-based access: Control who can edit vs. view
Integration with Development Tools
VP integrates seamlessly with:
-
Jira: Link DFD processes to user stories and tasks
-
GitHub/GitLab: Sync diagrams with repository commits
-
Confluence: Embed live DFDs in documentation
-
Slack/Teams: Get notifications when diagrams change
5. AI-Powered Consistency Checking
One of the biggest challenges with manual DFD creation is maintaining consistency across levels. VP’s AI automatically validates:
Balance Checking:
-
Ensures all inputs to a Level 1 process appear in its Level 2 decomposition
-
Flags orphaned data flows
-
Identifies missing data stores
Completeness Analysis:
-
Detects processes with no inputs (impossible)
-
Finds processes with no outputs (useless)
-
Identifies disconnected diagram elements
Example:
VP AI Alert: "Process P3 in Level 1 has input 'User Input'
but none of its Level 2 sub-processes (P3.1, P3.2) accept
this input. Diagram is unbalanced."
6. Impact Analysis & Change Management
When requirements change, VP’s AI helps assess the ripple effect:
Scenario: “We need to add a new payment gateway”
VP Analysis:
-
Identifies affected processes (P2: Payment Processing)
-
Shows related data stores (Payment DB, Transaction Log)
-
Lists connected external entities (Payment Gateway API)
-
Suggests which Level 2 diagrams need updates
-
Generates a change impact report for stakeholders
Benefit: Teams avoid unintended consequences and scope creep.
7. Template Library & Best Practices
Visual Paradigm includes:
-
Industry-specific templates: E-commerce, healthcare, finance, logistics
-
Pre-built patterns: Common processes like authentication, reporting, notifications
-
Compliance frameworks: GDPR, HIPAA, PCI-DSS data flow templates
Accelerated Onboarding:
New team members can start with proven templates rather than blank canvases, ensuring industry best practices from day one.
8. Automated Documentation Generation
VP doesn’t just create diagrams—it generates comprehensive documentation:
Auto-Generated Reports:
-
Process Specifications: Detailed descriptions of each process
-
Data Dictionary: Definitions of all data flows and stores
-
Entity Descriptions: External system documentation
-
Gap Analysis: Missing requirements or undocumented flows
Export Formats:
-
PDF, Word, HTML
-
Interactive web documentation
-
PowerPoint for stakeholder presentations
9. Simulation & Validation
Advanced VP features allow teams to:
-
Simulate data flows: Test if the designed system handles expected volumes
-
Identify bottlenecks: Processes with too many inputs/outputs
-
Validate against constraints: Performance, security, compliance requirements
Example:
Before building a high-traffic e-commerce system, the team simulates order processing flows and discovers that P3 (Inventory Check) becomes a bottleneck. They redesign to add caching (new data store DS3) before writing code.
10. AI-Powered Refactoring Suggestions
VP’s AI analyzes your DFDs and suggests improvements:
Common Suggestions:
-
“Processes P4 and P5 have identical inputs and outputs. Consider merging.”
-
“Data store DS2 is accessed by 8 processes. Consider splitting for better modularity.”
-
“Process P1.2 has 12 sub-processes. Consider creating P1.2.1, P1.2.2 hierarchy.”
Result: Cleaner, more maintainable system architecture.
Practical Implementation Guide: Using VP for DFD Development
Phase 1: Discovery & Context Diagram (Week 1)
Step 1: Gather Requirements
-
Interview stakeholders
-
Review existing documentation
-
Identify business objectives
Step 2: Use VP AI for Initial Draft
VP Feature: AI Assistant → Text-to-Diagram
Input: Business requirements document
Output: Draft Context Diagram
Step 3: Validate with Stakeholders
-
Review external entities
-
Confirm system boundaries
-
Get sign-off on scope
VP Tool: Use VP’s presentation mode for stakeholder reviews
Phase 2: Level 1 Decomposition (Weeks 2-3)
Step 4: Identify Major Processes
-
Break system into 5-9 major functions
-
Use VP’s process library for common patterns
Step 5: Map Data Flows
-
Connect processes to external entities
-
Identify data stores
-
Label all flows clearly
VP Feature: Smart connectors auto-suggest data flow names based on connected elements
Step 6: Consistency Check
VP Tool: Auto-Validation → Balance Checker
Ensures: All external entity flows accounted for
Phase 3: Level 2+ Decomposition (Weeks 4-6)
Step 7: Prioritize Processes for Decomposition
-
Focus on complex processes first
-
Use VP’s complexity metrics to identify candidates
Step 8: Create Detailed DFDs
-
Explode each Level 1 process
-
Maintain naming conventions (P1 → P1.1, P1.2, etc.)
VP Feature: Auto-decomposition wizard preserves inputs/outputs
Step 9: Generate Code Skeletons
VP Tool: Code Engineering → Generate Code
Select: Target language (Java, Python, etc.)
Output: Class structures, method signatures, database schemas
Phase 4: Implementation & Iteration (Ongoing)
Step 10: Sync with Development
-
Link DFD processes to Jira epics/stories
-
Update diagrams as code evolves
VP Integration: Bi-directional sync with Jira
Step 11: Reverse Engineer Changes
-
After major code changes, re-run reverse engineering
-
Compare with existing DFDs
-
Update documentation
VP Feature: Diagram comparison tool highlights differences
Step 12: Continuous Validation
-
Run VP’s consistency checks weekly
-
Address AI-suggested improvements
-
Keep documentation current
Best Practices for DFD Development with Visual Paradigm
1. Start with AI, Refine with Human Intelligence
-
Let VP AI generate the first draft
-
Have domain experts review and refine
-
Combine speed with accuracy
2. Maintain Consistent Naming Conventions
Good:    P1 → P1.1, P1.2, P1.3
Bad:     P1 → A, B, Process 7

VP Feature: Auto-naming enforcement
3. Use Color Coding Strategically
-
Blue: External entities
-
Green: Processes
-
Orange: Data stores
-
Red: Critical security-related flows
VP Tool: Smart styling templates
4. Document as You Go
-
Add descriptions to each process in VP
-
Use the notes feature for business rules
-
Link to related documentation
5. Version Control Everything
-
Commit DFDs to Git alongside code
-
Use meaningful commit messages
-
Tag releases
VP Integration: Native Git support
6. Review Cycles
-
Weekly: Team reviews of new/changed diagrams
-
Monthly: Architecture review board
-
Quarterly: Full system DFD audit
7. Train the Team
-
Onboard developers to VP basics
-
Train architects on advanced AI features
-
Create internal DFD standards document
VP Resource: VP University online training
8. Measure Success
Track metrics like:
-
Time from requirements to documented design
-
Number of design-related bugs in production
-
Developer onboarding time
-
Stakeholder satisfaction scores
Real-World Success Stories
Case Study 1: FinTech Startup
Challenge: A fintech startup needed to document their payment processing system for PCI-DSS compliance audit in 6 weeks.
VP Solution:
-
Used reverse engineering to generate DFDs from existing code
-
AI identified 23 undocumented data flows
-
Auto-generated compliance documentation
Result: Passed audit with zero findings. Saved 200+ hours of manual documentation.
Case Study 2: Healthcare System Migration
Challenge: Hospital migrating from monolithic EHR to microservices needed to understand complex data flows.
VP Solution:
-
Created Context Diagram with 47 external entities
-
Decomposed to Level 3 for critical processes
-
Used impact analysis to plan migration sequence
Result: Zero downtime migration. 40% faster than projected timeline.
Case Study 3: E-Commerce Platform Redesign
Challenge: Online retailer’s checkout process had 30% cart abandonment rate.
VP Solution:
-
Mapped existing checkout DFD (Level 2 detail)
-
AI identified 12 unnecessary data validation steps
-
Simulated optimized flow
Result: Reduced checkout steps from 12 to 5. Abandonment rate dropped to 18%.
Common Pitfalls and How VP Helps Avoid Them
Pitfall 1: Diagram Sprawl
Creating too many levels of decomposition too quickly.
VP Solution: AI complexity analyzer recommends optimal decomposition depth.
Pitfall 2: Inconsistent Abstraction Levels
Mixing high-level and detailed processes in the same diagram.
VP Solution: Validation rules flag abstraction level violations.
Pitfall 3: Orphaned Elements
Processes or data stores with no connections.
VP Solution: Auto-detection and highlighting of disconnected elements.
Pitfall 4: Documentation Drift
Diagrams become outdated as code changes.
VP Solution: Automated reverse engineering keeps diagrams synchronized.
Pitfall 5: Over-Engineering
Creating unnecessary processes and flows.
VP Solution: AI suggests simplifications and merges redundant elements.
Advanced VP Features for Enterprise Teams
1. Model-Driven Development (MDD)
Transform DFDs directly into working applications:
-
Define business logic in DFD processes
-
VP generates complete application scaffolding
-
Developers focus on business logic, not boilerplate
2. API Design from DFDs
Automatically generate:
-
RESTful API specifications (OpenAPI/Swagger)
-
GraphQL schemas
-
API documentation
Workflow:
DFD Data Flows → API Endpoints
DFD Data Stores → Database Models
DFD Processes → Service Layer
3. Security Analysis
VP’s security module:
-
Identifies sensitive data flows
-
Suggests encryption points
-
Validates compliance with security frameworks
-
Generates threat models
4. Performance Modeling
-
Simulate data volumes through processes
-
Identify potential bottlenecks
-
Recommend caching strategies
-
Calculate resource requirements
5. Multi-Project Portfolio Management
For organizations with multiple systems:
-
Cross-project dependency mapping
-
Enterprise architecture views
-
Shared component libraries
-
Impact analysis across systems
Getting Started with Visual Paradigm
Step 1: Choose Your Edition
-
Community Edition: Free, basic DFD features
-
Standard Edition: Code engineering, collaboration
-
Enterprise Edition: AI features, advanced modeling, MDD
Step 2: Set Up Your Environment
-
Install VP Desktop or use VP Online
-
Configure integrations (Jira, Git, etc.)
-
Set up team access and permissions
Step 3: Import Existing Assets
-
Reverse engineer existing codebases
-
Import requirements documents
-
Migrate from other modeling tools
Step 4: Train Your Team
-
Complete VP University courses
-
Run internal workshops
-
Create team-specific templates
Step 5: Start Your First Project
-
Begin with Context Diagram
-
Use AI assistant for guidance
-
Iterate and refine
Conclusion
DFD top-down decomposition remains a cornerstone of effective software development, providing the clarity and structure teams need to build complex systems successfully. The three-level approach—Context Diagram, Level 1, and Level 2—enables progressive disclosure of complexity, ensuring that every stakeholder sees the information they need at the right level of detail.
However, manual DFD creation is time-consuming, error-prone, and often leads to documentation that quickly becomes outdated. This is where Visual Paradigm’s AI-powered ecosystem transforms the game.
By combining:
-
AI-powered diagram generation that accelerates initial creation
-
Smart validation that ensures consistency and completeness
-
Code engineering that bridges design and implementation
-
Collaboration tools that keep teams aligned
-
Reverse engineering that maintains documentation accuracy
Visual Paradigm enables development teams to:
-
Reduce design time by 60-80%
-
Eliminate documentation drift
-
Catch design flaws before coding begins
-
Improve cross-team communication
-
Accelerate developer onboarding
-
Ensure compliance and audit readiness
The future of software development isn’t just about writing better code—it’s about designing better systems. And with Visual Paradigm’s comprehensive toolset, your team has everything needed to master the art and science of DFD top-down decomposition.
Start your journey today: Begin with a simple Context Diagram, let VP’s AI guide your decomposition, and watch as your complex system transforms into a clear, manageable, and well-documented architecture that your entire team can understand and build upon.
Additional Resources
Visual Paradigm Resources
-
VP University: Free online training courses
-
VP Community Forum: Peer support and best practices
-
VP Template Gallery: Industry-specific DFD templates
-
VP YouTube Channel: Video tutorials and webinars
Recommended Reading
-
“Structured Analysis and System Specification” by Tom DeMarco
-
“Software Architecture in Practice” by Len Bass
-
“Visual Paradigm User Guide” (official documentation)
Tools & Integrations
-
Jira Integration Guide: Link DFDs to agile workflows
-
GitHub Sync Tutorial: Version control for diagrams
-
API Design Workshop: From DFD to OpenAPI spec
Ready to transform your software development process? Explore Visual Paradigm’s AI-powered DFD tools and join thousands of teams building better systems through better design.
Reference
- What is Data Flow Diagram?: This foundational guide explains that a DFD graphically represents the movement of data within a business information system, illustrating key processes and data transfers.
- How to Create Data Flow Diagram (DFD)?: A practical tutorial that teaches users how to visually depict data movement through system processes, a standard technique in modern software design.
- Interactive Data Flow Diagram Maker Tool: This article describes an intuitive online tool designed for creating professional DFDs with ease, emphasizing clarity and user-friendly features.
- Step-by-Step DFD Tutorial Guide: A beginner-friendly resource designed to walk creators through the essential steps of building effective and accurate data flow diagrams.
- New Diagram Types Added to AI Diagram Generator: DFD & ERD: This release announcement details the expanded capabilities of the AI generator, which now includes support for automated Data Flow Diagram creation.
- AI-Powered DFD and Information Flow Analysis: This article explores how the AI diagram generator streamlines information flow analysis by enabling the instant creation of DFDs from text prompts.
- Demystifying Information Flow with DFDs: A comprehensive guide that explains the conceptual framework of DFDs and how they model the movement of information across various system components.
- Mastering Data Flow Diagrams with Visual Paradigm: An in-depth exploration of advanced modeling tools and best practices for creating complex DFDs within a professional environment.
- Pre-built DFD Templates for Quick Design: This resource highlights a library of ready-to-use templates that help users jumpstart their DFD modeling and maintain design standards.
- Unlock the Power of Data Flow Diagrams (DFD) with Visual Paradigm: This guide discusses the comprehensive ecosystem provided for DFD modeling, emphasizing its role in efficient system design and team collaboration.