


Transitioning from a monolithic architecture to a cloud-native environment is one of the most significant challenges modern engineering teams face. It involves more than just refactoring code; it requires a fundamental shift in how the system is perceived, documented, and maintained. Architecture documentation plays a critical role in this process, ensuring all stakeholders understand the evolving structure. The C4 model provides a standardized way to visualize software architecture, but its application changes when boundaries shift from a single deployable unit to distributed services. This guide explores how to adapt C4 notation throughout the migration journey.
🧭 Understanding the Shift in Architectural Boundaries
In a monolithic setup, the system typically exists as a single, cohesive block. External systems interact with a defined entry point, and internal logic is contained within a shared codebase. When moving to cloud-native infrastructure, this cohesive block breaks apart into multiple independent services. These services communicate over networks, often using containers and orchestration platforms. The documentation must reflect this fragmentation without losing the big picture.
The C4 model is designed to be hierarchical, moving from high-level context down to code-level details. Each level serves a different audience and purpose. During a migration, the context of each level changes significantly.
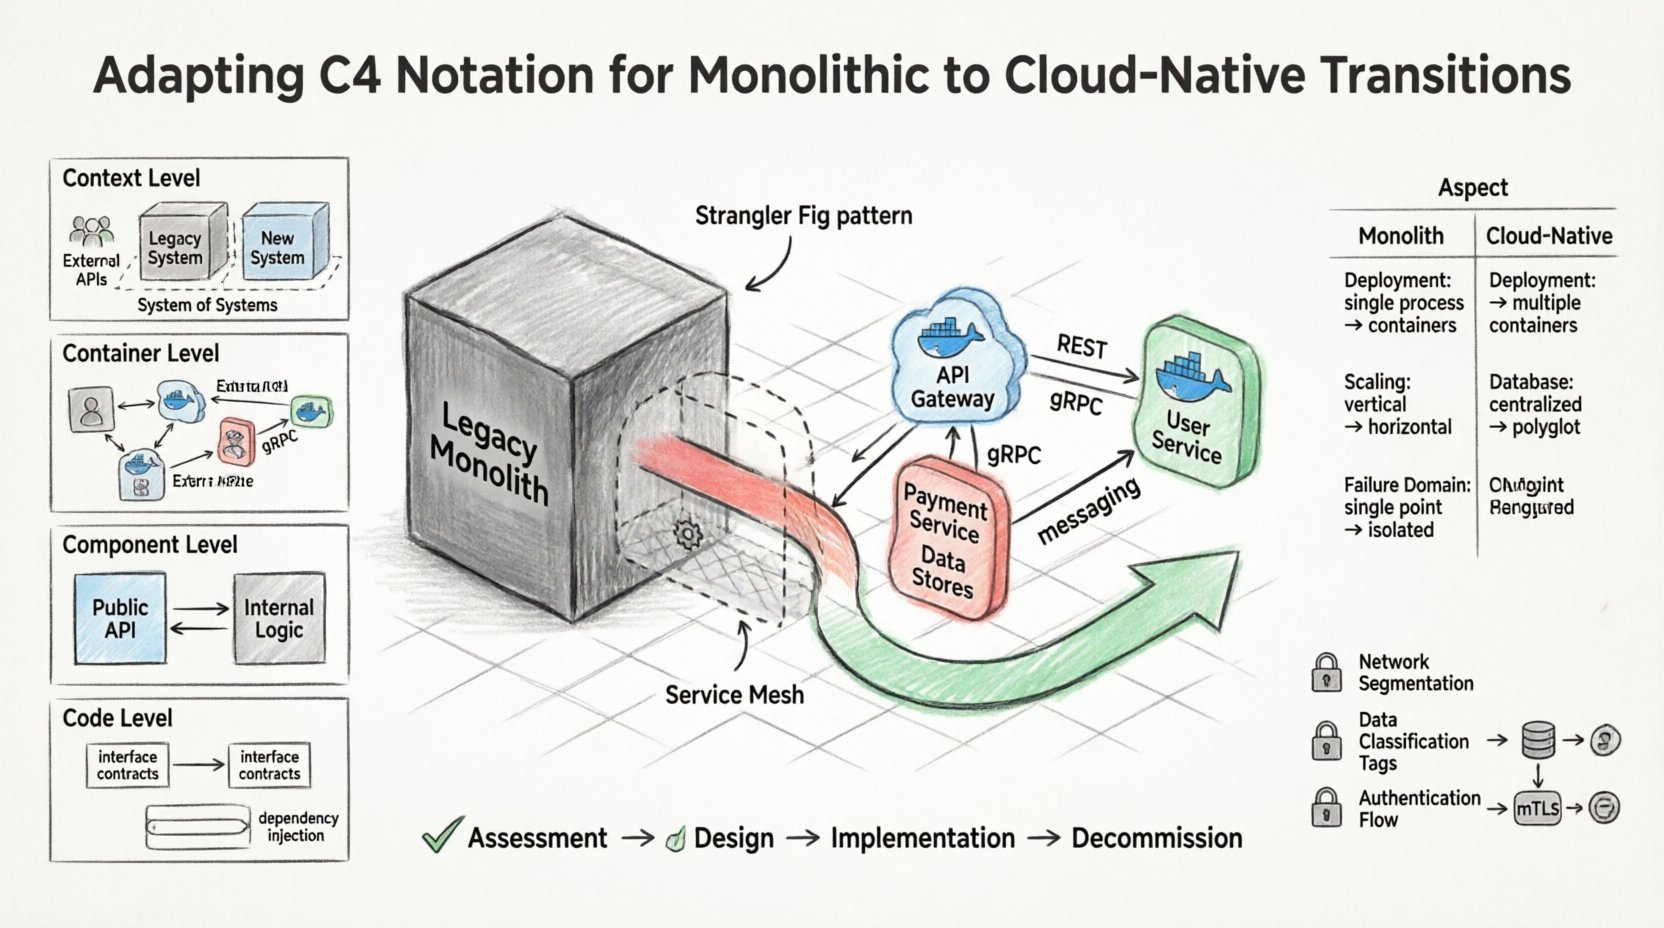
- Context: Moves from a single system boundary to a system of systems.
- Containers: Shifts from one large application to multiple distinct service instances.
- Components: Evolves from modules within a process to microservice endpoints.
- Code: Changes from a unified codebase to distributed repositories.
🔍 Level 1: System Context Diagrams
The System Context diagram is the entry point for understanding the software. It shows the system itself, people, and other systems that interact with it. In a monolithic transition, this diagram often remains stable, but the internal representation of the “system” changes.
🏗️ Updating the System Boundary
Originally, the system boundary might have been a simple box representing the entire application. As the transition progresses, you must decide how to represent the boundary. Does the boundary encompass the entire legacy application until it is fully decommissioned? Or does it represent the new cloud-native ecosystem?
- Strangler Fig Pattern: If using this pattern, the diagram should show the legacy system coexisting with new services. Arrows should indicate how requests flow from the old entry point to the new services.
- Service Mesh: If a service mesh is introduced, it acts as an infrastructure layer. The context diagram should show the system interacting with the mesh, which then manages internal traffic.
- External Dependencies: Third-party services may change. A monolith might have used a local database, while a cloud-native system uses a managed database service. These relationships must be updated in the context layer.
👥 Stakeholder Communication
Stakeholders often worry about downtime or data loss during migration. The context diagram is the best tool to explain the high-level flow. By clearly showing how users interact with the system before and after the split, you reduce anxiety. Visualizing the external systems helps clarify if any integrations need to be rewritten.
📦 Level 2: Container Diagrams
The Container diagram details the technology choices and boundaries of the system. In a monolith, this is usually one container (e.g., a WAR file or a single executable). In a cloud-native environment, this level becomes the most critical during transition.
🔗 Defining Service Boundaries
When decomposing a monolith, the goal is to identify logical services. The Container diagram helps define these boundaries before code is written. You should map existing functionality to new containers.
- Identification: List potential containers such as API Gateways, Backend Services, and Data Stores.
- Technology Agnostic: Do not specify specific orchestration tools. Focus on the function of the container (e.g., “User Management Service” instead of “Kubernetes Pod”).
- Communication: Clearly label how containers talk. Is it synchronous REST, asynchronous messaging, or gRPC? This defines the coupling between services.
🚧 The Hybrid State
During the transition, you will likely have a hybrid state. Some parts of the system remain monolithic, while others are containerized. The diagram should reflect this. Use dashed lines to indicate boundaries that are not yet fully established or are provisional.
| Feature | Monolithic State | Cloud-Native State |
|---|---|---|
| Deployment Unit | Single Process | Multiple Containers |
| Scaling | Vertical / Whole System | Horizontal / Per Service |
| Database | Centralized Schema | Decentralized / Polyglot |
| Failure Domain | Single Point of Failure | Isolated Failures |
🧩 Level 3: Component Diagrams
Component diagrams show how a container is split into smaller parts. In a monolith, these are often packages or classes. In a cloud-native system, these become the internal architecture of a microservice.
🔧 Internal Logic Separation
As you break down the monolith, you must ensure each container has a clear internal structure. The component diagram helps developers understand what belongs inside a specific service.
- Domain-Driven Design: Align components with business domains. A “Payment Service” should contain components related to billing, not user authentication.
- API Exposure: Clearly mark which components expose public APIs and which are internal. This prevents services from depending on internal implementation details of other services.
- Shared Libraries: Avoid creating shared libraries that force tight coupling. If a component is used by multiple services, consider if it should be a separate service instead.
🔄 Handling State
State management is a major concern in cloud-native transitions. Component diagrams should indicate where state is held. Is it in memory, in a database, or in a cache? This information is crucial for understanding resilience and data consistency.
💻 Level 4: Code Diagrams
The Code level is the most granular. It shows classes and interfaces. While less commonly used for high-level architecture, it is vital during the refactoring phase to ensure code quality.
📝 Interface Definitions
When splitting a monolith, interfaces become the contract between services. The code diagram helps visualize these contracts.
- API Contracts: Document the request and response structures. This ensures that the client and server remain compatible during the transition.
- Dependency Injection: Show how dependencies are injected. This promotes testability and loose coupling.
- Testing Strategy: Indicate which components have unit tests and which require integration tests. This helps plan the quality assurance process.
⚠️ Common Pitfalls in Documentation
Documentation often becomes outdated quickly during complex migrations. Here are common issues to avoid.
- Over-Detail: Do not document every method. Focus on architectural decisions and key interfaces.
- Tool Dependency: Do not rely on a single diagramming tool that might become obsolete. Use formats that can be exported or versioned.
- Lack of Ownership: Assign ownership of specific diagrams to specific teams. If no one owns the “Container Diagram,” it will rot.
- Ignoring Technical Debt: Do not document the legacy code as if it were perfect. Mark known technical debt areas clearly in the diagrams.
🛠️ Maintaining Synchronicity
Keeping documentation in sync with code is the hardest part of the transition. Automated generation helps, but human review is still necessary.
🔄 Version Control Integration
Store diagrams in the same version control system as the code. This ensures that changes to the architecture are reviewed in pull requests alongside code changes. If a new service is added, the diagram update should be a requirement for merging.
📅 Regular Reviews
Schedule regular architecture reviews. During these sessions, walk through the diagrams with the team. Ask questions like:
- Does the diagram reflect the current deployment?
- Are the data flows still accurate?
- Have any new dependencies been introduced?
🚀 Strategic Planning for Migration
Using C4 notation throughout the migration allows for better risk management. By visualizing the target state, you can identify bottlenecks before they become problems.
🗺️ Phased Approach
Adopt a phased approach to the migration. Update the diagrams at each phase.
- Assessment: Document the current state. Identify all external dependencies.
- Design: Create the target state diagrams. Define the boundaries of new services.
- Implementation: Update diagrams as services are built. Validate against the design.
- Decommission: Remove old components from the diagrams once they are no longer in use.
🔐 Security Considerations
Security is a critical aspect of cloud-native transitions. The diagrams should reflect security boundaries.
- Network Segmentation: Show which containers are public-facing and which are internal.
- Data Classification: Indicate where sensitive data is processed. This helps in compliance audits.
- Authentication: Document how authentication flows between services. Is it OAuth, mTLS, or API keys?
🌟 Conclusion
Adapting C4 notation for a monolithic to cloud-native transition is not just about drawing new boxes. It is about understanding the shifting responsibilities of the architecture. By maintaining clear, accurate, and hierarchical documentation, teams can navigate the complexity of distributed systems. The diagrams serve as a communication tool, a planning aid, and a record of architectural decisions. As the system evolves, so should the documentation. Regular updates and clear ownership ensure that the C4 model remains a valuable asset throughout the lifecycle of the software.