In the architecture of complex systems, clarity is the highest form of currency. Data Flow Diagrams (DFDs) stand as a cornerstone for visualizing how information moves through a system. They do not show control logic or timing, but rather the flow of data between processes, data stores, and external entities. This guide explores the mechanics, rules, and strategic application of DFDs to ensure robust system design without relying on specific tools or proprietary software.
What is a Data Flow Diagram? 📊
A Data Flow Diagram is a graphical representation of the flow of data through an information system. Unlike a flowchart, which maps the sequence of events or control logic, a DFD focuses strictly on data inputs and outputs. It answers the question: Where does the data come from, where does it go, and how is it transformed?
DFDs are essential during the requirements gathering phase. They help stakeholders visualize the scope of a project and identify critical data streams. By abstracting away implementation details, DFDs allow teams to focus on the functional requirements of the system.
Why DFDs Matter
- Communication: They bridge the gap between technical teams and non-technical stakeholders.
- Documentation: They provide a persistent record of system logic for future maintenance.
- Analysis: They help identify bottlenecks, redundancies, and missing data paths.
- Validation: They serve as a checklist to ensure all data requirements are met.
Core Components of a DFD 🧩
Every DFD consists of four primary elements. Understanding these building blocks is critical for accurate modeling.
1. External Entities (The Source & Destination) 🚦
External entities represent people, organizations, or other systems that interact with the system being modeled. They are the source or destination of data but lie outside the system boundary.
- Examples: Customers, Suppliers, Payment Gateways, Regulatory Bodies.
- Notation: Typically represented as rectangles or squares.
2. Processes (The Transformers) 🔄
Processes transform incoming data into outgoing data. They perform calculations, update records, or validate information. A process must have at least one input and one output.
- Examples: “Calculate Tax”, “Verify Login”, “Generate Invoice”.
- Notation: Usually circles or rounded rectangles.
3. Data Stores (The Repositories) 🗂️
Data stores hold data for later use. They represent databases, files, or physical storage locations within the system.
- Examples: Customer Database, Inventory Log, Configuration File.
- Notation: Typically open-ended rectangles or parallel lines.
4. Data Flows (The Connectors) 🛣️
Data flows indicate the movement of data between entities, processes, and stores. Every arrow must have a label describing the data being transferred.
- Direction: Flows are directional. Data moves from one component to another.
- Labeling: Must be specific (e.g., “Order Details” instead of just “Data”).
Levels of Decomposition 📉
DFDs are hierarchical. Complex systems cannot be understood in a single view. We break them down into levels to manage complexity.
Level 0: Context Diagram
The Context Diagram is the highest-level view. It shows the entire system as a single process and its interaction with external entities. It defines the system boundary.
- Focus: System scope.
- Complexity: Minimal. One process node.
Level 1: High-Level Breakdown
This level decomposes the single process from the Context Diagram into major sub-processes. It reveals the main functional areas of the system.
- Focus: Major functional modules.
- Detail: Shows major data stores and key flows.
Level 2: Detailed Logic
Further decomposing Level 1 processes into specific tasks. This level is often used for implementation planning.
- Focus: Specific logic paths.
- Detail: Granular data transformation steps.
Level 3 and Beyond
Used for extremely complex subsystems. In most cases, Level 2 provides sufficient detail for development teams.
Rules and Conventions ⚖️
To maintain accuracy, DFDs must adhere to specific rules. Violating these conventions can lead to ambiguous system designs.
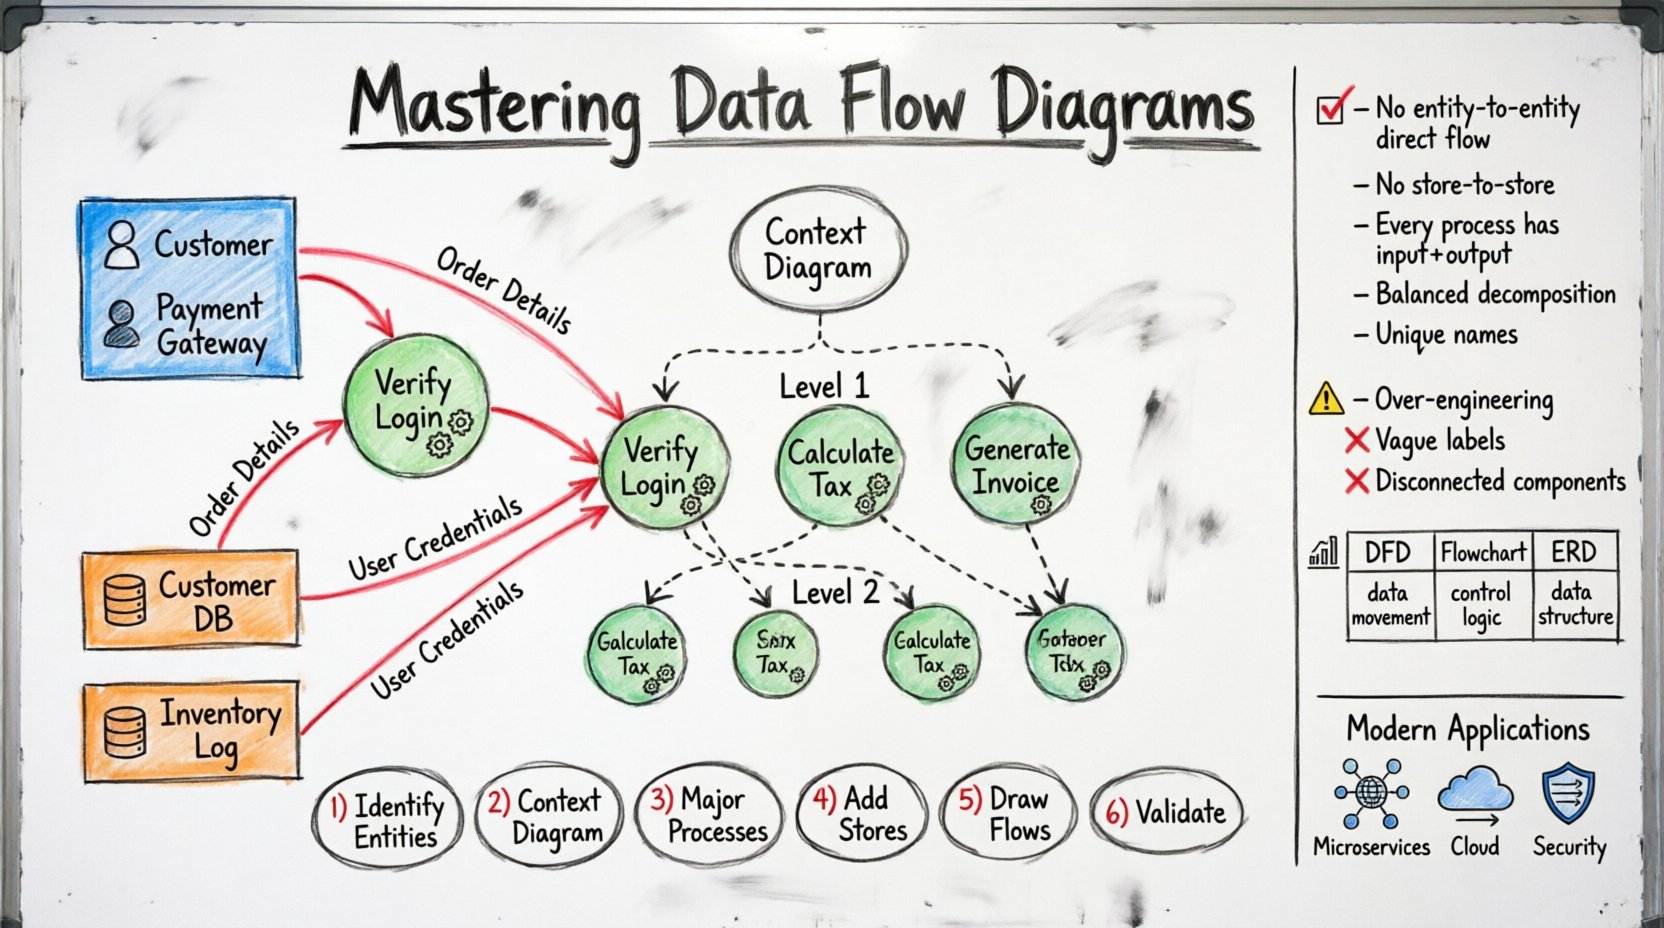
Rule 1: No Direct Data Flow Between Entities
Data cannot flow directly from one external entity to another. It must pass through the system (a process) to be processed or validated.
Rule 2: No Direct Flow Between Stores
Data cannot move directly between two data stores. A process must mediate the transfer to ensure integrity.
Rule 3: Every Process Needs an Input and Output
A process without input is a “Miracle” (creating data from nothing). A process without output is a “Black Hole” (consuming data with no result). Both are errors.
Rule 4: Data Flow Balancing
When a process is decomposed into sub-processes, the input and output data flows must remain consistent between the parent and child levels.
Rule 5: Unique Naming
Each process, entity, and store should have a unique name to avoid confusion.
DFD vs. Other Diagrams 🆚
Confusion often arises between DFDs and other modeling tools. Understanding the distinction ensures the right tool is used for the right job.
| Feature | Data Flow Diagram (DFD) | Flowchart | Entity Relationship Diagram (ERD) |
|---|---|---|---|
| Focus | Data movement and transformation | Control logic and sequence | Data structure and relationships |
| Primary Actor | System Analyst | Programmer | Database Designer |
| Time Aspect | None (Static) | High (Sequence matters) | None (Static) |
| Best Used For | System Requirements | Algorithm Design | Database Schema |
Step-by-Step Guide to Creating a DFD 🛠️
Creating a valid DFD requires a methodical approach. Follow these steps to ensure accuracy.
Step 1: Identify External Entities
List all sources and destinations of data. Ask: Who interacts with this system? What external systems send data to it?
Step 2: Define the Context Diagram
Draw the system as one bubble. Connect external entities with labeled arrows. This sets the boundary.
Step 3: Identify Major Processes
Break the context bubble into major functional areas. What are the main jobs the system performs?
Step 4: Add Data Stores
Identify where data is saved. Ensure every store is connected to at least one process.
Step 5: Draw Data Flows
Connect components with arrows. Label every arrow with the specific data moving.
Step 6: Validate and Balance
Check for black holes, miracles, and balancing. Ensure data is not lost or created magically.
Common Pitfalls to Avoid 🚫
Even experienced engineers can make mistakes. Awareness of common errors prevents rework later.
- Over-Engineering: Trying to model every single detail in Level 0. Keep it high-level.
- Control Flow Confusion: Including buttons, menus, or user actions. DFDs track data, not UI events.
- Missing Feedback Loops: Forgetting that data often returns to a process for validation.
- Vague Labels: Using terms like “Info” or “Data”. Be specific: “User Credentials” or “Sales Report”.
- Disconnected Components: Leaving a process or store without any flow. Everything must connect.
DFDs in Modern Engineering Contexts 🚀
While the core principles remain unchanged, the application of DFDs has evolved with modern architectures.
Microservices Architecture
In distributed systems, DFDs are crucial for mapping API interactions. They help visualize how services communicate without tight coupling. Each service becomes a process node, and API endpoints become data flows.
Cloud Integration
When integrating with cloud storage or third-party APIs, DFDs clarify data residency. They help determine which data leaves the internal network and where it is stored.
Security Analysis
DFDs are excellent for identifying security risks. By tracing data flows, teams can spot where sensitive data (like passwords) might be exposed or transmitted unencrypted.
Best Practices for Clarity ✅
To ensure your diagrams are effective, adhere to these stylistic recommendations.
- Consistency: Use the same notation style throughout the document.
- Color Coding: Use colors to distinguish between different types of flows (e.g., internal vs. external).
- White Space: Do not crowd the diagram. Use spacing to improve readability.
- Versioning: Keep track of diagram versions. Systems change, and diagrams must evolve with them.
- Review Sessions: Walk through diagrams with stakeholders. Ambiguities often surface during discussion.
Handling Complex Logic 🔀
Sometimes, logic is too complex for a standard DFD. Here is how to handle edge cases.
Conditional Flows
If data flow depends on a condition, represent this in the label. For example: “Valid Login” vs. “Invalid Login”. Do not use decision diamonds; keep them as processes.
Iterative Processes
For loops or repeated actions, use a process name that implies iteration, such as “Loop Validation”. Avoid drawing circular arrows unless necessary for clarity.
Parallel Processing
If multiple processes happen simultaneously, group them visually or use distinct sub-diagrams to avoid crossing lines.
The Role of the Analyst 🧐
The Data Flow Diagram is ultimately a communication tool. The analyst acts as the translator between business needs and technical reality.
- Listen First: Understand the business goal before drawing.
- Iterate: First drafts are rarely perfect. Expect revisions.
- Question Assumptions: If a data flow seems obvious, verify it. Assumptions lead to gaps.
- Document Assumptions: If a flow is implied but not shown, note it in the legend.
Future Trends in System Modeling 📈
As systems become more dynamic, static diagrams face challenges. However, the core concept of data flow remains relevant.
- Dynamic DFDs: Some modern tools allow for time-based flows, showing data movement over specific intervals.
- Automated Generation: Code analysis tools are beginning to generate DFDs from existing codebases for documentation purposes.
- Integration with DevOps: Diagrams are increasingly linked to deployment pipelines to visualize data dependencies in CI/CD.
Summary of Key Takeaways 📝
Data Flow Diagrams are indispensable for understanding system behavior. They provide a clear map of information movement, ensuring that no data is lost or created without cause.
- Use DFDs for requirements analysis, not implementation coding.
- Respect the four components: Entities, Processes, Stores, Flows.
- Follow the hierarchy: Context -> Level 0 -> Level 1.
- Avoid black holes and miracles to maintain logical consistency.
- Label everything clearly to prevent ambiguity.
By mastering the structure and rules of DFDs, engineers can build systems that are robust, maintainable, and aligned with business goals. The visual language of data flow remains a powerful asset in the software engineering toolkit, transcending specific technologies and methodologies.
Frequently Asked Questions ❓
Q: Can a process update a data store without an output flow?
A: No. A process must produce some output, even if it is a confirmation message. The update itself is an interaction with the store, but the process needs to return control or data.
Q: Should I include user interface screens?
A: No. UI elements are not data processes. They are interfaces for users to enter data into external entities or processes.
Q: How many levels should a DFD have?
A: Typically 2 or 3. More than 3 levels often indicates the system is too complex to model effectively in one diagram set.