Designing systems that manage data is a complex undertaking. As projects grow from small scripts to enterprise-grade platforms, the documentation that describes how information moves through the architecture must evolve. Data Flow Diagrams (DFDs) serve as the architectural blueprints for these systems. They map the movement of data between processes, data stores, and external entities. However, a diagram that works for a simple application often collapses under the weight of a large-scale project. Scaling DFDs requires a disciplined approach to hierarchy, decomposition, and maintenance. This guide explores the strategies necessary to keep data flow documentation clear, accurate, and useful as complexity increases.
The transition from a small scope to a large-scale environment introduces challenges that cannot be solved by simply adding more boxes and arrows. Without a structured methodology, diagrams become unreadable webs of connectivity. This leads to confusion among stakeholders, developers, and architects. To maintain clarity, teams must adopt specific patterns for organization. We will examine the mechanics of scaling, from the initial context level down to detailed process breakdowns. We will also address how to manage data stores and external boundaries without losing the forest for the trees.
Understanding the Hierarchy of DFDs 📚
The foundation of scaling lies in the hierarchical structure of the diagram itself. A single, flat diagram is rarely sufficient for large systems. Instead, a multi-level approach allows stakeholders to view the system at varying degrees of detail. This method is often referred to as the Level 0, Level 1, Level 2 structure. Each level serves a specific audience and purpose.
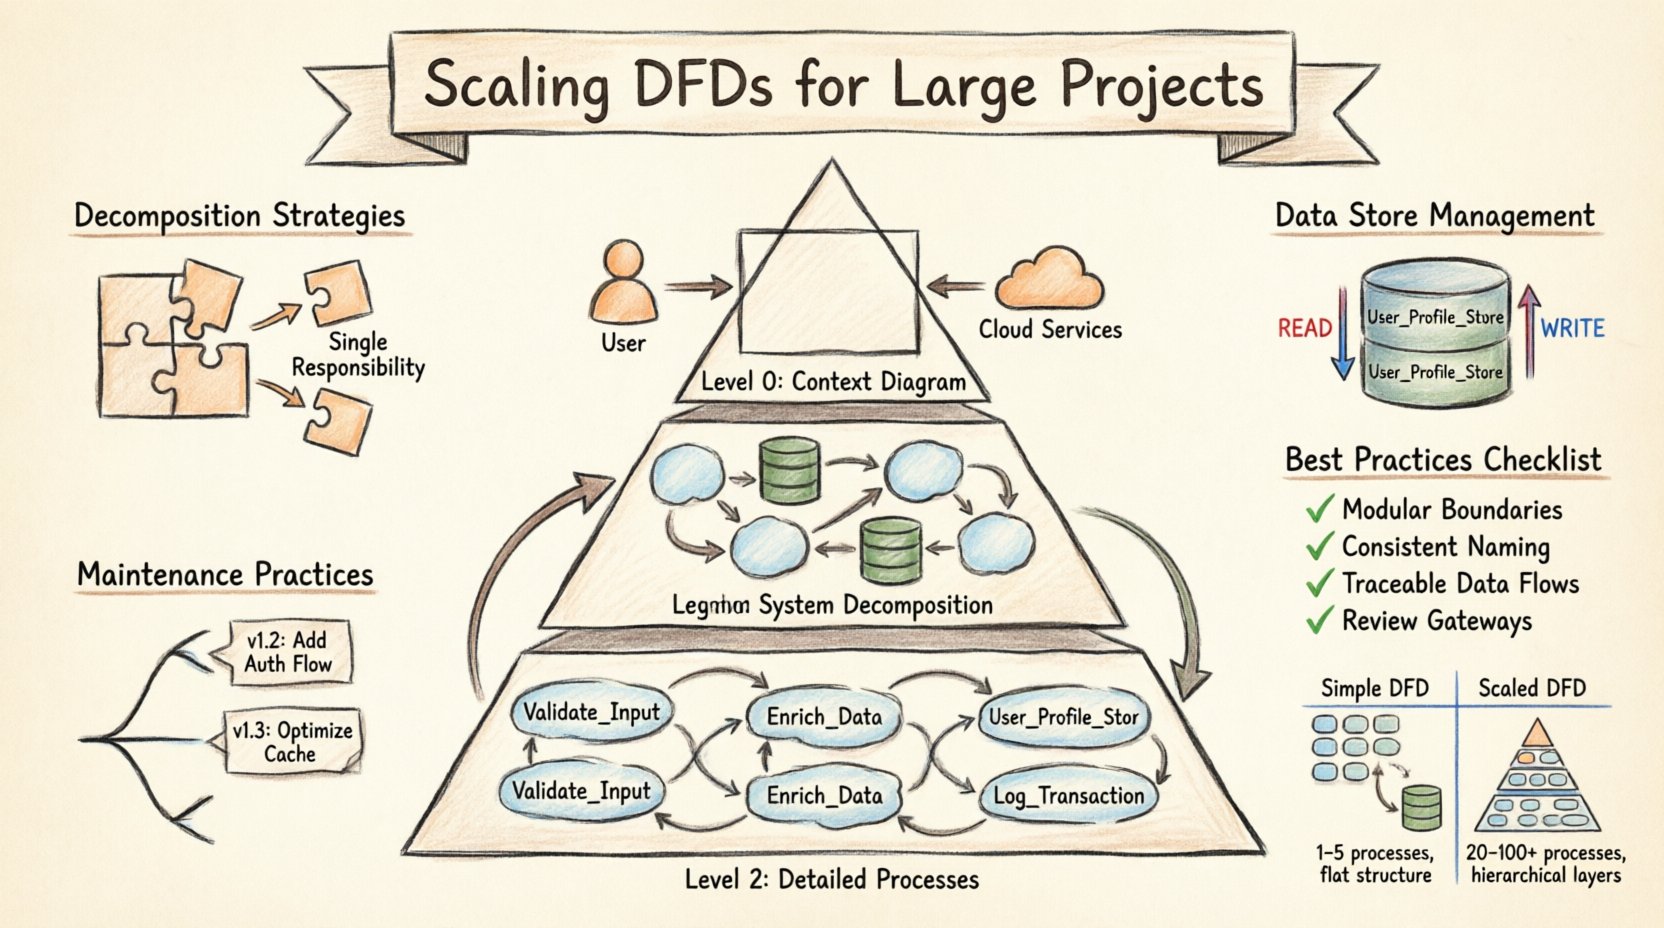
- Level 0 (Context Diagram): This is the highest level view. It shows the entire system as a single process. It connects the system to external entities, such as users, third-party services, or hardware. The goal here is to define the boundary of the system and the major inputs and outputs. It should not contain internal processes or data stores.
- Level 1 (System Decomposition): This level breaks the single process from Level 0 into major sub-processes. It introduces data stores and shows how data flows between major functional areas. This is where the core architecture becomes visible. It is typically used by system architects and senior developers.
- Level 2 (Detailed Processes): Each major process from Level 1 is expanded into a separate diagram. This level details the logic, specific data transformations, and interactions with data stores. It is used by implementers and testers who need to understand the specific mechanics of a function.
When scaling, the relationship between these levels must be maintained rigorously. Every input and output on a Level 0 diagram must be accounted for in Level 1. Every data flow leaving a Level 1 process must be explained in the corresponding Level 2 diagram. This consistency prevents information loss and ensures traceability. If a data flow appears in a lower-level diagram but not in a higher-level one, it indicates a discrepancy that must be resolved.
Decomposition Strategies for Complexity 🔨
Decomposition is the act of breaking down complex processes into smaller, manageable components. In large-scale projects, this is not just about simplification; it is about managing cognitive load. A process that handles too many distinct functions becomes a bottleneck in understanding. Effective decomposition follows specific rules to ensure the diagram remains useful.
- One Function per Process: Each process bubble or box should represent a single, distinct transformation of data. If a process handles both data validation and data storage, it should be split. This separation clarifies the responsibility of each component.
- Consistent Granularity: While levels vary in detail, the granularity within a single level should be consistent. If one process is highly detailed, neighboring processes should not be vague summaries. This balance prevents the diagram from becoming uneven and confusing.
- Logical Grouping: Group related processes together visually or by naming conventions. This helps the reader identify functional domains, such as “Authentication,” “Billing,” or “Reporting.” Logical grouping reduces the need to trace lines across the entire page.
- Avoiding Cross-Level Leakage: Do not introduce details in a higher-level diagram that belong in a lower level. Conversely, do not omit critical data stores in a Level 1 diagram that are essential for understanding the system’s state.
When scaling, it is common to encounter processes that do not fit neatly into a single category. In these cases, the process may need to be split into parallel streams or handled through a dedicated interface layer. The goal is to keep the flow linear and logical. If a process requires data from five different sources and sends results to three different destinations, it is likely too complex for a single box. Breaking it down into intermediate steps clarifies the sequence of operations.
Managing Data Stores at Scale 🗄️
Data stores represent the persistent state of the system. In small projects, a single database might serve the entire application. In large-scale projects, data is distributed across multiple systems, schemas, and services. Mapping these stores accurately on a DFD is critical for understanding data integrity and access patterns.
- Explicit Naming: Do not label a data store simply as “Database.” Use specific names like “User_Profile_Store” or “Transaction_Log.” This specificity helps developers identify which system holds which data.
- Read vs. Write Flows: Indicate where data is read versus where it is written. While DFDs traditionally show data flow without directionality, scaling requires clarity on state changes. Use distinct notations or legends to show if a process updates a store or merely queries it.
- Shared Data Stores: Large systems often share data stores between processes. Ensure that the diagram reflects which processes have access to which stores. This helps identify potential concurrency issues or security vulnerabilities.
- Data Store Relationships: If data flows from one store to another, show this explicitly. This might indicate a replication process, an ETL job, or a synchronization routine. These flows are often overlooked but are vital for system reliability.
As the number of data stores grows, the diagram can become cluttered. To mitigate this, consider using grouping techniques. Enclose related data stores within a boundary that represents a specific subsystem. This reduces the visual noise while maintaining the logical connection. However, be careful not to obscure the flow of data between these groups. The connections must remain visible to ensure the full picture is understood.
External Entity Boundaries 🌐
External entities represent the sources and destinations of data outside the system boundaries. These could be human users, other software systems, legacy mainframes, or regulatory bodies. In large-scale projects, the number of external entities can explode. Managing these boundaries is essential for defining the scope of the project.
- Define Clear Interfaces: Every connection between an external entity and a process represents an interface. Document the expected format and protocol for these interactions. This prevents ambiguity when integrating with third-party systems.
- Consolidate Similar Entities: If multiple users perform the same function, represent them as a single generic entity (e.g., “Customer”) with a note explaining the role variations. This reduces redundancy without losing functionality.
- Security Implications: External entities often represent security boundaries. Data flowing from an external entity to the system may require authentication or encryption. The DFD should ideally note these security requirements, either in the text or through a legend.
- Legacy Systems: Large projects often interact with legacy systems. These entities may have rigid data formats. Map these interactions carefully to ensure the new system can handle the data correctly without breaking existing workflows.
When scaling, it is tempting to ignore minor external entities. However, even small inputs can have significant downstream effects. A change in how a minor entity sends data can ripple through the entire system. Therefore, all entities must be accounted for in the context diagram and traced through the decomposition levels.
Maintenance and Version Control 🔄
A DFD is a living document. In large-scale projects, requirements change frequently. Processes are added, data stores are merged, and external interfaces are deprecated. Without a robust maintenance strategy, the diagram becomes outdated quickly, leading to misalignment between the documentation and the code.
- Versioning: Assign version numbers to diagrams. This allows teams to track changes over time. If a bug is reported, you can reference the specific version of the diagram that was in place when the code was written.
- Change Logs: Maintain a separate log that describes what changed between versions. Include the date, the author, and the reason for the change. This provides context for future developers who may not remember why a decision was made.
- Review Cycles: Schedule regular reviews of the DFDs. These should coincide with major release cycles. During these reviews, verify that the diagrams match the current implementation. Update them immediately if discrepancies are found.
- Access Control: Ensure that only authorized personnel can modify the diagrams. Uncontrolled edits can lead to conflicts and confusion. Use a system that tracks who made changes and when.
Maintenance is often neglected in favor of development. However, outdated diagrams are more dangerous than no diagrams at all. They create a false sense of security. Teams may rely on documentation that does not reflect reality. By treating the DFD as code, subject to the same version control and review processes, teams can ensure accuracy.
Comparison: Scaled vs. Simple DFDs 📊
Understanding the differences between a simple DFD and a scaled DFD helps teams prepare for the transition. The table below outlines the key distinctions in structure, complexity, and management.
| Feature | Simple DFD | Scaled DFD |
|---|---|---|
| Number of Processes | 1 to 5 | 20 to 100+ |
| Levels | 1 (Flat) | 3 to 5 (Hierarchical) |
| Tools Used | Pen and Paper | Specialized Diagramming Software |
| Version Control | Manual | Automated Systems |
| Review Frequency | At Delivery | Per Sprint/Release |
| Data Store Detail | Generic | Specific and Named |
| External Entities | Minimal | Comprehensive and Categorized |
Best Practices for Documentation Quality ✅
To ensure the DFD remains a valuable asset, follow these best practices. These guidelines focus on clarity, consistency, and usability.
- Consistent Naming Conventions: Use a standard format for naming processes, data flows, and stores. For example, use “Verb-Noun” for processes (e.g., “Calculate Tax”). This makes the diagram readable and searchable.
- Minimize Line Crossings: Arrange the diagram to reduce the number of lines crossing each other. This improves visual flow and reduces the cognitive effort required to trace data paths.
- Use Legends and Keys: If using special symbols for security, data types, or external systems, provide a legend. Do not assume the reader knows the meaning of every symbol.
- Link to Specifications: Where possible, link the diagram to detailed requirement documents or code repositories. This provides a bridge between the high-level view and the implementation details.
- Keep it Current: Prioritize keeping the diagram accurate over making it look perfect. A slightly messy but accurate diagram is more useful than a polished but outdated one.
Integration with Other Documentation 📝
A DFD does not exist in isolation. It is part of a larger ecosystem of technical documentation. To maximize its value, it must integrate with other artifacts.
- Database Schema: The data stores in the DFD should map directly to the database schema. This ensures that the physical implementation matches the logical design.
- API Specifications: The flows between external entities and processes often correspond to API endpoints. Cross-referencing these documents helps validate the integration points.
- Security Policies: Data flows involving sensitive information should be cross-referenced with security policies. This ensures that encryption and access control requirements are met.
- Test Cases: Test cases should be derived from the data flows. Each flow represents a potential path for testing. This ensures comprehensive coverage of the system’s logic.
Common Pitfalls to Avoid ⚠️
Even with the best intentions, teams can make mistakes when scaling DFDs. Awareness of these pitfalls helps in avoiding common traps.
- Over-Engineering: Do not create a diagram that is too detailed for the level. A Level 1 diagram should not contain the logic of a Level 2 process. Keep the abstraction level appropriate.
- Ignoring Control Flows: While DFDs focus on data, control signals (like “Start,” “Stop,” “Error”) are often necessary in complex systems. Distinguish these from data flows clearly.
- Assuming Linearity: Systems are rarely linear. Loops, feedback mechanisms, and asynchronous events are common. Represent these accurately, even if they make the diagram harder to read.
- Lack of Standardization: If different team members draw diagrams in different styles, the overall documentation becomes fragmented. Establish a style guide early and enforce it.
Conclusion on Scalability 🏗️
Scaling Data Flow Diagrams is a necessary discipline for building robust, large-scale systems. It requires more than just drawing more boxes; it demands a structured approach to hierarchy, decomposition, and maintenance. By adhering to the strategies outlined in this guide, teams can create documentation that supports development without becoming a burden. The goal is clarity. When the diagram is clear, the system is easier to understand, maintain, and extend. This investment in documentation pays dividends in reduced errors and faster onboarding for new team members.
Remember that the diagram is a tool for communication, not just a technical artifact. It bridges the gap between business requirements and technical implementation. As the system grows, so must the documentation. Regular reviews and strict version control ensure that the DFD remains a reliable source of truth throughout the lifecycle of the project. With the right approach, scaling DFDs becomes a manageable task rather than a chaotic endeavor.