Data Flow Diagrams (DFDs) are foundational tools for systems analysts tasked with understanding, designing, and documenting complex information systems. They provide a visual representation of how data moves through a system, highlighting processes, data stores, and external interactions. This guide outlines the essential principles, symbols, and methodologies required to construct accurate and useful DFDs without relying on specific proprietary tools.
What is a Data Flow Diagram? 📊
A Data Flow Diagram is a graphical representation of the flow of data through an information system. Unlike flowcharts that focus on control flow and logic, DFDs focus on the transformation of data from input to output. They help analysts map out the functional requirements of a system by breaking it down into smaller, manageable parts.
DFDs do not show timing or decision logic in detail. Instead, they answer critical questions such as:
- Where does the data come from?
- What happens to the data inside the system?
- Where does the data go after processing?
- Where is the data stored?
By visualizing these elements, analysts can identify bottlenecks, redundant processes, and security vulnerabilities before coding begins. The notation used in DFDs typically follows the Yourdon and DeMarco standard, though variations exist.
Why Systems Analysts Need DFDs 💡
For a systems analyst, clarity is paramount. Stakeholders often struggle with technical jargon, but visual diagrams bridge the gap between business needs and technical implementation. DFDs serve several critical functions in the analysis phase:
- Communication: They act as a common language between business stakeholders and technical teams.
- Documentation: They provide a permanent record of system behavior for future maintenance.
- Analysis: They reveal missing processes or data stores that were overlooked in initial interviews.
- Validation: They help verify that the system meets the defined requirements.
| Benefit | Impact on Project |
|---|---|
| Requirement Validation | Reduces scope creep by confirming what is in and out of scope. |
| System Design | Guides database design and API architecture. |
| Training | Assists new team members in understanding system logic quickly. |
| Debugging | Helps trace data errors back to their source. |
Core Components and Symbols 🛠️
Understanding the building blocks of a DFD is essential for creating accurate diagrams. There are four primary elements used in standard DFD notation.
1. External Entities
External entities represent sources or destinations of data outside the system boundary. They are the users, other systems, or organizations that interact with the system. In diagrams, these are often depicted as rectangles or squares.
- Example: Customer, Bank, Inventory System.
- Note: Do not include internal users or departments as external entities if they are part of the system being modeled.
2. Processes
Processes transform data from input to output. They represent functions or actions performed by the system. In DFDs, processes are usually drawn as circles or rounded rectangles. Each process must have at least one input and one output.
- Example: Calculate Tax, Validate User, Generate Report.
- Note: Avoid naming processes with data terms (e.g., “Store Data”). Use action verbs instead.
3. Data Stores
Data stores represent where data is held within the system for later use. They do not imply a specific technology (like a SQL database or Excel sheet), but rather the logical location of data. These are typically drawn as open-ended rectangles or parallel lines.
- Example: Customer Database, Order History, File Repository.
- Note: Data flows into and out of stores, but external entities cannot connect directly to data stores.
4. Data Flows
Data flows show the movement of data between entities, processes, and stores. They are represented by arrows. The label on the arrow describes the data packet being moved, not the action taken.
- Example: Invoice, Payment Details, User Credentials.
- Note: Arrows must be unidirectional. If data moves both ways, use two separate arrows.
| Element | Shape | Function |
|---|---|---|
| External Entity | Rectangle | Source or destination of data outside the system |
| Process | Circle / Rounded Rect | Transforms data |
| Data Store | Open Rectangle | Stores data for future use |
| Data Flow | Arrow | Shows direction of data movement |
Levels of DFDs 📉
DFDs are hierarchical. You start with a high-level overview and progressively break down the processes into more detailed sub-processes. This technique is known as decomposition.
Level 0: Context Diagram
The Context Diagram is the highest level of abstraction. It shows the system as a single process (usually a large circle) and all external entities interacting with it. It defines the boundaries of the system.
- One Process: The entire system is represented by one bubble.
- Inputs/Outputs: Shows major data flows entering and leaving the system.
- No Data Stores: Context diagrams typically do not show internal data stores.
Level 1: Functional Breakdown
The Level 1 DFD explodes the single process from the Context Diagram into major sub-processes. This level reveals the primary functions of the system without getting bogged down in minute details.
- Major Processes: Typically 5 to 9 processes to maintain readability.
- Data Stores: Internal repositories are introduced here.
- Consistency: Inputs and outputs must match the Context Diagram.
Level 2: Detailed Breakdown
Level 2 DFDs take specific processes from Level 1 and decompose them further. This is used for complex functions that require more granularity.
- Focus: Only specific processes are broken down; others remain as Level 1 bubbles.
- Detail: Shows specific data transformations and intermediate stores.
Creating a DFD: Step-by-Step Guide 📝
Constructing a DFD requires a structured approach to ensure accuracy and consistency. Follow these steps to build a robust diagram.
Step 1: Define the System Boundary
Identify what is inside the system and what is outside. This determines which entities are external and which are internal. Everything outside the boundary is an External Entity.
Step 2: Identify External Entities
List all people, departments, or systems that interact with your system. Give each entity a unique name. Avoid vague names like “User”; use specific roles like “Admin” or “Guest”.
Step 3: Map Major Data Flows
Draw arrows connecting entities to the system. Label these flows with the data being transferred (e.g., “Login Request”, “Sales Report”). Ensure every entity has at least one connection.
Step 4: Define Core Processes
Break the system down into logical functions. Name each process using a verb-noun format (e.g., “Process Order”). Ensure every process has inputs and outputs.
Step 5: Add Data Stores
Identify where data must be saved. Connect processes to data stores to show reading and writing operations. Remember, data flows can go from Process to Store or Store to Process.
Step 6: Review and Balance
Check that inputs and outputs match between parent and child diagrams. This is known as “balancing.” If a Level 1 process has an input “Customer Data,” the child diagram must also receive “Customer Data”.
Validation Rules and Best Practices ✅
To ensure your DFDs are technically sound and useful, adhere to these validation rules.
- No Ghost Flows: Every data flow must be connected to a process or store. Do not leave arrows floating.
- Black Holes: A process cannot have outputs without inputs. If data goes in, something must happen to it.
- Miracles: A process cannot have inputs without outputs. Every transformation must produce a result.
- Data Store Naming: Use plural nouns for data stores (e.g., “Orders”) and singular nouns for data flows (e.g., “Order”).
- Process Naming: Use active verbs. Avoid naming processes by the data they handle (e.g., use “Validate Password” instead of “Password”).
- Consistency: Ensure the same data flows are labeled identically across different levels of the diagram.
- Complexity Control: If a bubble is too crowded, decompose it. Aim for 5 to 9 processes per diagram.
Common Pitfalls to Avoid ⚠️
Even experienced analysts make mistakes. Being aware of common errors can save time during review sessions.
- Confusing Control with Data: DFDs show data, not control flow. Do not show decision diamonds or loops (unless representing data storage).
- Direct Entity-to-Store Connections: External entities cannot write directly to data stores. All data must pass through a process first.
- Over-Technical Detail: Do not show database tables or file names. Keep it logical, not physical.
- Missing Feedback Loops: If a process requires input from a previous output, ensure the flow is represented correctly.
- Inconsistent Naming: Avoid using synonyms for the same data (e.g., “Customer” vs “Client”). Stick to one terminology.
Logical vs. Physical DFDs 🔄
Analysts often create two types of diagrams for the same system. Understanding the difference is crucial for effective communication.
| Feature | Logical DFD | Physical DFD |
|---|---|---|
| Focus | Business requirements and rules. | Implementation details and technology. |
| Process Names | Generic actions (e.g., “Calculate Price”). | Specific actions (e.g., “Run Tax Algorithm V2”). |
| Data Stores | Logical containers (e.g., “Inventory”). | Physical files or tables (e.g., “SQL Table INV”). |
| Timing | Does not show timing or frequency. | May show batch processing or real-time triggers. |
| Use Case | Requirement gathering and design. | System architecture and development. |
Distinguishing DFDs from Other Diagrams 📐
It is easy to confuse DFDs with other modeling tools. Here is how they differ.
- DFD vs Flowchart: Flowcharts show the logic flow (if/else, loops). DFDs show data movement. A flowchart answers “What happens next?” A DFD answers “Where does the data go?”
- DFD vs ERD: Entity Relationship Diagrams focus on data structure and relationships between entities. DFDs focus on the movement and transformation of that data.
- DFD vs Use Case Diagram: Use Case diagrams show user interactions and goals. DFDs show the internal mechanics supporting those goals.
Maintaining and Updating DFDs 🔄
A DFD is not a one-time deliverable. Systems evolve, and the diagrams must evolve with them. Regular maintenance ensures the documentation remains accurate.
- Version Control: Keep track of changes. Label diagrams with version numbers or dates.
- Change Requests: When a new feature is added, update the DFD before coding begins.
- Review Cycles: Schedule periodic reviews with stakeholders to verify the diagram matches current operations.
- Integration: Ensure DFDs align with other artifacts like requirement specifications and database schemas.
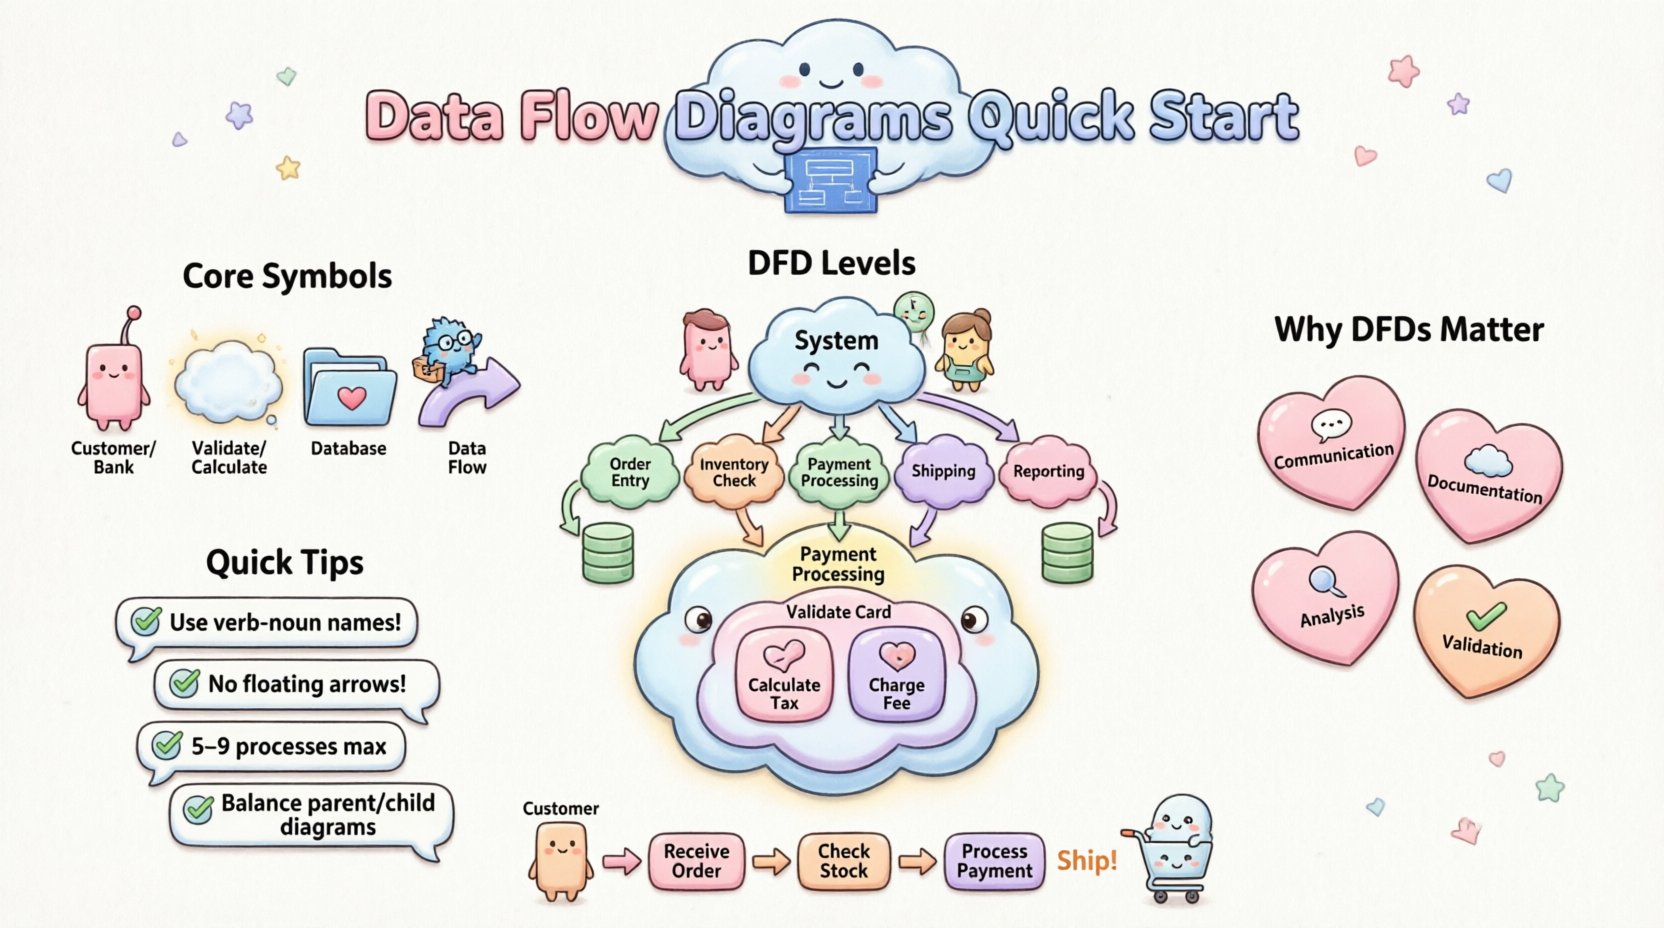
Practical Example: E-Commerce Order System 🛒
To illustrate the concepts, consider an online store. The Context Diagram would show the “Customer” and “Payment Gateway” as external entities.
In the Level 1 DFD, the system process “Order Management” splits into:
- Process: “Receive Order”
- Process: “Validate Inventory”
- Process: “Process Payment”
- Process: “Ship Goods”
Data flows include “Order Details,” “Stock Check,” and “Confirmation.” Data stores would include “Product Catalog” and “Transaction Log.” This breakdown ensures every step of the customer journey is accounted for.
Final Thoughts on DFD Mastery 🎯
Creating effective Data Flow Diagrams requires patience and attention to detail. It is a skill that improves with practice. By focusing on data movement rather than logic, you provide a clear map for developers and stakeholders alike. Remember that the goal is clarity, not complexity. Keep diagrams simple, consistent, and aligned with business reality.
As you continue your work as a systems analyst, use DFDs to uncover hidden requirements and streamline system design. They remain one of the most reliable tools for visualizing the flow of information in complex environments.