Bridge the gap between technical complexity and business strategy with precision. Architecting systems is not merely about writing code or selecting databases; it is about designing the future state of an organization’s capabilities. Yet, a frequent challenge arises when technical teams attempt to communicate these designs to non-technical stakeholders. Executive leadership requires clarity, risk assessment, and alignment with strategic goals, not a deep dive into API endpoints or database schemas.
The Context Map, a core component of the C4 Model, serves as the perfect instrument for this translation. It visualizes the high-level landscape of software systems and their relationships, providing a shared language for discussion. By leveraging this visual approach, architects can demonstrate how technical decisions directly impact revenue, operational efficiency, and market responsiveness. This guide details a structured approach to presenting these decisions effectively.
🧭 Understanding the Context Map within the C4 Model
The C4 Model provides a hierarchy of diagrams to explain software architecture. The top level is the Context Diagram, which shows the system in question and the people and other systems it interacts with. The Context Map extends this by mapping out multiple systems and the relationships between them within a broader enterprise landscape.
For executive audiences, the Context Map is critical because it shifts the focus from internal implementation to external interaction and business value. It answers the question: Where do we fit in the ecosystem, and how do we interact with the world?
Key Components of a Context Map
- System Scope: Clearly define the boundaries of the system being discussed. What is inside the box, and what is outside?
- External Systems: Identify third-party services, legacy applications, or partner platforms that the system depends on or integrates with.
- Relationships: Use arrows to indicate the flow of data and the direction of dependency. Label these connections with business terms (e.g., “Orders”, “Customer Data”) rather than technical protocol names (e.g., “REST API”).
- Technology Layers: While high-level, indicate critical technology choices if they represent a strategic shift, such as moving from on-premise to cloud-native infrastructure.
🤝 Why Executives Need Context, Not Code
Executive leadership operates on a different frequency than engineering teams. Their primary concerns revolve around risk, cost, scalability, and time-to-market. When an architect presents a decision, the executive is asking, “How does this affect the bottom line?”
A Context Map aligns technical decisions with business outcomes by visualizing dependencies. If a decision impacts a critical external dependency, the map highlights that risk immediately. This transparency builds trust.
Strategic Alignment Benefits
- Risk Identification: Dependencies on a single vendor or legacy system become visible red flags.
- Cost Visibility: Interactions with external systems often incur licensing or data transfer costs. Mapping these clarifies the financial footprint.
- Scalability Planning: The map shows where bottlenecks might occur when traffic increases across connected systems.
- Compliance & Governance: It highlights where data crosses regulatory boundaries, such as moving personal data across jurisdictions.
📊 Aligning Technical Decisions with Business Goals
Before presenting the map, you must align the technical narrative with the strategic objectives of the organization. A decision is not just a technical choice; it is a business commitment.
Consider the following criteria when framing your decisions:
| Business Goal | Architectural Implication | Context Map Element |
|---|---|---|
| Speed to Market | Use existing platforms vs. building from scratch | Dependency on third-party SaaS |
| Cost Reduction | Optimize resource usage or consolidate services | Consolidation of legacy connections |
| Reliability | Redundancy and failover mechanisms | Multiple connection paths to critical systems |
| Innovation | Integration with new AI or data tools | New integration points with external partners |
When you present the Context Map, point to specific elements that address these goals. If you are reducing cost, highlight where you are removing a redundant connection. If you are improving reliability, show the new redundant paths. This makes the abstract concrete.
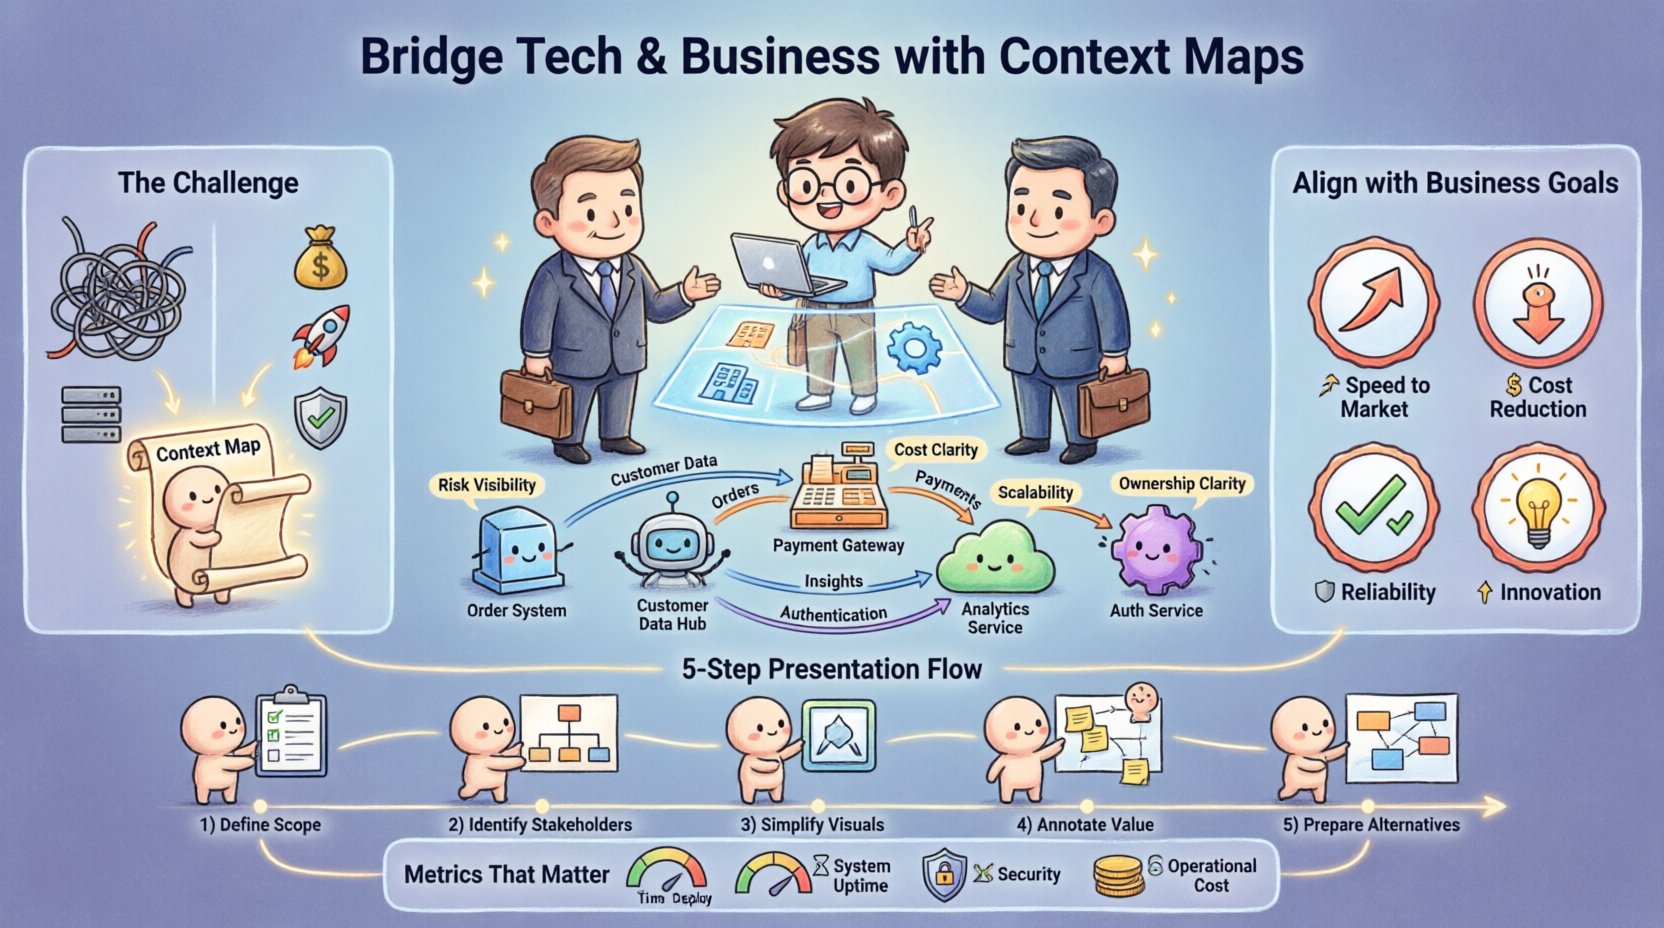
🛠️ Step-by-Step: Preparing Your Context Map Presentation
Preparation is the foundation of a successful presentation. Rushing into a meeting without a refined visual aid often leads to confusion and rejection of the proposal. Follow this workflow to ensure your Context Map is executive-ready.
1. Define the Scope Clearly
Start by writing a one-sentence summary of what the system does. Avoid jargon. Use phrases like “Order Processing” instead of “Event-Driven Microservice Cluster”. This sets the stage for the visual aid.
2. Identify Key Stakeholders
Who relies on this system? Marketing? Sales? Logistics? Include these external systems on the map. This demonstrates that you understand the broader business ecosystem. It shows you are thinking about the impact on other departments.
3. Simplify the Visuals
Executives do not need to see every database table or internal service. Filter the map to show only what is necessary for the decision at hand. If you are discussing a new payment gateway, highlight the payment system and its connections. Hide the internal logging service unless it impacts compliance.
4. Annotate with Business Value
Do not rely on the map alone. Add annotations or callouts that explain the why. For example, next to a connection to a legacy system, add a note: “High maintenance cost, risk of downtime”. This guides the viewer to the conclusion you want them to reach.
5. Prepare Alternative Scenarios
Leadership often prefers options. Prepare a second version of the Context Map that shows an alternative approach. Compare the trade-offs side-by-side. This shows you have considered the landscape thoroughly and are not pushing a single, biased solution.
🗣️ Delivering the Message: Narrative Over Syntax
Once the map is ready, the delivery is paramount. The presentation should be a story, not a lecture. Structure your narrative to lead the audience from the current state to the proposed future state.
The Story Arc
- The Current State: Show the existing Context Map. Explain the pain points. Is the system too fragile? Is it too expensive? Is it blocking new features?
- The Problem: Articulate the risk. If we do nothing, what happens? Use the map to show where the fragility lies.
- The Solution: Present the new Context Map. Highlight the changes. Explain how these changes mitigate the risks identified in the previous step.
- The Impact: Quantify the benefit. Reduced downtime, faster feature delivery, lower licensing fees.
Language Choices
Choose your words carefully. Avoid technical acronyms unless they are universally understood in the room. Instead of “We are refactoring the API gateway”, say “We are strengthening the entry point for all customer traffic to ensure reliability”. This translates technical debt into business risk.
Use the map as a pointer. Do not read the map. Say, “As you can see here, our current reliance on this legacy system creates a bottleneck”. Let the visual support your spoken word, not replace it.
🛑 Handling Difficult Questions & Trade-offs
Executive leadership will challenge your decisions. They are not trying to be difficult; they are trying to ensure the organization is safe. Expect questions about cost, timeline, and risk.
Common Challenges
- “Why is this so expensive?”: Explain the value. If you are moving to a new cloud architecture, explain the long-term savings on maintenance or the speed gained in feature delivery. Use the Context Map to show how the new architecture reduces friction with other systems.
- “Can we wait until next quarter?”: Explain the cost of delay. If a security vulnerability exists in a dependency, the map can show how that dependency exposes the entire system. Frame delay as increased risk.
- “Why not just keep it as is?”: Highlight the technical debt. Show the map where multiple systems are tightly coupled, making changes difficult and risky. Explain that the status quo is becoming a liability.
The Art of the Trade-off
There is no perfect solution. Every architectural decision involves a trade-off. Be honest about this. If you choose speed over cost, state it clearly. If you choose security over flexibility, explain why security is the priority for this specific decision.
Presenting trade-offs honestly builds credibility. It shows you are an objective advisor, not just a technical advocate. It allows leadership to make an informed decision based on the risks they are willing to accept.
📝 Keeping the Momentum: Post-Meeting Follow-up
The presentation does not end when the meeting adjourns. Follow-up ensures that the decisions made are recorded and executed. It also provides a reference point for future discussions.
Documentation Best Practices
- Record the Decision: Create a brief summary of what was approved. Include the date, the decision makers, and the key rationale.
- Save the Visuals: Ensure the Context Map is saved in a central location accessible to the team. Update it as the system evolves.
- Define Next Steps: List the immediate actions required. Who is responsible for what? What is the timeline?
- Share with the Team: Ensure the engineering team understands the business context of the decision. This helps them prioritize their work correctly.
Review Cadence
Architecture is not a one-time event. Set a cadence for reviewing the Context Map. Quarterly reviews are often sufficient for stable systems, while high-growth systems may need monthly reviews. This ensures the map remains accurate and relevant.
🚫 Common Pitfalls to Avoid
Even with a solid plan, mistakes can happen. Be aware of these common errors to ensure your presentation remains effective.
1. Overloading the Slide
Do not try to show every system in the enterprise on one slide. It will be unreadable. Focus on the specific context relevant to the decision. If you need to show the broader picture, use a high-level overview and then drill down into details on a second slide.
2. Ignoring the Audience
Do not use the same presentation for a technical team and a board of directors. The board needs high-level strategy. The technical team needs implementation details. Tailor the Context Map to the audience. For executives, focus on connections and dependencies. For engineers, focus on protocols and data flow.
3. Hiding the Risks
Do not gloss over the downsides of a decision. If a new technology is unproven, admit it. If a migration will take a long time, admit it. Hiding risks destroys trust when they inevitably surface later.
4. Focusing on Tools
Do not talk about the software you used to draw the map. The tool does not matter. The message matters. Do not say, “We used this tool to generate the diagram”. Say, “This diagram represents the new integration strategy”.
📈 Metrics That Matter
To truly demonstrate the value of your architecture, link it to metrics that leadership understands. A Context Map can help identify which metrics are most relevant.
| Metric | Architectural Driver | Context Map Indicator |
|---|---|---|
| Time to Deploy | Decoupling services | Reduced dependencies between systems |
| System Uptime | Redundancy | Multiple paths to critical external systems |
| Security Incidents | Data encryption & access control | Clear data flow boundaries and encryption points |
| Operational Cost | Resource optimization | Consolidation of redundant connections |
When you present the decision, cite these metrics. “By reducing the dependencies shown here, we expect to reduce deployment time by 20%”. This quantifies the architectural effort in business terms.
🎯 Final Thoughts on Strategic Communication
Presenting architecture decisions is a skill that combines technical knowledge with business acumen. The Context Map is the bridge. It transforms complex technical structures into understandable business landscapes.
By focusing on the relationships between systems, the risks involved, and the value delivered, you empower leadership to make informed decisions. You move the conversation from “Can we build it?” to “Should we build it, and what is the impact?”.
Remember, the goal is not to impress the audience with technical prowess. The goal is to enable the business to move forward with confidence. Use the Context Map to clarify the path, highlight the obstacles, and celebrate the opportunities. This approach fosters a culture where technology and business are aligned partners.
Start by reviewing your current architecture. Simplify the view. Tell the story. Listen to the feedback. Iterate. This cycle ensures that your architecture remains relevant and that your communication remains effective. The map is not the territory, but it is the best guide we have for navigating the landscape of modern software systems.