Designing distributed systems requires clarity. When architecture relies on asynchronous communication, visualizing the flow of data becomes complex. The C4 Model offers a structured approach to software architecture documentation. However, standard C4 diagrams often struggle to represent the nuances of Event-Driven Architecture (EDA). This guide explores how to adapt C4 relationship lines to accurately depict event flows, producers, and consumers without ambiguity. We will focus on semantic precision, ensuring that stakeholders can understand the system behavior at a glance.
Why Standard C4 Needs Adaptation for EDA 🤔
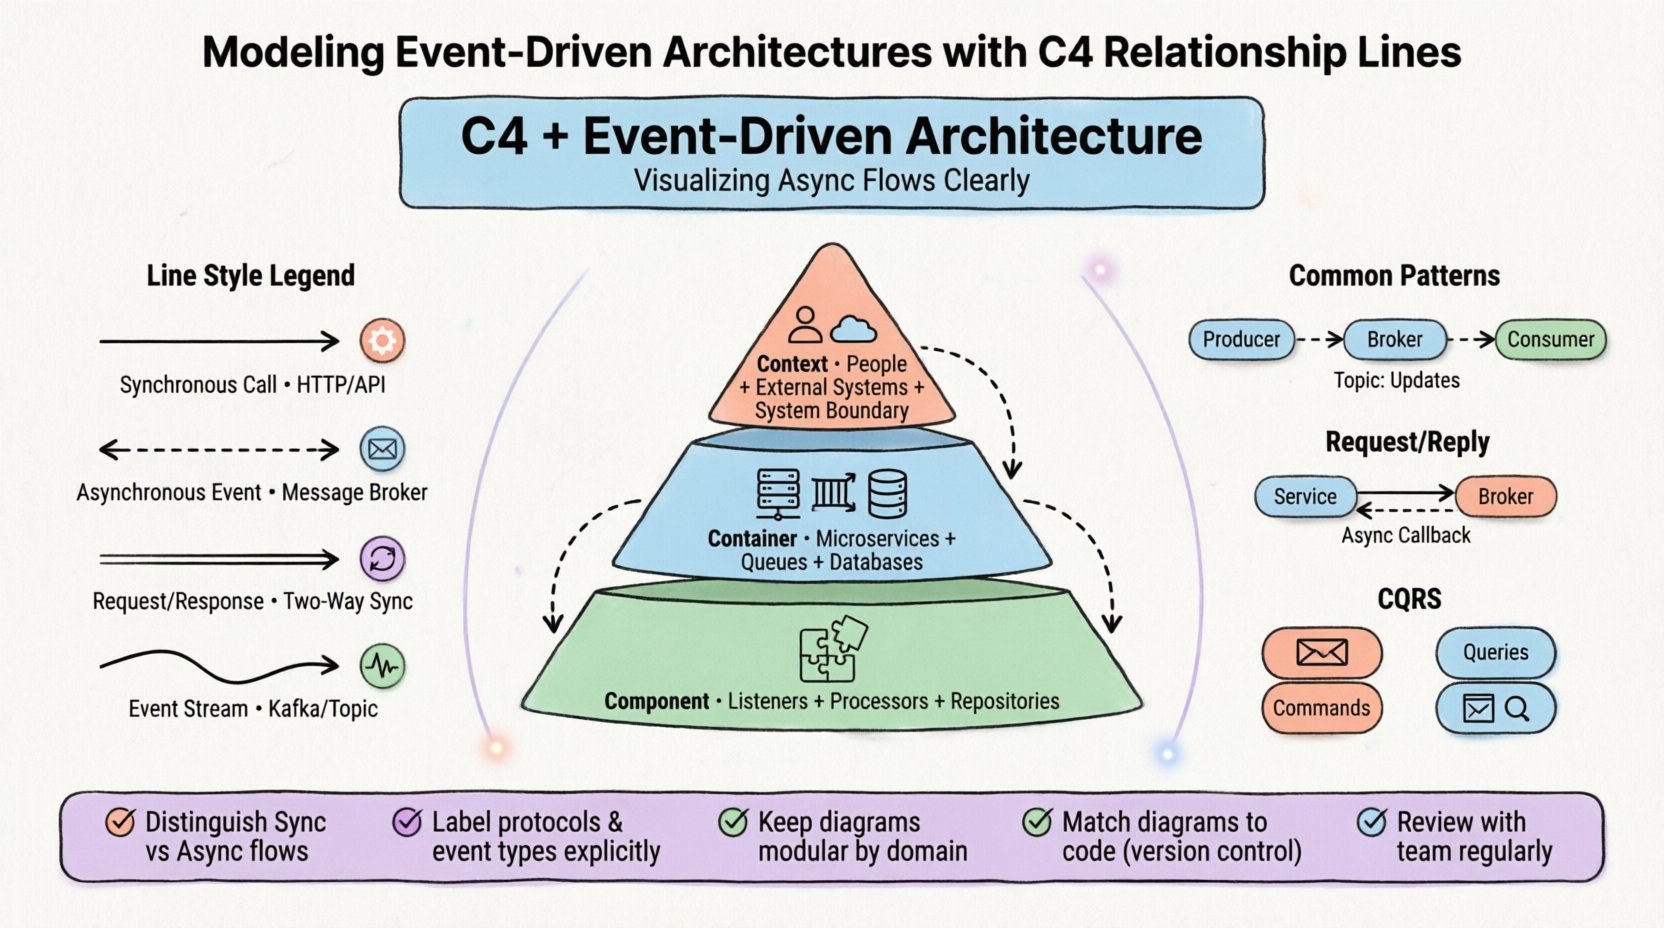
Traditional C4 diagrams excel at showing data movement between containers using solid lines. In a synchronous request-response pattern, this is intuitive. A request goes in, and a response comes out. Event-Driven Architecture introduces a layer of indirection. A producer emits an event, and one or more consumers process it later. The connection is often loose, and the timing is decoupled.
- Synchronous Flows: Direct calls where the caller waits for a result.
- Asynchronous Flows: Fire-and-forget events where the producer does not wait.
- Push vs. Pull: Does the service send data, or does it fetch it?
Using a standard solid line for an event stream can mislead readers into thinking the connection is synchronous. This creates confusion during troubleshooting or onboarding. To resolve this, we must modify the visual language of the relationship lines.
Understanding the C4 Levels in an Event Context 🏗️
Before drawing lines, we must understand the boxes they connect. Each level of the C4 Model serves a different audience and abstraction layer.
1. Context Level: The Big Picture 🌍
At the highest level, you define the system boundary. In an event-driven system, the System is often a collection of services reacting to external stimuli.
- People: Users triggering actions (e.g., clicking a button).
- External Systems: Third-party APIs or legacy systems feeding data in.
- The System: The aggregate of all event producers and consumers.
Relationship lines here should focus on integration points. If a human clicks a button, that is a request. If a payment gateway sends a webhook, that is an event. Distinguishing these at the context level prevents confusion about what triggers the system.
2. Container Level: Services and Streams 💻
This is where the magic happens. Containers represent deployable units (applications, databases, queues). In EDA, this level must show how services talk to message brokers or other services.
- Application Containers: Microservices handling business logic.
- Data Containers: Databases or event stores.
- Queue/Topic Containers: Message brokers acting as intermediaries.
Relationship lines here are critical. They represent the Event Channels. A solid line implies a direct API call. A dashed line implies an event subscription. This distinction is vital for developers understanding latency and reliability.
3. Component Level: Internal Logic 🧩
Inside a container, components handle specific responsibilities. In EDA, components often include event listeners, handlers, and transformers.
- Event Listeners: Components that wait for incoming messages.
- Processors: Components that transform event data.
- Repositories: Components that persist state changes.
Relationship lines at this level show data flow within the service. They help developers trace how an event transforms into a database update.
Semantics of Relationship Lines in EDA 📏
The most common source of error in architecture diagrams is ambiguous line styles. In the C4 Model, lines typically represent data flow. In EDA, we need to differentiate between control flow and data flow, and between sync and async.
Defining Line Styles
| Line Style | Meaning | Use Case |
|---|---|---|
| Solid Line | Synchronous Call | API Request / HTTP Call |
| Dashed Line | Asynchronous Event | Message Broker Subscription |
| Double Line | Two-Way Sync | Request / Response Pattern |
| Curved Line | Event Stream | Kafka / Topic Subscription |
Labeling Relationships
Labels on lines provide context. A generic “Data” label is insufficient. Be specific about the Protocol and the Direction.
- HTTP POST: Indicates a synchronous push.
- WebSocket: Indicates a persistent connection.
- Event: OrderCreated: Specifies the event type.
- Topic: Orders: Specifies the logical channel.
When labeling, avoid vague terms. Instead of “Data Flow”, use “Order Events”. This reduces cognitive load for the reader.
Common Patterns and Their Diagrammatic Representation 🔄
Event-Driven Architectures follow specific patterns. Each pattern has a distinct visual representation in the C4 Model. Understanding these patterns helps in creating consistent documentation.
1. Pub/Sub (Publish-Subscribe)
In this pattern, a producer sends an event to a broker. Consumers subscribe to topics.
- Visual: Dashed lines from Producer to Broker. Dashed lines from Broker to Consumer.
- Label: “Topic: InventoryUpdates”.
- Meaning: The producer does not know which consumers exist.
2. Request/Reply over Events
One service sends an event and waits for a response event. This is often used for long-running operations.
- Visual: Solid line to Broker. Dashed line back from Broker.
- Label: “Request: CalculateTax” → “Response: TaxCalculation”.
- Meaning: Asynchronous communication with a callback.
3. Event Sourcing
State is derived from a sequence of events stored in an event store.
- Visual: Container connected to an Event Store container.
- Label: “Append Events”.
- Meaning: The source of truth is the log, not the current state.
4. CQRS (Command Query Responsibility Segregation)
Separation of write and read models. Commands update state; Queries read state.
- Visual: Two distinct paths. Write path (Command Handler) vs Read path (Read Model).
- Label: “Command: CreateOrder” vs “Query: GetOrderDetails”.
- Meaning: Optimized for different types of access.
Pitfalls and Anti-Patterns to Avoid ⚠️
Even with the right tools, mistakes happen. Common errors in C4 modeling for EDA can lead to architectural drift or misunderstanding.
- Over-Abstraction: Drawing too many connections at the Context level. Keep the Context level simple. Only show major integrations.
- Mixing Sync and Async: Using solid lines for async calls. This confuses developers about latency expectations.
- Missing Error Flows: Diagrams often show happy paths only. Include lines for error handling, retries, or dead-letter queues.
- Ignoring Data Consistency: Failing to show where data is stored. In EDA, eventual consistency is key. Show where the source of truth lies.
- Too Many Lines: A “spaghetti diagram” is useless. If a diagram has more than 20 relationships, consider breaking it down by domain.
Tooling and Maintenance Considerations 🛠️
Creating diagrams is only half the work. Maintaining them is crucial. If the diagram does not match the code, it becomes documentation debt.
Version Control
Store diagram files in the same repository as the code. This ensures that when a feature is added, the diagram is updated in the same commit.
Automation
Some tools allow generating diagrams from code annotations. This reduces the maintenance burden. However, manual review is still necessary to ensure semantic accuracy.
Collaboration
Diagrams are communication tools. They should be reviewed by architects, developers, and product managers. Feedback ensures that the visual language matches the team’s mental model.
Deep Dive: Component Level Relationships 🧱
The Component level often gets overlooked in EDA. It is where the event handling logic resides. Clear relationships here help developers understand internal coupling.
Event Handlers
An event handler is a component that listens for specific events. In the diagram, this is a box inside a container.
- Input: Incoming event data.
- Output: Database writes or new events.
- Relationship: Use a dashed line to show the trigger.
Domain Services
These components contain business logic. They are often triggered by event handlers.
- Input: Data from the event handler.
- Output: State changes or notifications.
- Relationship: Solid lines for internal method calls.
External Integrations
Sometimes a component calls an external API as part of event processing.
- Input: Event payload.
- Output: API Response.
- Relationship: Solid line with a label indicating the protocol (e.g., REST, GraphQL).
Designing for Future Evolution 🚀
Architectures change. New services are added, and old ones are retired. Your diagrams should support this evolution without requiring a complete redraw.
Modular Diagrams
Instead of one giant diagram, create a set of focused diagrams. One for the “Order Domain”, one for the “Payment Domain”. This keeps the relationship lines manageable.
Standardized Notation
Agree on a notation standard with the team. If one developer uses a dashed line for events and another uses a solid line, the documentation becomes unreadable. Define a style guide for relationship lines.
Documentation Lifecycle
Integrate diagram updates into the Definition of Done. If a code change introduces a new event, the diagram must be updated in the same pull request. This ensures the documentation remains a source of truth.
Final Considerations 📝
Modeling Event-Driven Architectures with the C4 Model requires attention to detail. Standard relationships are not enough. You must explicitly define the nature of the flow using line styles and labels. This clarity reduces risk and improves team communication.
By adapting the C4 relationship lines, you create a visual language that speaks to the asynchronous nature of your system. This helps stakeholders understand latency, reliability, and data consistency. Focus on precision over aesthetics. A clear diagram is better than a pretty one.
Remember that diagrams are living documents. They evolve with the system. Regular reviews ensure that the visual representation remains accurate. This disciplined approach leads to better system design and easier maintenance.
Key Takeaways
- Distinguish Sync and Async: Use different line styles for different flows.
- Label Explicitly: Avoid generic terms like “Data”.
- Focus on the Domain: Break large systems into manageable diagrams.
- Maintain Consistency: Ensure the diagram matches the code.
- Involve the Team: Use diagrams as a communication tool, not just documentation.
Implementing these practices will result in a robust architecture documentation strategy. It supports the complexity of event-driven systems without overwhelming the reader. Clarity is the goal. Precision is the method.