Architectural design has always relied on visual representations to communicate complex systems. Among these, Data Flow Diagrams (DFDs) remain a cornerstone for understanding how information moves through a system. As technology evolves, the role of these diagrams shifts from static documentation to dynamic, living artifacts that guide development, security, and compliance. This guide explores the trajectory of DFDs within the context of contemporary system design.
Foundations of Data Flow Visualization 📊
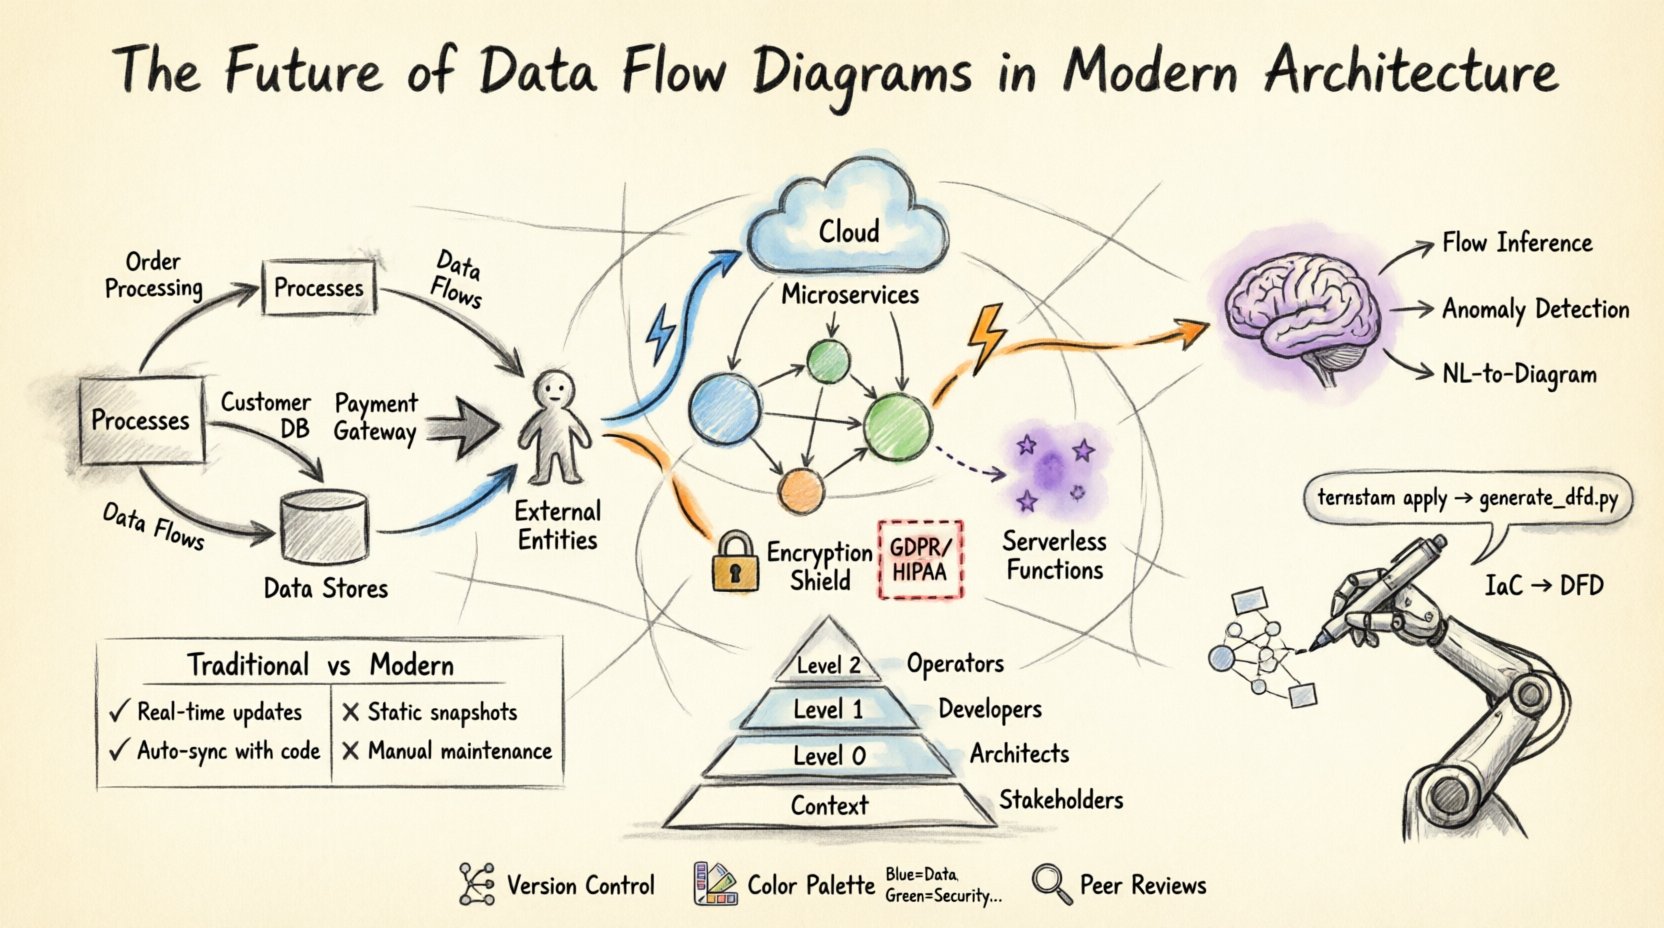
Before examining the future, it is necessary to understand the core mechanics. A Data Flow Diagram maps the movement of data between processes, data stores, and external entities. It does not control the timing of data or the logic of the process itself, but rather focuses on the flow. This distinction is vital for architects who need to separate logic from movement.
- Processes: Transformations that change input data into output data.
- Data Stores: Places where information is held for later use.
- External Entities: Sources or destinations of data outside the system boundary.
- Data Flows: The paths data takes between the other components.
In traditional systems, these diagrams were often created during the requirements phase and rarely updated after deployment. Today, the expectation is different. The diagrams must reflect the system as it exists in production, not just as it was planned. This shift requires a re-evaluation of how we create and maintain these visualizations.
The Shift to Distributed Systems 🌐
The move from monolithic architectures to distributed systems has complicated data visualization. In a monolith, data flows between modules within a single process space. In a distributed environment, data crosses network boundaries, passes through load balancers, queues, and API gateways.
Modern DFDs must account for:
- Service-to-Service Communication: Visualizing how microservices interact via REST, gRPC, or message brokers.
- Asynchronous Flows: Representing events that trigger processes rather than synchronous requests.
- Data Replication: Showing how data is copied across regions for redundancy and latency reduction.
- Third-Party Integrations: Mapping data exchanges with external vendors or partners.
When mapping these flows, architects must distinguish between synchronous calls and asynchronous events. A single diagram often fails to capture the full scope. Instead, a layered approach is necessary. A high-level context diagram shows the system boundary, while detailed sub-diagrams show the internal interactions of specific service clusters.
Cloud-Native Architectures and Serverless Functions ☁️
Cloud computing introduces ephemeral resources. Serverless functions execute only when triggered and terminate immediately after. Traditional DFDs struggle to represent this transient nature. However, the principles remain valid if adapted.
Key considerations for cloud-based DFDs include:
- Event-Driven Design: Flows are often triggered by state changes rather than user actions. Diagrams must show the event source, the trigger, and the resulting data persistence.
- Stateless Processing: Processes do not retain data. Data stores become critical nodes in the diagram.
- Managed Services: Databases, caching layers, and message queues are often managed services. These should be clearly labeled as external dependencies or internal stores depending on ownership.
- Region Awareness: Data sovereignty laws require tracking where data resides. DFDs should indicate geographic boundaries.
Visualizing serverless architectures often requires a shift from process-centric views to event-centric views. The diagram highlights the trigger (e.g., an uploaded file) and the downstream effects (e.g., database update, notification sent) rather than the code execution steps.
Security and Compliance Integration 🔒
Security is no longer an afterthought. It is integral to architecture. Data Flow Diagrams serve as critical tools for security audits. They reveal where sensitive data travels and where it is stored. This visibility is essential for compliance with regulations like GDPR, HIPAA, or CCPA.
Effective security-focused DFDs include:
- Encryption Points: Indicate where data is encrypted in transit and at rest.
- Authentication Zones: Show where user identity verification occurs before data access.
- Deletion Paths: Map how data is purged to meet right-to-be-forgotten requirements.
- Access Control Lists: Indicate which entities have read/write permissions on specific data stores.
By integrating security attributes into the diagram, architects can identify vulnerabilities early. For example, if a diagram shows sensitive data flowing through a non-encrypted channel to an external entity, it flags a risk before code is written. This proactive approach reduces the cost of fixing security issues later in the development lifecycle.
Automation and Infrastructure as Code 🤖
One of the biggest challenges with DFDs is maintaining them. When code changes, the diagram often becomes outdated. To solve this, the industry is moving toward automation. Infrastructure as Code (IaC) allows the definition of resources in text files. New approaches link these definitions directly to visualization.
Automated DFD generation offers several benefits:
- Single Source of Truth: The diagram is derived from the configuration, not manual drawing.
- Real-Time Updates: Changes in the code repository trigger updates to the diagram.
- Consistency: Human error in drawing connections is eliminated.
- Integration with CI/CD: Diagrams can be part of the deployment pipeline to ensure architecture compliance.
This automation does not replace human review. Architects still need to interpret the complexity and ensure the flow makes logical sense. However, the mechanical task of drawing boxes and arrows is handled by the system. This allows architects to focus on design decisions rather than documentation maintenance.
Artificial Intelligence and Dynamic Modeling 🧠
Artificial Intelligence (AI) is beginning to influence how diagrams are created and analyzed. AI models can parse logs and network traffic to suggest data flows. This is particularly useful for legacy systems where documentation is missing or inaccurate.
Potential AI applications include:
- Flow Inference: Analyzing packet capture data to reconstruct data paths.
- Anomaly Detection: Identifying unexpected flows that deviate from the standard architecture.
- Recommendation Engines: Suggesting optimizations based on flow bottlenecks.
- Natural Language to Diagram: Converting architectural requirements written in text into visual models.
This technology reduces the friction between development and documentation. If the system behavior is known, the diagram can be generated automatically. This shifts the focus from drawing to validating. The architect verifies the AI’s output against business requirements rather than manually connecting lines.
Best Practices for Modern DFDs ✅
To ensure diagrams remain useful, specific standards should be followed. Adhering to these practices ensures clarity and longevity.
- Limit Complexity: Keep diagrams at a manageable level. Use decomposition to break large systems into smaller, understandable parts.
- Consistent Naming: Use standard naming conventions for processes and data stores. Ambiguity leads to misinterpretation.
- Version Control: Treat diagrams as code. Store them in version control systems to track changes over time.
- Color Coding: Use color to denote security levels, ownership, or data sensitivity.
- Regular Reviews: Schedule periodic reviews to ensure the diagram matches the current system state.
Levels of Abstraction 📉
Not every stakeholder needs the same level of detail. A CTO needs a high-level view, while a developer needs granular details. A layered approach addresses this need.
| Level | Description | Target Audience |
|---|---|---|
| Context Diagram | Shows the system as a single process and its interaction with external entities. | Stakeholders, Management |
| Level 0 Diagram | Breaks the system into major sub-processes or functional areas. | System Architects, Product Managers |
| Level 1 Diagram | Details the internal logic of specific sub-processes. | Developers, QA Engineers |
| Level 2 Diagram | Drills down into specific data transformations or algorithms. | Specialized Engineers |
Using this hierarchy prevents information overload. It allows different teams to focus on the details relevant to their role without getting lost in the broader system context.
Challenges in Implementation ⚠️
Despite the benefits, implementing modern DFD practices comes with hurdles. Understanding these challenges helps teams plan accordingly.
- Dynamic Environments: In containerized environments, IP addresses and endpoints change frequently. Static diagrams may quickly become obsolete.
- Complexity of Microservices: Hundreds of services can make a single diagram unreadable. Aggregation and filtering are required.
- Tooling Limitations: Many diagramming tools are designed for static documentation, not dynamic integration.
- Cultural Resistance: Teams may view documentation as a burden rather than a value add. Leadership must emphasize the long-term benefits.
Comparing Traditional vs. Modern Approaches 🆚
Understanding the differences between legacy practices and modern requirements clarifies the path forward.
| Feature | Traditional DFD | Modern DFD |
|---|---|---|
| Creation Method | Manual drawing by hand or basic software. | Automated generation or hybrid model. |
| Lifecycle | Created once, rarely updated. | Continuous updates linked to code. |
| Focus | Functional decomposition. | Data movement and security context. |
| Integration | Isolated document. | Integrated with CI/CD and monitoring. |
| Scalability | Struggles with large systems. | Designed for distributed systems. |
Collaboration and Knowledge Sharing 🤝
DFDs are communication tools. They bridge the gap between business requirements and technical implementation. In modern teams, these diagrams facilitate collaboration across disciplines.
Effective collaboration involves:
- Shared Definitions: All teams agree on what a process or data store represents.
- Accessible Formats: Diagrams should be viewable by non-technical stakeholders.
- Interactive Models: Clicking a component should reveal more details or related documentation.
- Feedback Loops: Developers and testers should be able to suggest corrections to the diagram.
When everyone uses the same visual language, misunderstandings decrease. Onboarding new team members becomes faster because the architecture is documented visually. This reduces the reliance on tribal knowledge.
Future Trends in Data Modeling 🚀
Looking ahead, several trends will shape how Data Flow Diagrams are used.
- Real-Time Visualization: Diagrams that update as data flows through the system in real-time.
- Graph Database Integration: Using graph databases to store the architecture itself, allowing complex queries about data relationships.
- Immersive Experiences: Using VR or AR to explore system architecture in a 3D space.
- Semantic Web: Linking diagrams to knowledge graphs for better context and reasoning.
These trends suggest that the diagram is becoming less of a static image and more of an interactive interface. The boundary between the model and the system is blurring. This integration ensures that the documentation is always accurate.
Final Thoughts on Architecture Documentation 📝
Data Flow Diagrams are evolving from static drawings into dynamic components of the system infrastructure. As architectures become more distributed and automated, the need for clear, accurate, and up-to-date visualizations increases. By embracing automation, integrating security considerations, and adopting collaborative practices, organizations can ensure their diagrams remain valuable assets.
The future of DFDs lies in their ability to adapt. They must support the speed of modern development without sacrificing clarity. Architects who prioritize these diagrams as living documents will find themselves better equipped to manage complexity and drive innovation. The goal is not just to draw the system, but to understand it deeply enough to improve it continuously.