Systems analysis and design rely heavily on visual representation to communicate complex logic. Among the various tools available, the Data Flow Diagram (DFD) remains a cornerstone for mapping information movement. Despite its widespread use, significant confusion surrounds what a DFD actually represents and how it functions within the broader context of system modeling. This guide addresses the most persistent myths and misconceptions surrounding Data Flow Diagrams, providing clarity for analysts, developers, and stakeholders.
Understanding the true nature of DFDs is essential for creating accurate system documentation. When used correctly, they clarify data movement without getting bogged down in procedural logic. However, when misunderstood, they can lead to design flaws and communication breakdowns. We will explore the core components, common errors, and best practices to ensure your diagrams serve their intended purpose effectively. 🛠️
What Is a Data Flow Diagram? 🤔
A Data Flow Diagram is a graphical representation of the flow of data through an information system. Unlike other diagrams that focus on how a system works (control flow), a DFD focuses on what data is moving and where it goes. It decomposes a system into processes that transform input data into output data.
The primary goal is to visualize the system’s inputs and outputs, showing how data changes as it passes through various stages. This abstraction allows teams to focus on the substance of the system rather than the specific implementation details.
Core Components of a DFD
To create a valid diagram, one must understand the four fundamental elements:
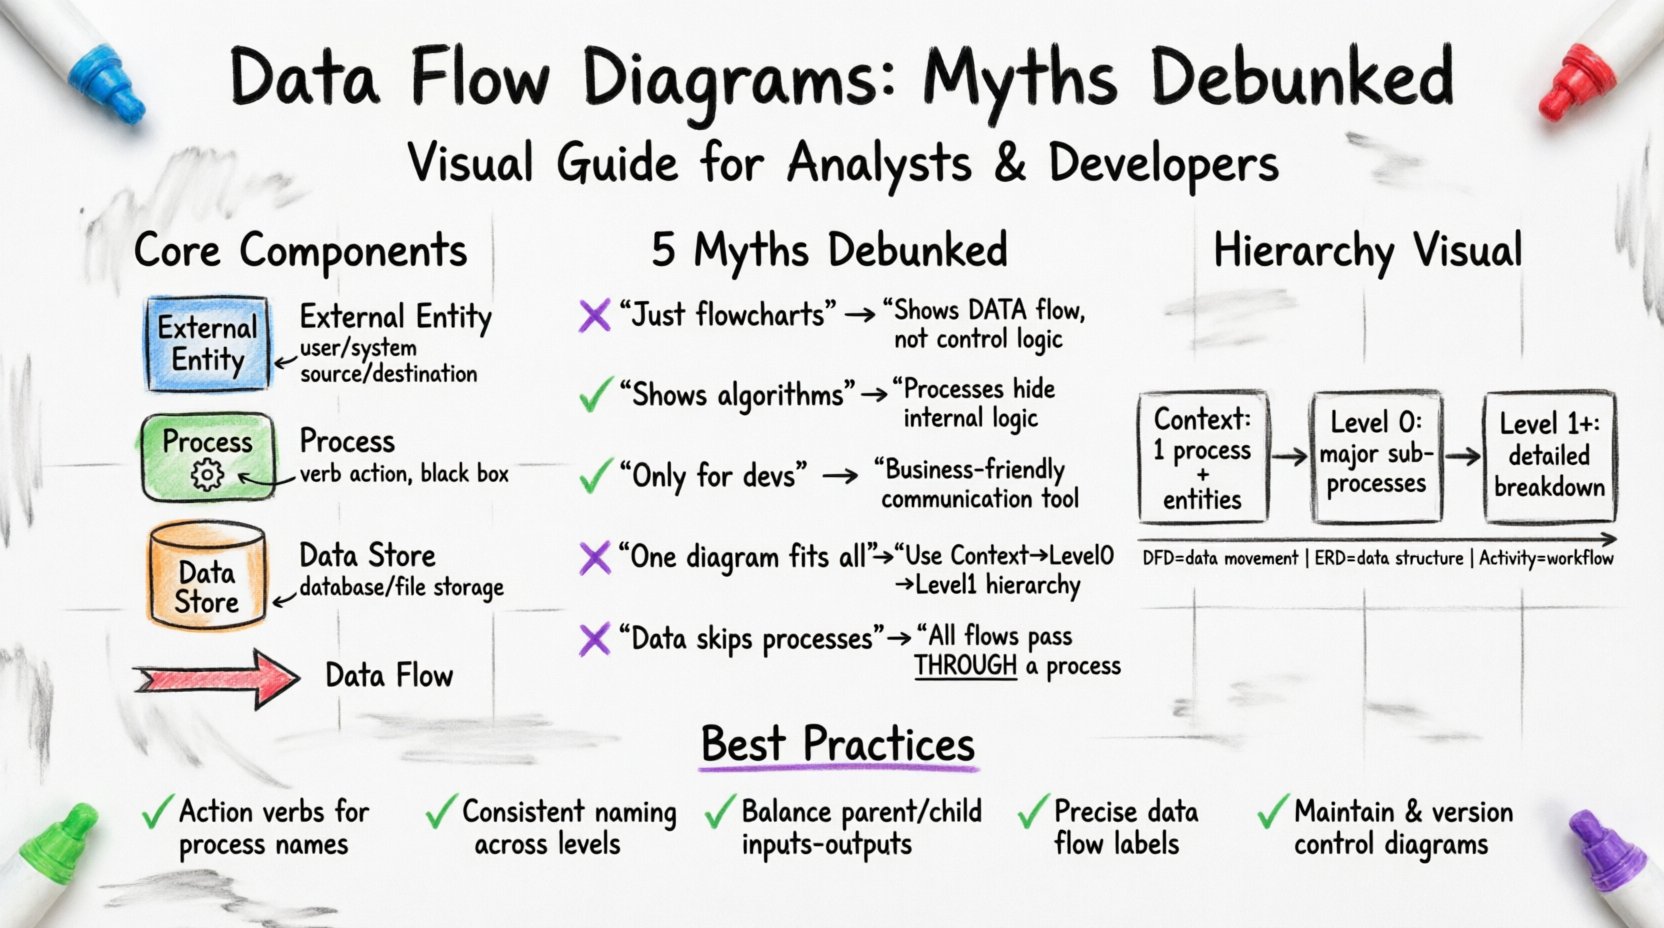
- External Entities: These represent sources or destinations of data outside the system boundary. They could be human users, other systems, or hardware devices. They are often depicted as squares or circles. 🖥️
- Processes: These are actions or transformations performed on the data. A process takes input data, changes it, and produces output data. They are usually shown as rounded rectangles or circles. ⚙️
- Data Stores: These represent places where data is held for later use, such as files, databases, or physical archives. They are not executed; they are passive storage. 🗄️
- Data Flows: These are the paths that data takes between entities, processes, and stores. They are represented by arrows indicating the direction of movement. 🏹
Each component serves a specific function. Confusing these elements leads to invalid diagrams that fail to communicate the system’s actual behavior.
Common Myths About Data Flow Diagrams 🚫
There is a lot of noise surrounding DFDs in the industry. Many professionals carry assumptions that hinder effective modeling. Below, we debunk the five most common misconceptions.
Myth 1: DFDs Are Just Fancy Flowcharts 📉
This is perhaps the most pervasive error. While both diagrams use arrows and shapes, their purpose differs significantly.
- Flowcharts describe control flow. They show the sequence of operations, decision points (yes/no branches), and loops. They answer the question: “What happens next?”
- Data Flow Diagrams describe data movement. They do not show loops or decision logic. They answer the question: “Where does the data go?”
If you draw a diamond shape for a decision, you are drawing a flowchart, not a DFD. In a DFD, a decision is simply a process that filters data. The path taken is not depicted; only the resulting data flow is shown. Mixing these concepts creates ambiguity about whether the diagram represents logic or data.
Myth 2: DFDs Show Logic and Algorithms 🧠
Analysts often try to cram too much detail into a DFD process bubble. They might write pseudo-code inside a process circle or describe complex algorithms. This violates the principle of abstraction.
A process in a DFD is a “black box.” It transforms input to output, but the internal mechanics are hidden. If you need to explain the logic, use a structured English description or a separate algorithmic flowchart. The DFD’s job is to show the relationship between processes, not the internal code.
- Incorrect: Writing “If balance > 0, deduct fee” inside a process box.
- Correct: Labeling the process “Calculate Fee” and showing the data flow “Account Balance” entering and “Fee Calculation” leaving.
Myth 3: DFDs Are Only for Developers 👨💻
Some believe DFDs are technical artifacts meant solely for coding teams. This limits their utility. DFDs are excellent communication tools for business stakeholders, project managers, and clients.
Because DFDs focus on data rather than code, they are language-agnostic. A business owner can look at a DFD and understand how customer information moves through the billing system without knowing about database schemas or API endpoints. This makes them vital for requirement gathering and validation.
Myth 4: One Diagram Fits All Scenarios 📐
People often try to draw the entire system on a single page. This leads to clutter and unreadability. DFDs are hierarchical. They are meant to be broken down into levels of detail.
- Context Diagram: The highest level. Shows the system as one process and its interactions with external entities.
- Level 0 Diagram: Decomposes the main process into major sub-processes.
- Level 1 Diagram: Further breaks down specific sub-processes.
Forcing all this detail into one view obscures the structure. Each level should stand on its own while maintaining consistency with the others.
Myth 5: Data Flows Can Cross Processes Without Stopping 🔄
A strict rule in DFD modeling is that data cannot flow directly from one external entity to another, or from one data store to another. All data must pass through a process.
If data moves from Entity A to Data Store B, it must go through a process. This ensures that the data is being acted upon or validated. Allowing direct connections implies the system has no control over the data, which is rarely true in software engineering.
Understanding DFD Levels and Hierarchy 📚
Creating a multi-level DFD structure is essential for managing complexity. Here is how the hierarchy typically functions.
Level 0: The Context Diagram
This is the overview. It defines the system boundary. Everything inside the single process circle is the system. Everything outside is external. This diagram helps stakeholders understand the scope of the project immediately.
Level 1: The Decomposition
Here, the single process from Level 0 is exploded into the major functional areas. For example, an “Order Processing System” might become “Receive Order,” “Process Payment,” and “Ship Goods.” This level provides a high-level view of the internal structure.
Level 2 and Beyond: Detailed Breakdown
These levels drill down into specific processes from Level 1. You stop decomposing when a process is simple enough to be understood without further detail, or when it is too granular to be useful (e.g., a single line of code).
| Level | Focus | Complexity | Primary Audience |
|---|---|---|---|
| Context (Level 0) | System Boundary | Low | Stakeholders |
| Level 0 | Major Sub-systems | Medium | Project Managers |
| Level 1+ | Specific Processes | High | Developers |
DFD vs. Other Modeling Diagrams 🔄
Confusion often arises between DFDs and other modeling techniques. Knowing when to use which tool is critical.
Data Flow Diagram vs. Entity Relationship Diagram (ERD)
- DFD: Focuses on dynamic behavior. How data moves over time. It shows processes and flows.
- ERD: Focuses on static structure. How data is stored and related. It shows tables, keys, and relationships.
You often need both. The DFD tells you what data is needed, and the ERD tells you how to store it. Do not try to force an ERD to show data movement, or a DFD to show database schema.
Data Flow Diagram vs. UML Activity Diagram
- DFD: Data-centric. No control flow, no loops.
- Activity Diagram: Behavior-centric. Shows logic, decisions, and parallel processing.
Use Activity Diagrams when you need to describe the workflow or state changes. Use DFDs when you need to describe the data requirements.
Best Practices for Creating Accurate DFDs ✅
To ensure your diagrams are effective and accurate, follow these structural guidelines.
- Use Action Verbs: Process names should always start with a verb (e.g., “Calculate Tax,” not “Tax Calculation”). This emphasizes the transformation aspect.
- Be Consistent with Naming: If a data flow is called “Invoice” at Level 0, it should be called “Invoice” at Level 1. Changing names creates confusion about data identity.
- Balance Your Diagrams: The inputs and outputs of a parent process must match the inputs and outputs of its child processes. If “Order Data” enters a Level 0 process, “Order Data” (or its components) must enter the Level 1 processes that make up that parent.
- Avoid Ghost Flows: Ensure every arrow has a purpose. If a data flow enters a process but is not used, it is a ghost flow and should be removed. Conversely, if a process produces data but nothing uses it, the data is orphaned.
- Limit Data Store Connections: Do not connect a process directly to multiple data stores unless necessary. Keep the flow logical.
Common Mistakes to Avoid ⚠️
Even experienced analysts make mistakes. Here are the pitfalls that compromise diagram quality.
Mixing Control and Data
Do not include decision diamonds or loops. If a process has a conditional path, simply show the resulting data flow. The logic itself belongs in the process description, not the diagram.
Ignoring Data Stores
Some diagrams omit data stores to simplify the view. This is incorrect. Data stores represent persistence. Without them, the diagram suggests data is ephemeral and lost after processing. This is rarely the case in business systems.
Over-Decorating
Do not add colors, icons, or decorative elements unless they serve a specific semantic purpose (like color-coding priority). Keep the visual language standard to ensure clarity.
Unclear Entity Boundaries
Ensure you know what is inside the system and what is outside. If a user interface is part of the system, the user is the entity. If the user interface is external (like a web browser), the system boundary might be different. Consistency here prevents scope creep.
The Importance of Data Flow Naming 🏷️
Naming data flows is more critical than many realize. A label like “Data” is useless. A label like “Customer Information” is better. A label like “Customer Name, Address, and Phone Number” is precise.
Clear naming prevents ambiguity during the implementation phase. When developers see “Invoice,” they know exactly what structure to expect. If the label is vague, they may make assumptions that lead to integration errors.
Maintaining DFDs Over Time 🔄
DFDs are not static documents. Systems evolve, and requirements change. A DFD that is accurate today may be obsolete in six months.
- Version Control: Treat DFDs like code. Keep track of revisions.
- Review Cycles: Schedule regular reviews with stakeholders to ensure the diagram reflects current business rules.
- Update Triggers: Change the diagram whenever a major feature is added, a database schema changes, or a third-party integration is modified.
Failure to maintain DFDs leads to a disconnect between documentation and reality. Developers will ignore the documentation, and new team members will be misled. Treat the diagram as a living artifact of the system.
Technical Considerations for Implementation 🛠️
When moving from design to implementation, the DFD serves as a blueprint. Here is how it translates to technical work.
Mapping to Database Schema
Every data store in the DFD should correspond to a table or collection in the database. The data flows indicate the columns and relationships. If a DFD shows “Shipping Address” flowing into a “Customer Profile,” the database must have a field for this. If it is missing, the design is flawed.
Mapping to API Endpoints
Processes in a DFD often translate to API endpoints or microservices. A process named “Validate User” might become a `/auth/validate` endpoint. The data flows define the request and response payloads.
Conclusion on Best Practices 🎯
Adhering to strict modeling rules ensures that the DFD remains a useful tool throughout the project lifecycle. By avoiding common myths and focusing on data movement rather than control logic, teams can create clear, actionable diagrams. Remember that the goal is communication, not just documentation. If the diagram does not help the team understand the system, it has failed its purpose.
Regular review, consistent naming, and proper hierarchy are the keys to success. Treat the diagram with the same rigor as the code it describes. This discipline pays off in reduced errors, clearer requirements, and smoother development cycles.
Final Thoughts on System Visualization 🌐
Visualizing systems is an art as much as it is a science. Data Flow Diagrams provide a specific lens through which to view data movement. They do not replace other tools, but they complement them. By understanding their limitations and strengths, analysts can leverage DFDs to build robust, well-documented systems.
Keep the focus on data. Keep the processes abstract. Keep the levels balanced. With these principles in mind, your modeling efforts will yield accurate and valuable results.