Building software for the cloud requires a shift in thinking. Traditional monolithic architectures relied on tightly coupled components sharing memory and local file systems. Cloud-native applications, however, operate across distributed environments, often spanning multiple networks and security boundaries. To navigate this complexity, engineers need clear visual representations of how information moves through the system. This is where the Data Flow Diagram (DFD) becomes an essential tool. By mapping the flow of data between processes, stores, and external entities, teams can design robust, scalable, and secure systems without relying on guesswork.
This guide explores how to apply DFD principles specifically to cloud-native contexts. We will examine the core components, the necessary adaptations for distributed systems, and the practical steps to create diagrams that remain useful as infrastructure evolves. Whether you are designing a microservices ecosystem or a serverless function chain, understanding data movement is the foundation of reliable engineering.
🌩️ Understanding the Shift to Cloud-Native Modeling
In a traditional on-premise environment, a system often exists within a single physical boundary. Data flows locally between processes. In a cloud-native setting, the boundaries are fluid. A single logical application might consist of dozens of independent services running in containers, orchestrated across different regions or availability zones. The network latency, eventual consistency, and security policies introduce variables that do not exist in monolithic designs.
When creating a Data Flow Diagram for this environment, you must account for:
- Network Boundaries: Data often crosses public networks or secure VPCs. Each hop represents a potential point of failure or latency.
- State Management: Cloud services are often stateless. Processes must retrieve state from external stores rather than holding it in memory.
- Asynchronous Communication: Synchronous calls (request-response) are not always the best fit. Message queues and event streams change how data flows between components.
- Security Zones: Data entering a perimeter must be authenticated and encrypted before reaching internal processes.
Visualizing these constraints early prevents architectural debt. A diagram that ignores network segmentation or stateless requirements will result in a system that is difficult to debug and scale. The goal is not just to show where data goes, but to highlight where it is transformed, stored, and secured.
🧩 Core Components of a Data Flow Diagram
Before adapting these diagrams for the cloud, we must establish the standard building blocks. A DFD is not a flowchart; it does not show control logic or timing. It shows the movement of data. The four primary elements remain consistent, even in distributed systems.
1. Processes 🔄
A process represents an activity that transforms input data into output data. In a cloud-native context, a process is often a function, a containerized application, or a microservice instance. It is important to name processes based on what they do, not what they are called technically. For example, instead of “UserService API,” use “Validate User Credentials.” This keeps the diagram focused on the data transformation logic.
- Transformation: Every process must change data in some way. If data passes through without modification, it should not be represented as a process.
- Encapsulation: In microservices, each process is encapsulated. The internal logic is hidden; only the input and output interfaces matter for the diagram.
- Statelessness: Most cloud processes are ephemeral. They do not retain memory of previous interactions. This must be reflected in the data flow requirements.
2. Data Stores 🗄️
A data store represents a place where data rests while not being processed. In the cloud, this could be a relational database, a NoSQL document store, an object storage bucket, or a distributed cache. Unlike a file system, cloud data stores are often accessed over a network.
- Persistence: Data must be saved to a store if it needs to survive a process failure or restart.
- Access Patterns: Read-heavy stores differ from write-heavy stores. The diagram should indicate the type of access if it impacts the architecture significantly.
- Security: Sensitive data stores require different access controls. This distinction is vital for security audits.
3. External Entities 👥
External entities are sources or destinations of data outside the system boundary. These can be human users, third-party APIs, legacy systems, or hardware devices. In a cloud-native diagram, external entities often represent the edge of the internet or other cloud services.
- Trusted vs. Untrusted: Distinguish between data coming from a known internal service versus public internet traffic.
- Triggering: Entities often initiate the flow. A user request triggers a process; a scheduled job triggers a data sync.
4. Data Flows 📡
Data flows are the arrows connecting the components. They represent the transmission of data. In cloud environments, these flows often traverse networks. Labels on the arrows are critical. They should describe the data packet, not the protocol. For example, label the arrow “Order Details” rather than “HTTP POST.” This keeps the diagram protocol-agnostic and future-proof.
- Directionality: Flows are unidirectional. If data moves back and forth, draw two separate arrows.
- Volume: High-volume data flows might require different infrastructure (e.g., dedicated bandwidth) compared to low-volume control flows.
- Encryption: Flows crossing security boundaries must be marked as encrypted to highlight compliance requirements.
☁️ Adapting DFDs for Distributed Systems
Standard DFDs assume a cohesive system. Cloud-native systems are distributed. To make a DFD useful in this context, you must explicitly model the distributed nature of the infrastructure. This involves adding layers of abstraction that represent network topology and service boundaries.
Service Boundaries
Microservices are the standard building blocks of cloud-native applications. Each service should ideally be a distinct process in your diagram. However, drawing every single service can lead to clutter. A common approach is to group related services into a logical domain, such as “Billing Domain” or “User Management Domain.” This allows you to see the high-level flow while keeping the internal complexity hidden.
API Gateways
Most cloud-native applications sit behind an API Gateway or Load Balancer. This component acts as the single point of entry. In a DFD, the gateway is a process that routes requests. It handles authentication, rate limiting, and protocol translation. Do not treat the gateway as a simple pipe; it actively modifies the flow of data.
Event-Driven Architectures
Many modern systems use event-driven patterns. A producer generates an event, and a consumer processes it later. This breaks the synchronous link between process and data flow. In a DFD, you represent this using an event queue or stream as a data store. The producer writes the event; the consumer reads it. This decoupling is crucial for resilience.
| Component | Traditional Monolith | Cloud-Native Adaptation |
|---|---|---|
| Process | In-memory function | Containerized Microservice / Serverless Function |
| Data Store | Local File / SQL DB | Managed Cloud Database / Object Storage |
| Flow | Local Memory Call | HTTP / gRPC / Message Queue |
| State | Shared Memory | Externalized State Store |
📉 Levels of Abstraction in Cloud Architecture
Complex systems require multiple levels of diagrams. Trying to capture every detail in a single view leads to confusion. The standard DFD approach of levels 0, 1, and 2 works well for cloud systems when applied correctly.
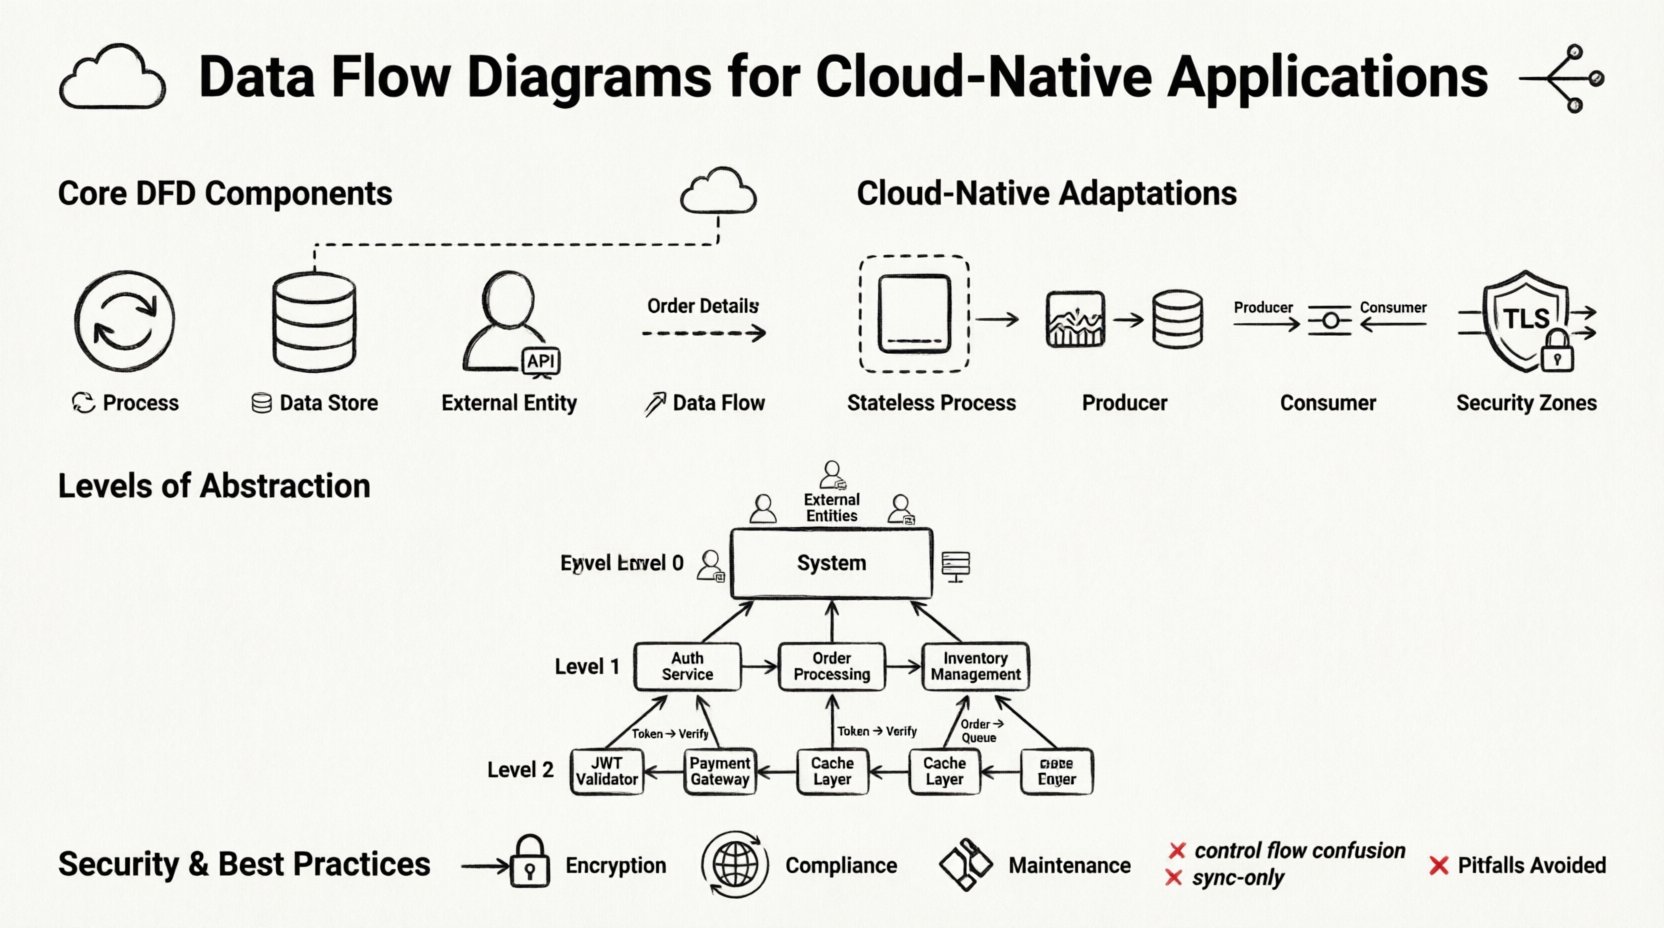
Level 0: Context Diagram
The Context Diagram shows the entire system as a single process. It highlights the external entities interacting with the system. For a cloud application, this defines the perimeter. It answers the question: “What enters the system, and what leaves it?” This is the highest-level view, useful for stakeholders who need to understand the scope without technical details.
- Focus: System boundaries and external interfaces.
- Detail: Minimal. One central process.
- Use Case: Project scope definition and high-level security planning.
Level 1: Major Processes
Level 1 breaks the central process into major sub-processes. In a cloud-native context, these are typically the main functional domains. For example, a Level 1 diagram for an e-commerce platform might show “Order Processing,” “Inventory Management,” and “Payment Handling” as distinct processes. This level reveals how data moves between major service groups.
- Focus: Major functional modules and their interactions.
- Detail: Inputs and outputs for each major module.
- Use Case: Architectural review and service decomposition.
Level 2: Detailed Logic
Level 2 drills down into specific sub-processes. This is where the technical implementation details become relevant. For example, the “Payment Handling” process might be expanded to show “Validate Card,” “Charge Account,” and “Update Receipt.” This level is used by developers implementing specific services.
- Focus: Internal logic of specific services.
- Detail: Specific data transformations and local data stores.
- Use Case: Development implementation and testing scenarios.
🔒 Security and Compliance in Data Mapping
Security is not an afterthought in cloud-native development; it is a design requirement. A Data Flow Diagram is an excellent tool for identifying security risks. By tracing the path of data, you can spot where sensitive information might be exposed or improperly stored.
Identifying Sensitive Data
Not all data flows are created equal. Personal Identifiable Information (PII), financial records, and health data require stricter handling. In your diagram, mark flows containing sensitive data. This ensures that every process touching this data is reviewed for compliance.
- Encryption in Transit: Flows crossing network boundaries must be encrypted (TLS/SSL). Mark these flows clearly.
- Encryption at Rest: Data stores holding sensitive information must be encrypted. Indicate this in the data store label.
- Access Control: Identify which processes are allowed to read or write specific data stores. This helps in setting up Role-Based Access Control (RBAC).
Compliance Boundaries
Different regions have different data sovereignty laws. Data might need to stay within a specific geographic boundary. A DFD helps visualize these constraints. If a process in Region A sends data to Region B, this flow should be flagged for legal review. This prevents accidental violations of regulations like GDPR or CCPA.
⚠️ Common Pitfalls and How to Avoid Them
Creating DFDs for cloud systems is challenging. There are common mistakes that teams make, often stemming from trying to map old patterns to new environments. Avoiding these pitfalls ensures your diagrams remain accurate and useful.
1. Mixing Control and Data Flow
DFDs should not show control logic. Do not draw arrows to indicate “if this, then that.” Use decision points or external notes for logic, but keep the arrows focused on data movement. In cloud systems, where control logic is often handled by orchestration platforms, the DFD should focus on the payload.
2. Ignoring Asynchronous Flows
Cloud systems are rarely 100% synchronous. Jobs run in the background. If you only draw synchronous request-response flows, your diagram will be incomplete. Always include background jobs and event streams as data flows into or out of data stores.
3. Over-Optimizing for Specific Tools
Do not design your diagram based on the capabilities of a specific tool or platform. If you choose a specific database or message broker, the diagram might become obsolete when you switch technologies. Focus on the logical flow of data, not the physical implementation.
4. Neglecting Error Flows
Successful paths are easy to draw. Failure paths are harder but necessary. In a cloud environment, services fail frequently. Indicate where error data is logged or where retry mechanisms are triggered. This helps in designing robust monitoring and alerting systems.
🔄 Maintaining Diagrams Over Time
A diagram is only useful if it is accurate. Cloud-native applications change rapidly. New services are added, old ones are deprecated, and data models evolve. If the diagram does not match the running system, it becomes misleading documentation. Here is how to maintain them.
- Version Control: Treat diagrams as code. Store them in your version control system alongside your application code. This ensures history and traceability.
- Review Cycles: Include diagram updates in your code review process. If a developer changes a data flow, the diagram should be updated in the same commit or pull request.
- Automated Generation: Where possible, generate diagrams from the code or infrastructure-as-code definitions. This reduces the gap between documentation and reality.
- Stakeholder Alignment: Regularly review the diagrams with non-technical stakeholders. This ensures the abstraction level remains appropriate for the audience.
📋 Comparing DFDs with Other Architectural Views
It is common to confuse DFDs with other diagrams like Sequence Diagrams or System Architecture Diagrams. Understanding the difference helps you choose the right tool for the job.
| Diagram Type | Primary Focus | Best Used For |
|---|---|---|
| Data Flow Diagram | Data movement and transformation | System design, security auditing, data mapping |
| Sequence Diagram | Time-based interaction between objects | API integration, debugging call chains |
| System Architecture | Infrastructure and deployment | DevOps, scaling, hardware requirements |
| Entity-Relationship | Data structure and relationships | Database design, schema planning |
A DFD complements these views. While an architecture diagram shows where servers are located, a DFD shows how information travels between them. While a sequence diagram shows the order of calls, a DFD shows the payload. Using them together provides a complete picture of the system.
🚀 Future Trends in Cloud Modeling
As cloud technologies evolve, so do the requirements for modeling. The rise of serverless computing and edge computing introduces new challenges. Data flows are becoming more decentralized. Processes are running closer to the user. This shift requires DFDs to account for edge nodes and temporary compute resources.
Furthermore, the integration of artificial intelligence into workflows adds complexity. AI models consume data and produce insights. These processes often require large datasets and specialized hardware. Future DFDs will need to represent these compute-heavy processes and the data pipelines feeding them. The core principles remain the same, but the granularity and scope will expand.
By adhering to the fundamentals of Data Flow Diagrams while adapting to the realities of the cloud, engineering teams can build systems that are transparent, secure, and scalable. Visualizing data is not just a documentation exercise; it is a critical step in the design process that prevents errors before they reach production.