Introduction
In today’s complex business environment, understanding how work actually gets done is fundamental to improvement. A flowchart is one of the most powerful yet accessible tools for achieving this understanding. As a common type of process map, a flowchart visually represents the steps of a process, system, or workflow in sequential order. Using standardized symbols and directional arrows, flowcharts transform complex processes into clear, analyzable diagrams that teams can examine, discuss, and improve.
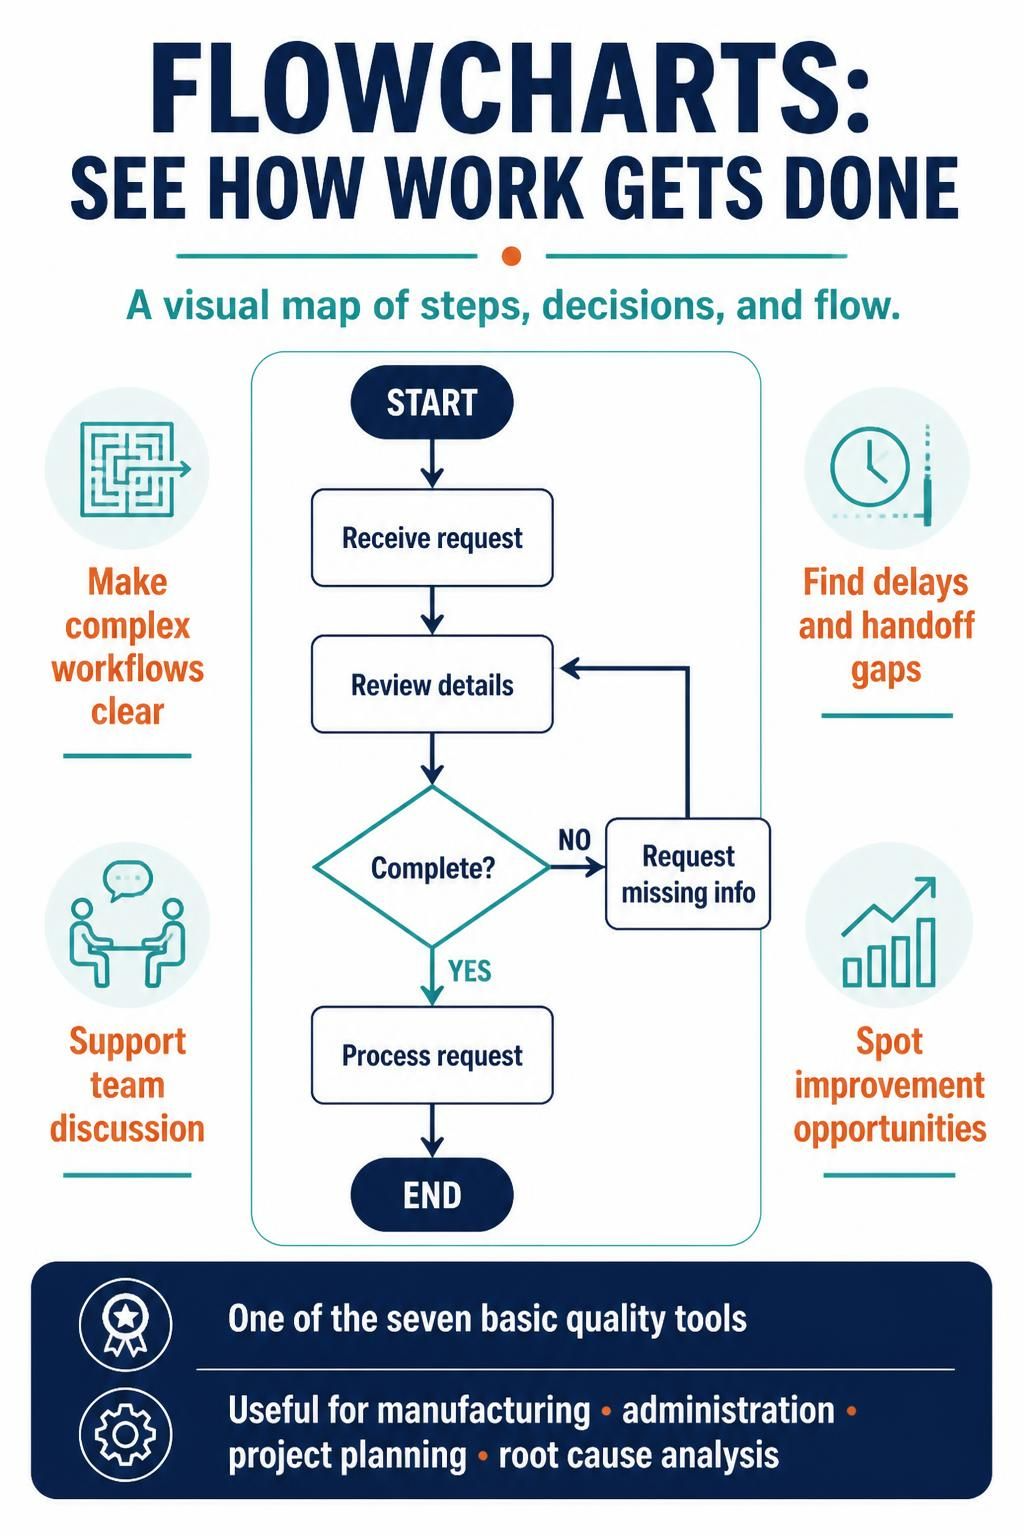
Flowcharts are recognized as one of the seven basic quality tools—a testament to their enduring value in quality management and process improvement. Whether you’re documenting a manufacturing process, designing an administrative workflow, planning a project, or conducting root cause analysis, the flowchart serves as a universal language for describing how things work. This comprehensive guide explores the purpose, construction, and application of flowcharts, providing you with the knowledge to leverage this essential tool effectively.
Key Concepts
What is a Flowchart?
A flowchart is a diagram that depicts a process, system, or computer algorithm. It uses rectangles, diamonds, ovals, and other shapes connected by arrows to show the sequence of steps and decisions required to complete a task. Flowcharts can range from simple hand-drawn sketches to elaborate, multi-page diagrams created with specialized software.
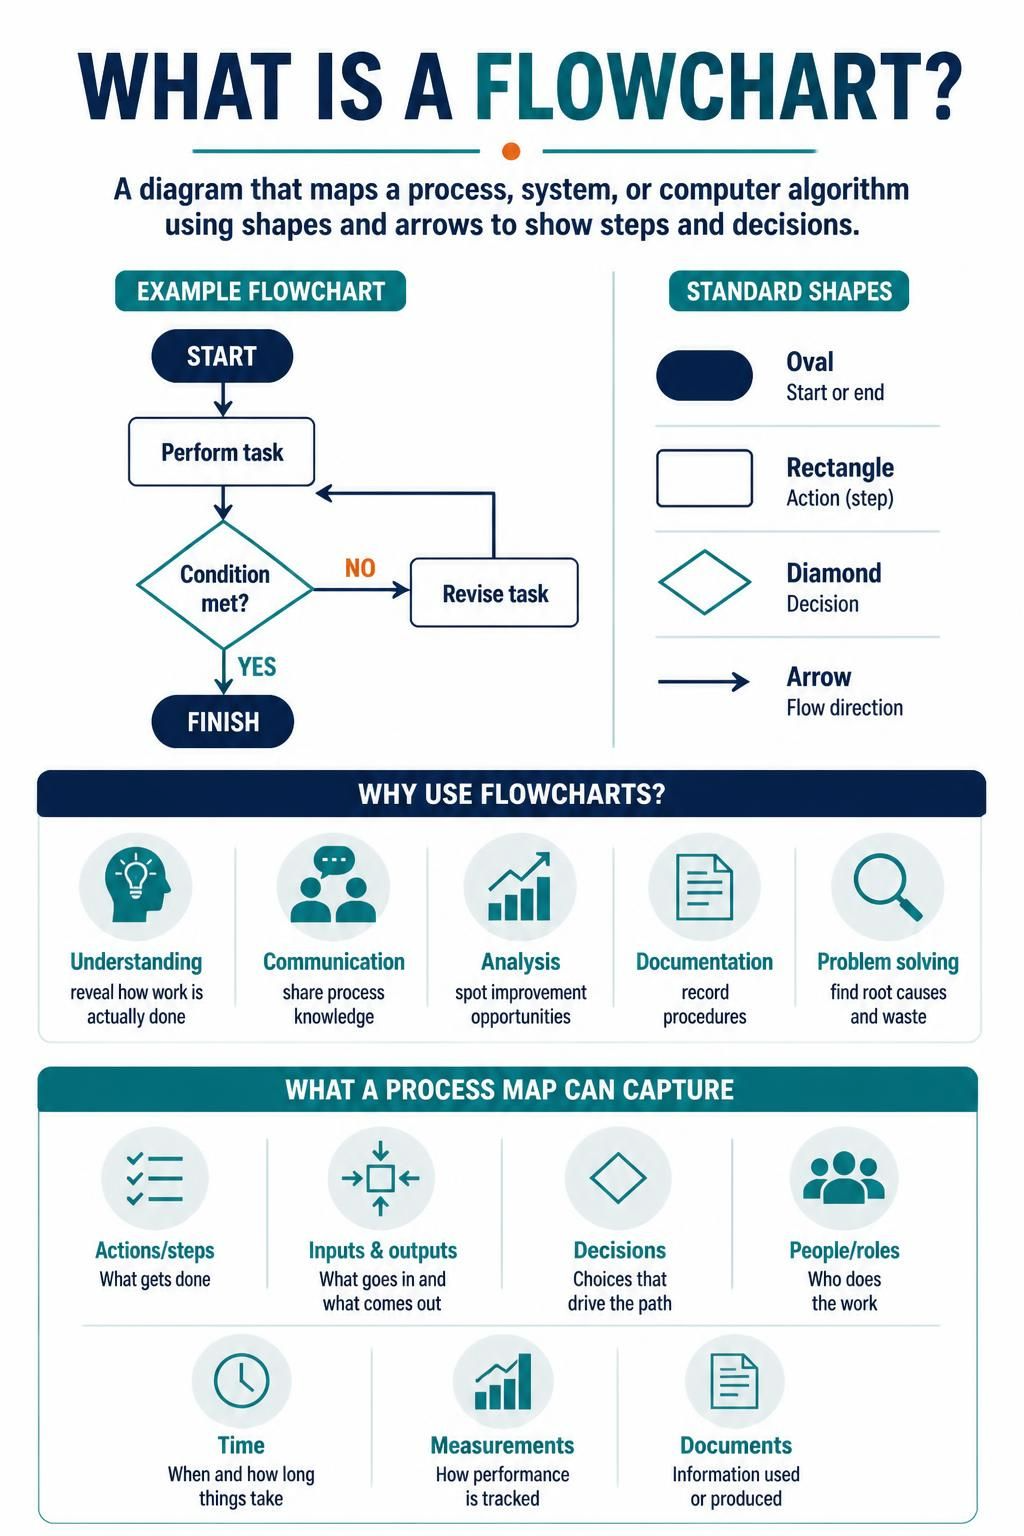
Core purposes of flowcharts include:
-
Understanding: Revealing how a process is actually performed
-
Communication: Sharing process knowledge across teams and stakeholders
-
Analysis: Studying processes to identify improvement opportunities
-
Documentation: Creating permanent records of procedures
-
Problem Solving: Accelerating root cause analysis and waste identification
Elements of a Flowchart
Flowcharts capture far more than just a sequence of actions. A comprehensive flowchart may include:
| Element | Description |
|---|---|
| Actions/Steps | The individual tasks performed in the process |
| Inputs and Outputs | Materials, information, or services entering or leaving the process |
| Decisions | Branching points where the process path depends on a condition |
| People | Individuals or roles involved at each step |
| Time | Duration or timing associated with steps |
| Measurements | Process metrics or checkpoints |
| Documents | Records or paperwork generated or used |
When to Use a Flowchart
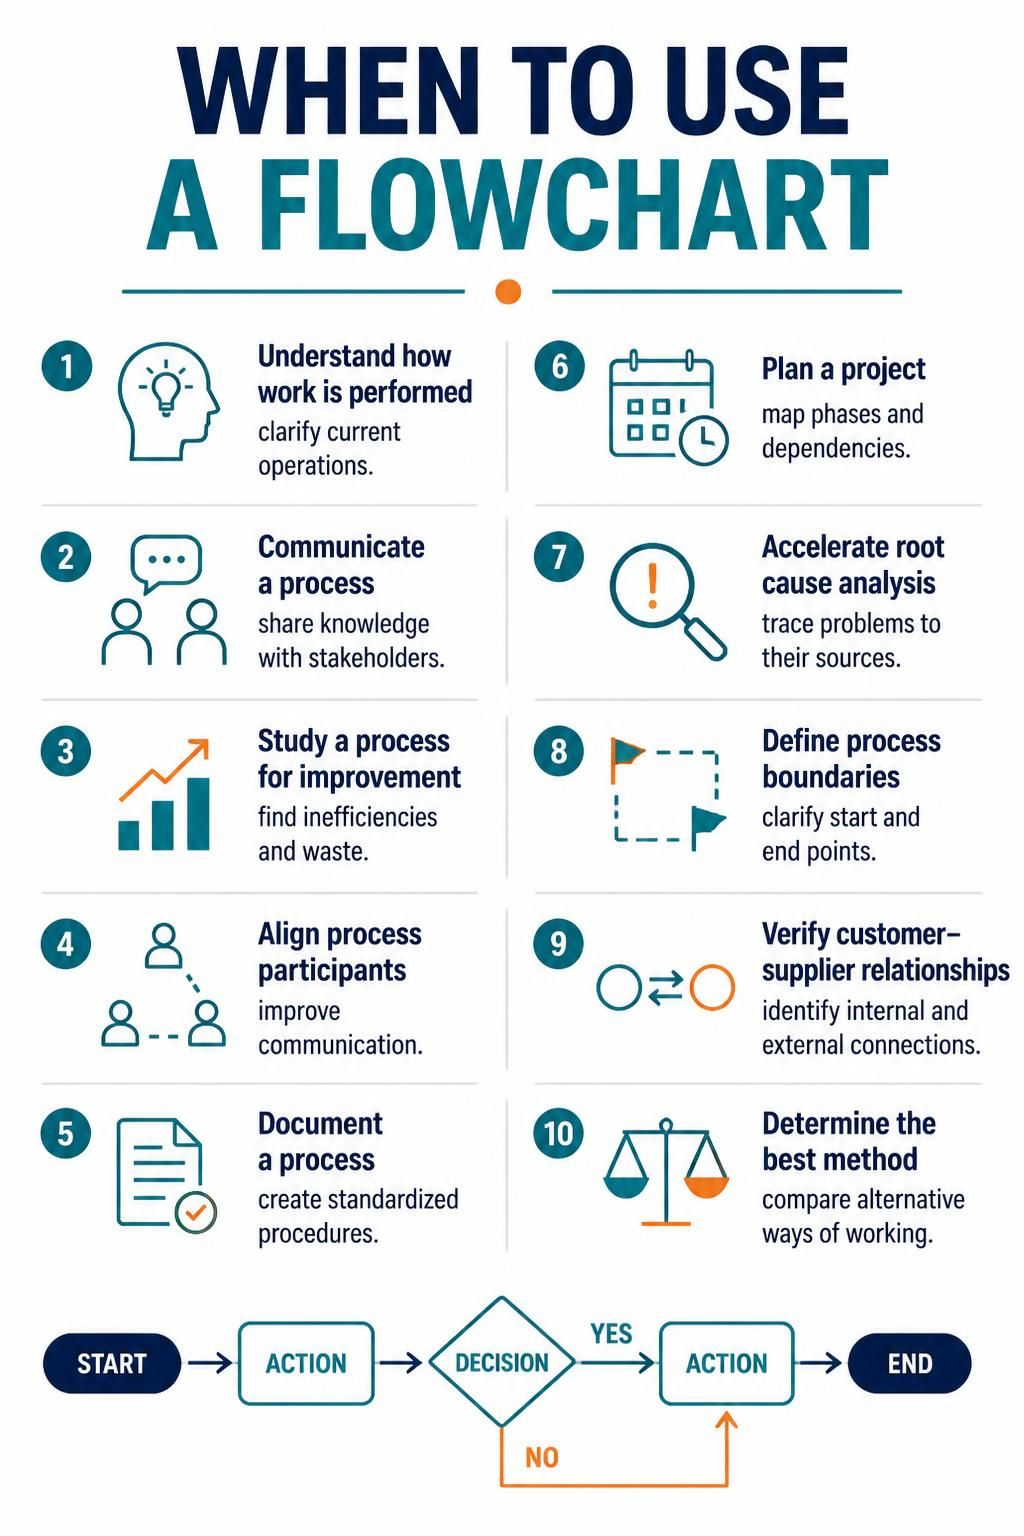
Flowcharts are versatile tools applicable across numerous scenarios:
-
To understand how a process is performed — Gain clarity on current operations
-
To communicate how a process is performed — Share knowledge with stakeholders
-
To study a process for improvement — Identify inefficiencies and waste
-
To facilitate better communication — Align people involved in the same process
-
To document a process — Create standardized procedures
-
To plan a project — Map out project phases and dependencies
-
To accelerate root cause analysis — Trace problems to their sources
-
To define process boundaries — Clarify where processes start and end
-
To verify customer-supplier relationships — Identify internal and external connections
-
To determine the best method — Compare alternative approaches to performing work
Commonly Used Flowchart Symbols
Standardized symbols ensure flowcharts are universally understood:
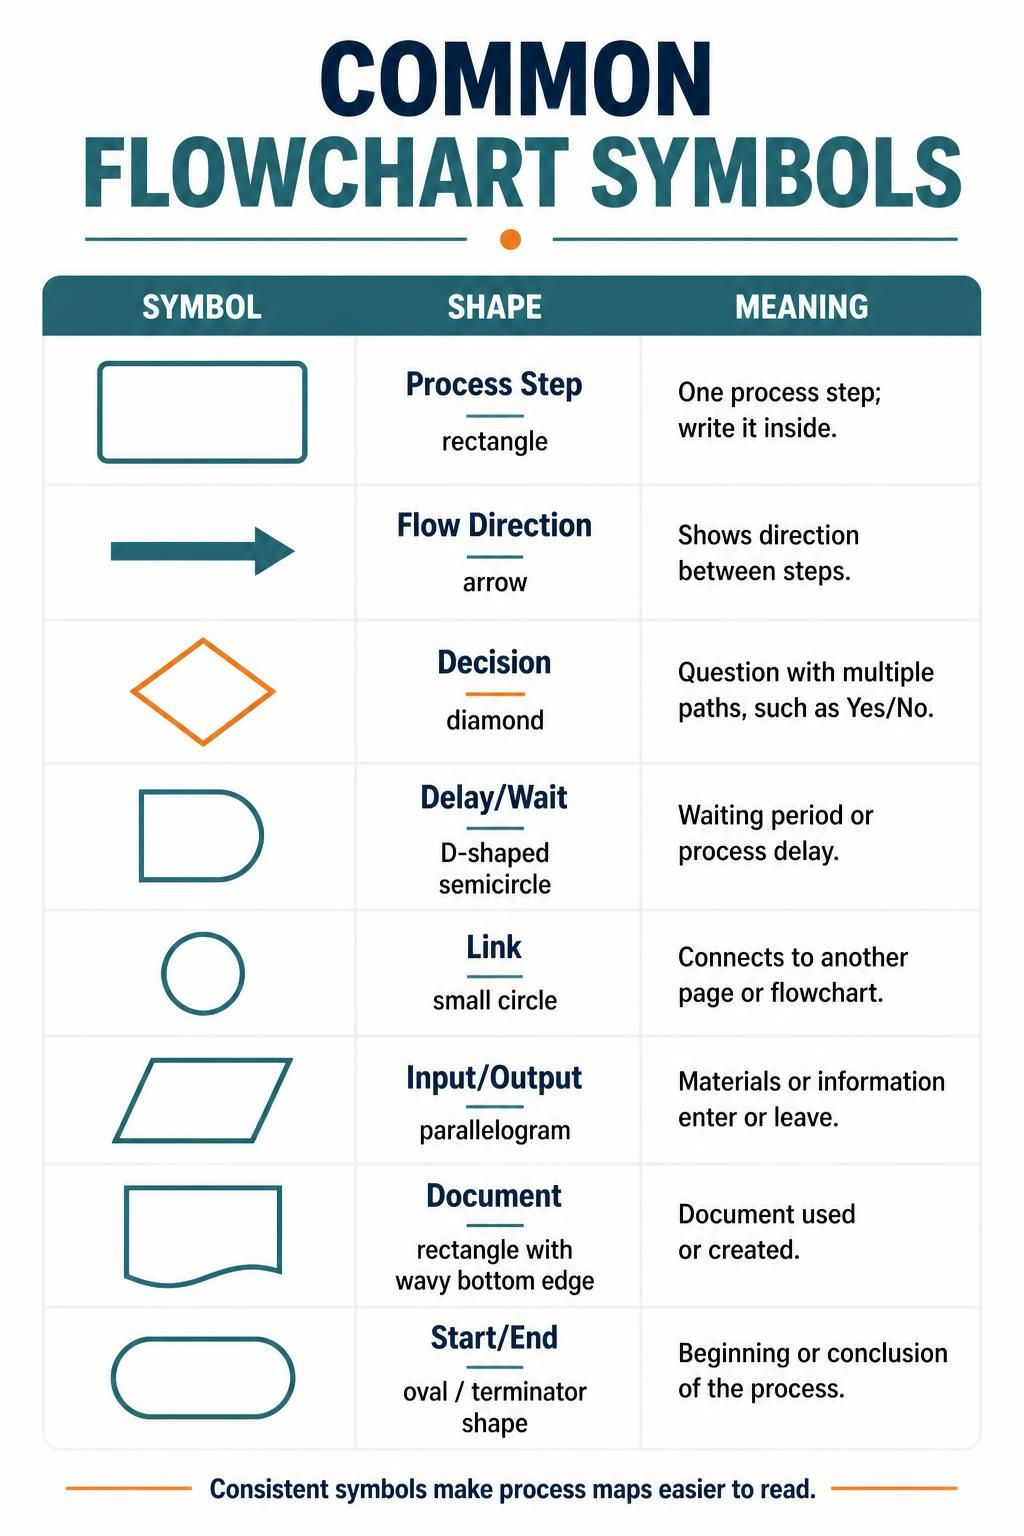
| Symbol | Shape | Meaning |
|---|---|---|
| Process Step | Rectangle | One step in the process; step written inside |
| Flow Direction | Arrow | Direction of flow between steps |
| Decision | Diamond | Question with multiple outgoing paths (e.g., Yes/No) |
| Delay/Wait | Semi-circle | Waiting period or delay in the process |
| Link | Circle | Connection to another page or flowchart |
| Input/Output | Parallelogram | Materials or information entering/leaving |
| Document | Document shape | Document used or generated |
| Start/End | Rounded rectangle/oval | Beginning or conclusion of the process |
Flowchart Basic Procedure
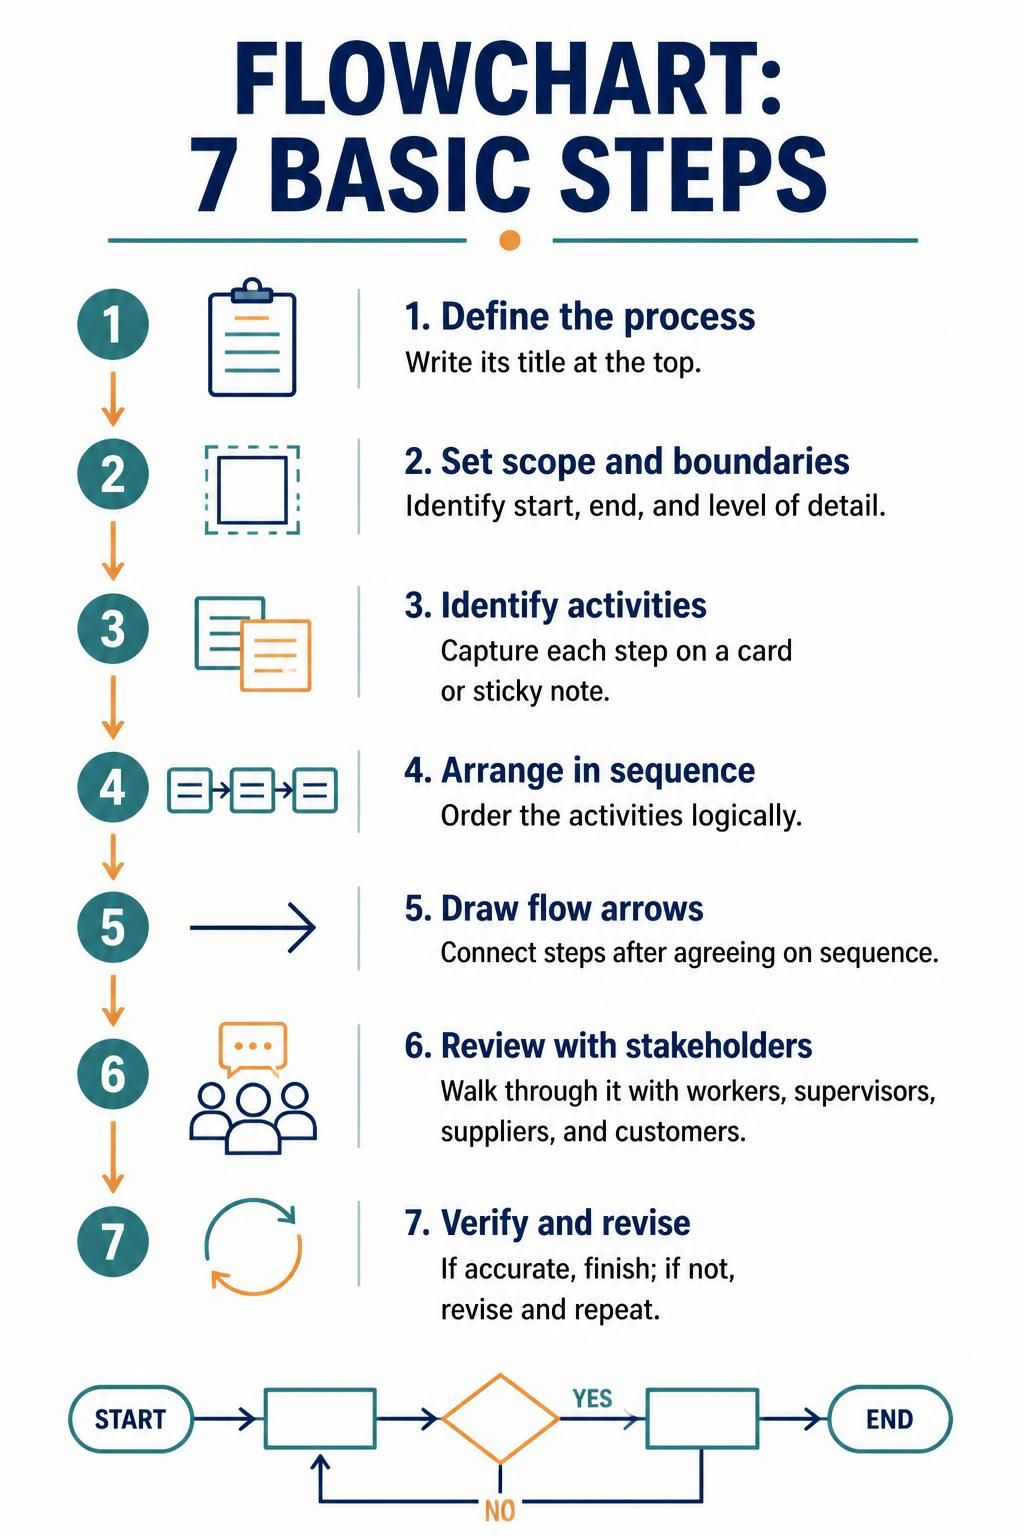
Creating an effective flowchart follows a structured approach:
-
Define the process — Write the process title at the top of your work surface
-
Determine scope and boundaries — Identify where the process starts and ends, and how much detail to include
-
Identify steps and activities — Write each step on a card or sticky note
-
Arrange activities in sequence — Order the steps logically
-
Draw arrows to show flow — Connect steps once the sequence is agreed upon
-
Review with stakeholders — Walk through the process with workers, supervisors, suppliers, and customers
-
Verify correctness — If accurate, you’re done; if not, revise and repeat
Considerations for Effective Flowcharts
-
Don’t worry about the “right way” — The best flowchart is one that helps stakeholders understand the process
-
Use a cross-functional team — Include all key people: suppliers, customers, supervisors
-
Let process performers draw it — Avoid assigning a technical expert who doesn’t perform the work
-
Chart the current state — Document what actually happens, not what should happen
-
Walk through the process — Verify accuracy after completing the first draft
Post-Completion Review
After completing your flowchart, review it to identify:
-
Unclear steps
-
Bottlenecks
-
Sources of delay
-
Sources of error or rework
-
People, knowledge, or authority gaps
-
Duplication
-
Excessive handoffs
-
Cycle time issues
-
Unnecessary steps
Diagram Examples Using PlantUML
Example 1: Simple Process Flowchart
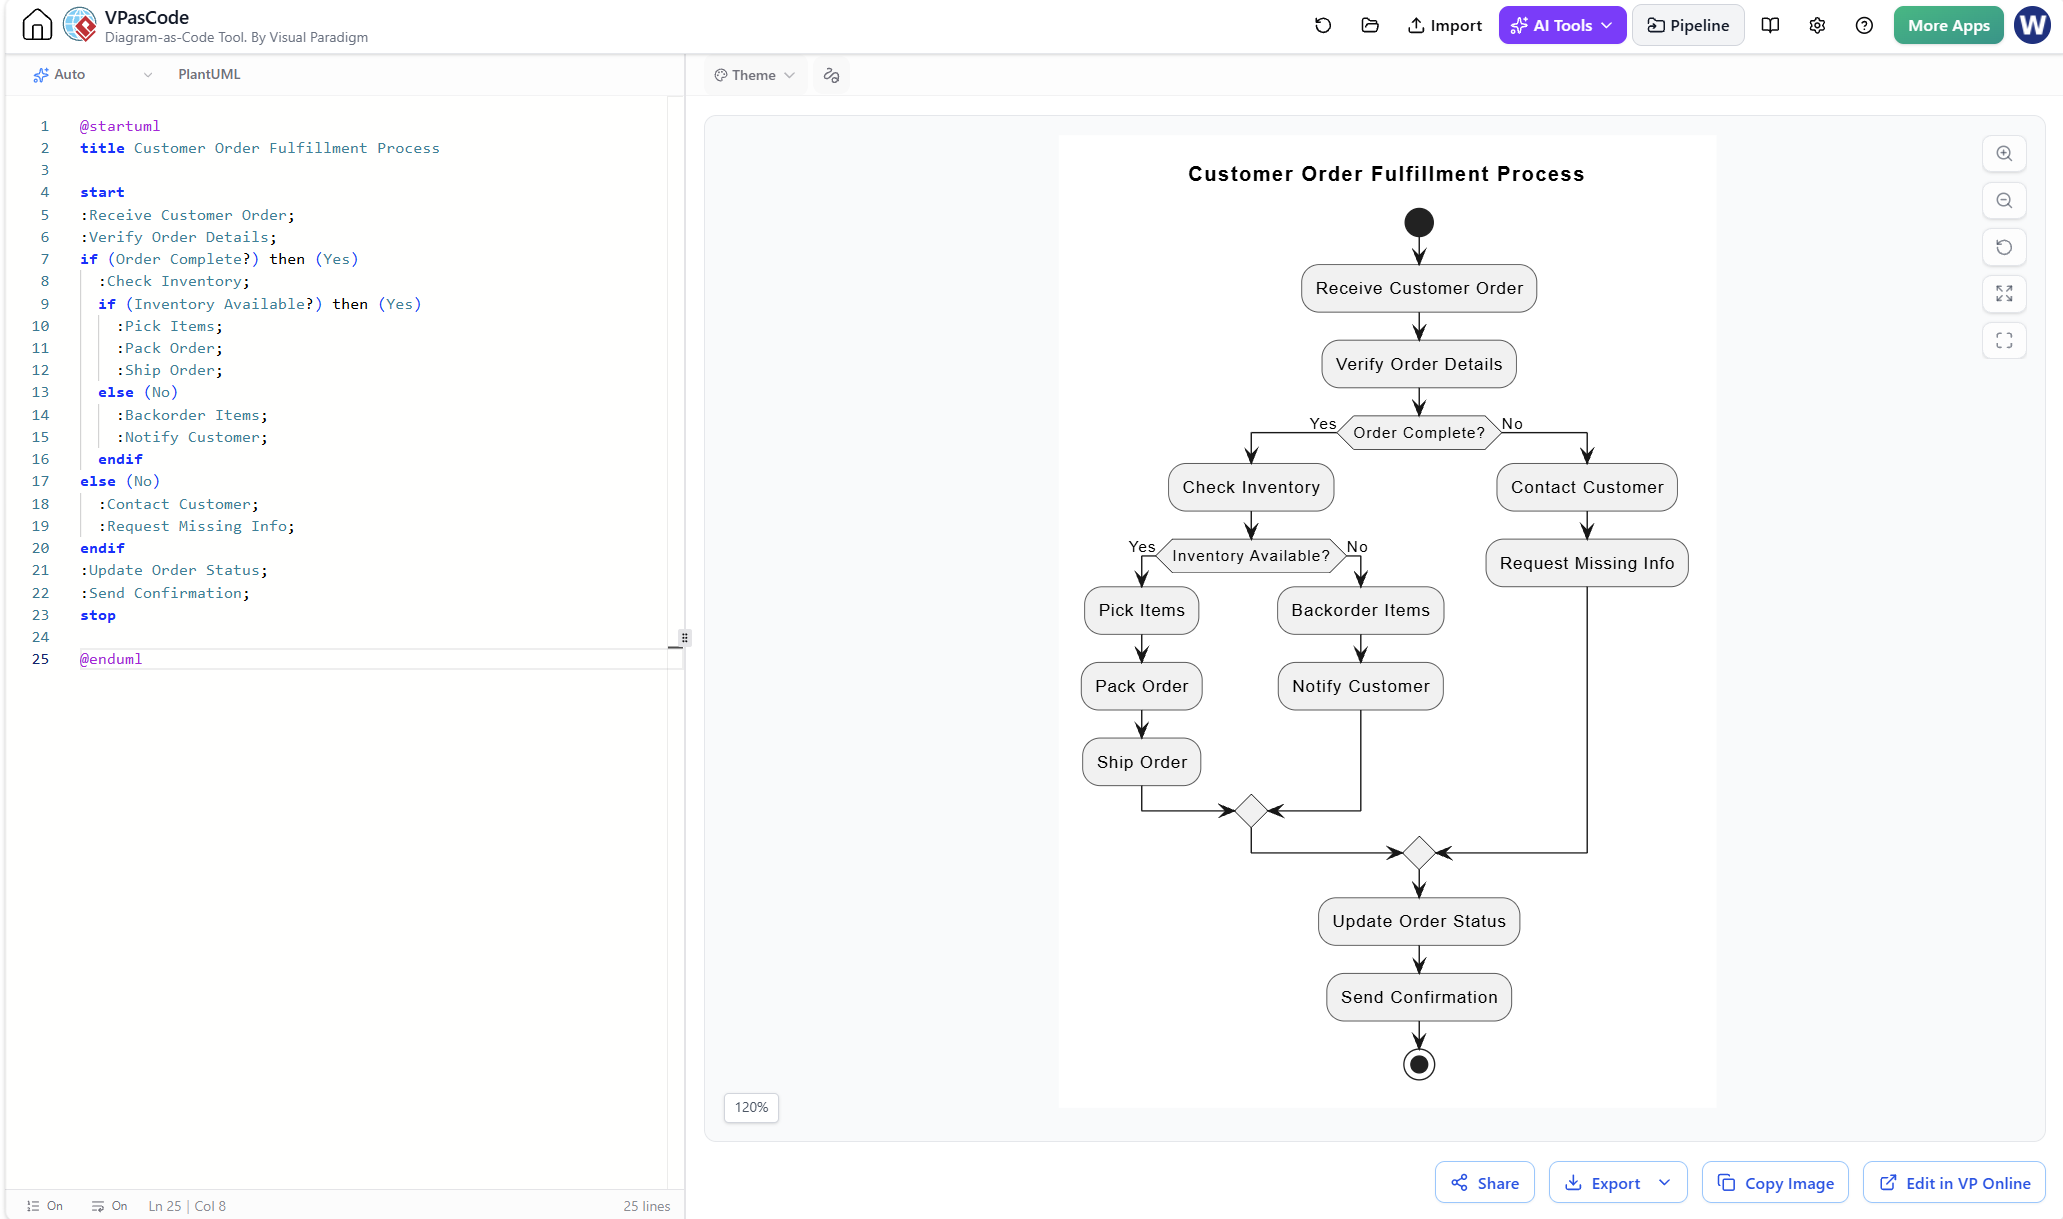
The following PlantUML code demonstrates a basic flowchart for a customer order fulfillment process:
@startuml
title Customer Order Fulfillment Process

start
:Receive Customer Order;
:Verify Order Details;
if (Order Complete?) then (Yes)
  :Check Inventory;
  if (Inventory Available?) then (Yes)
    :Pick Items;
    :Pack Order;
    :Ship Order;
  else (No)
    :Backorder Items;
    :Notify Customer;
  endif
else (No)
  :Contact Customer;
  :Request Missing Info;
endif
:Update Order Status;
:Send Confirmation;
stop

@enduml
Explanation: This flowchart illustrates a simple order fulfillment process using standard flowchart symbols represented in PlantUML syntax. The start/stop represent the rounded oval symbols for beginning and end, rectangles represent process steps, and diamonds represent decision points with branching logic based on conditions like order completeness and inventory availability.
Example 2: Cross-Functional (Swimlane) Flowchart
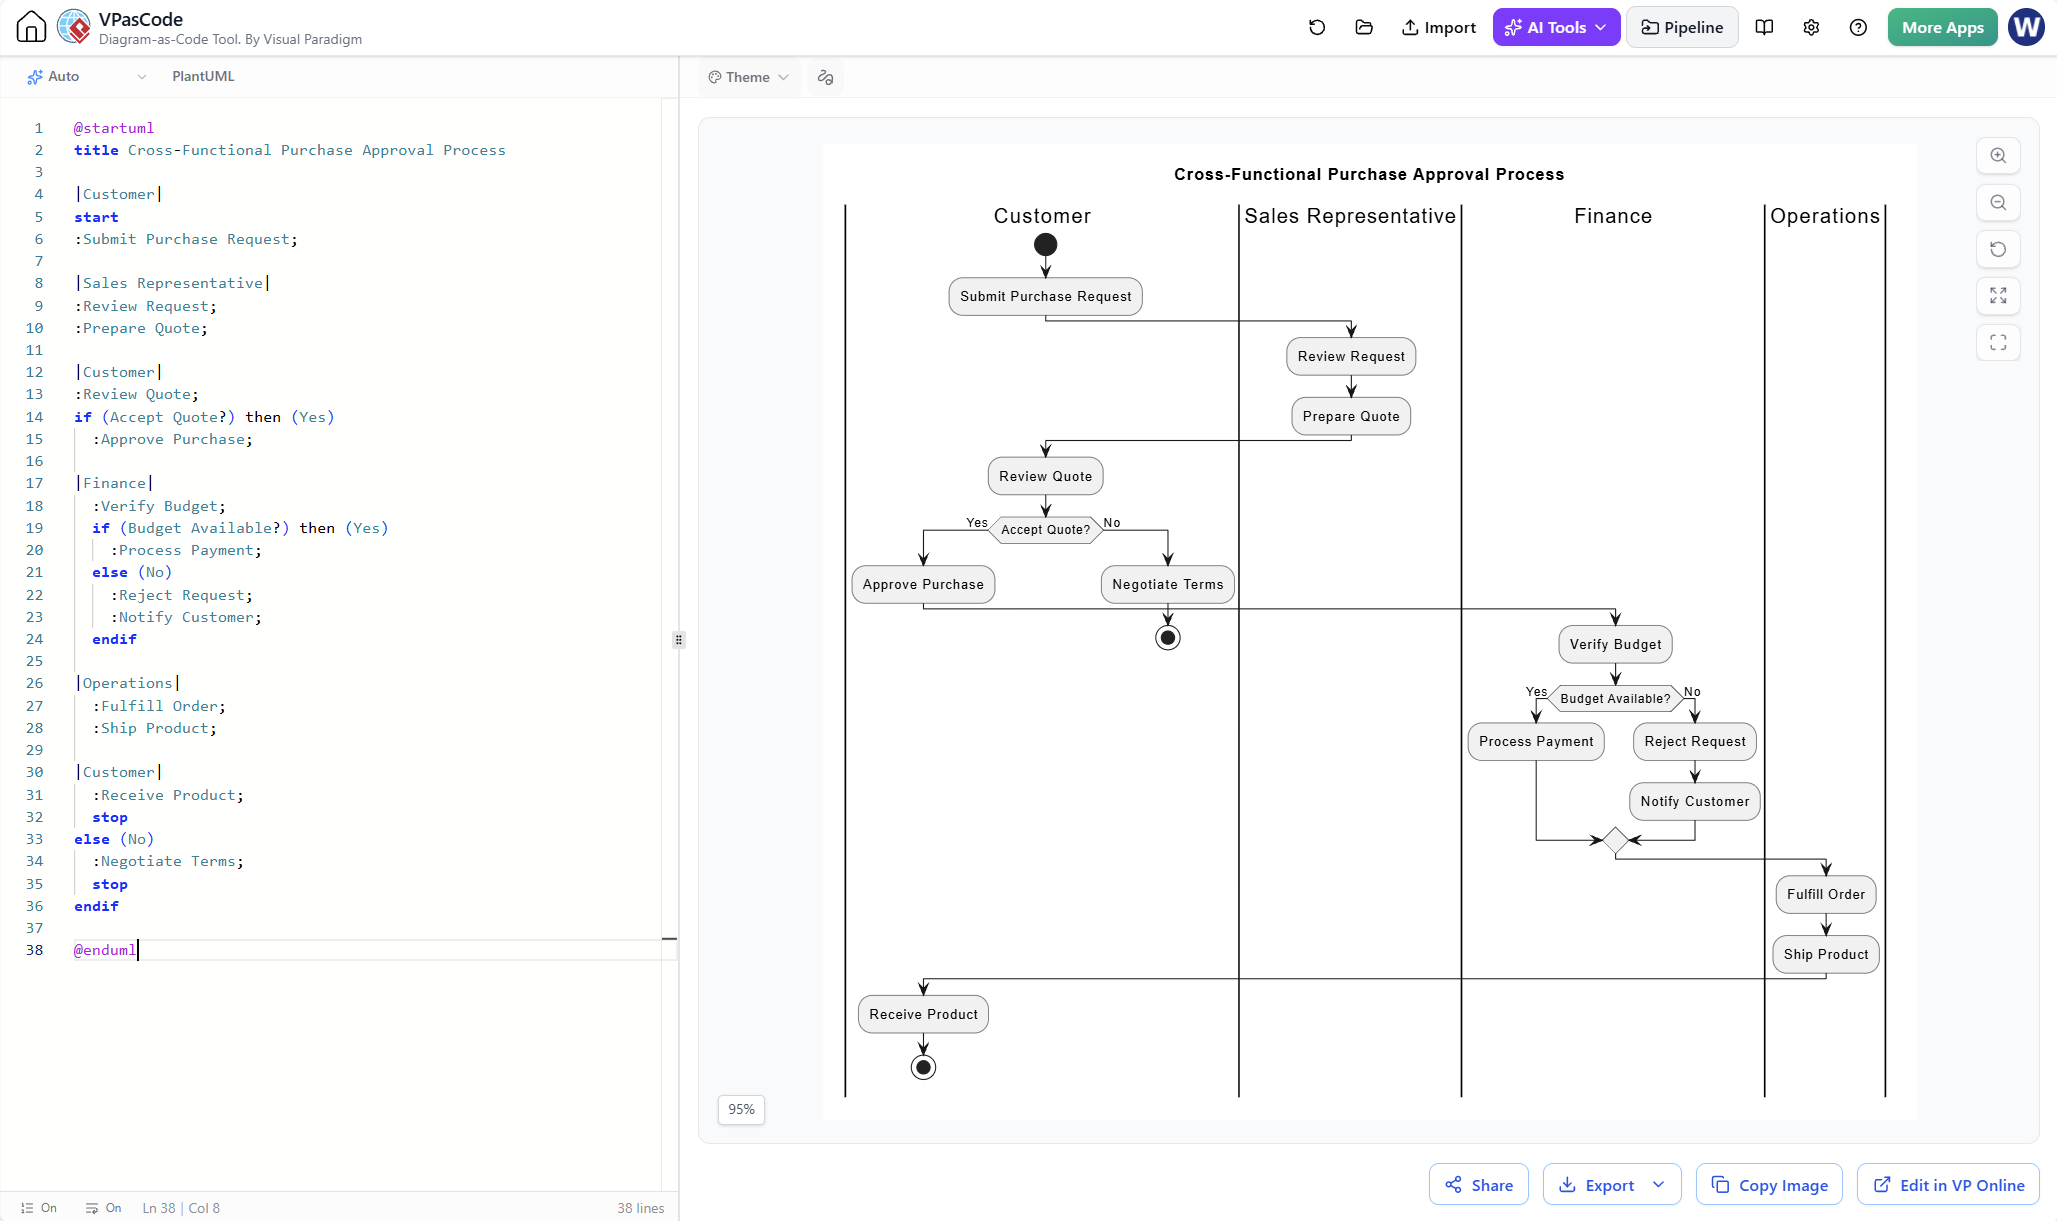
Swimlane flowcharts clarify responsibilities across departments:
@startuml
title Cross-Functional Purchase Approval Process

|Customer|
start
:Submit Purchase Request;

|Sales Representative|
:Review Request;
:Prepare Quote;

|Customer|
:Review Quote;
if (Accept Quote?) then (Yes)
  :Approve Purchase;

|Finance|
  :Verify Budget;
  if (Budget Available?) then (Yes)
    :Process Payment;
  else (No)
    :Reject Request;
    :Notify Customer;
  endif

|Operations|
  :Fulfill Order;
  :Ship Product;

|Customer|
  :Receive Product;
  stop
else (No)
  :Negotiate Terms;
  stop
endif

@enduml
Explanation: This swimlane diagram divides responsibilities among Customer, Sales Representative, Finance, and Operations. Each participant’s actions appear in their designated lane, making handoffs and dependencies explicit. This visualization helps identify excessive handoffs or authority gaps—common sources of delays.
Example 3: Root Cause Analysis Flowchart
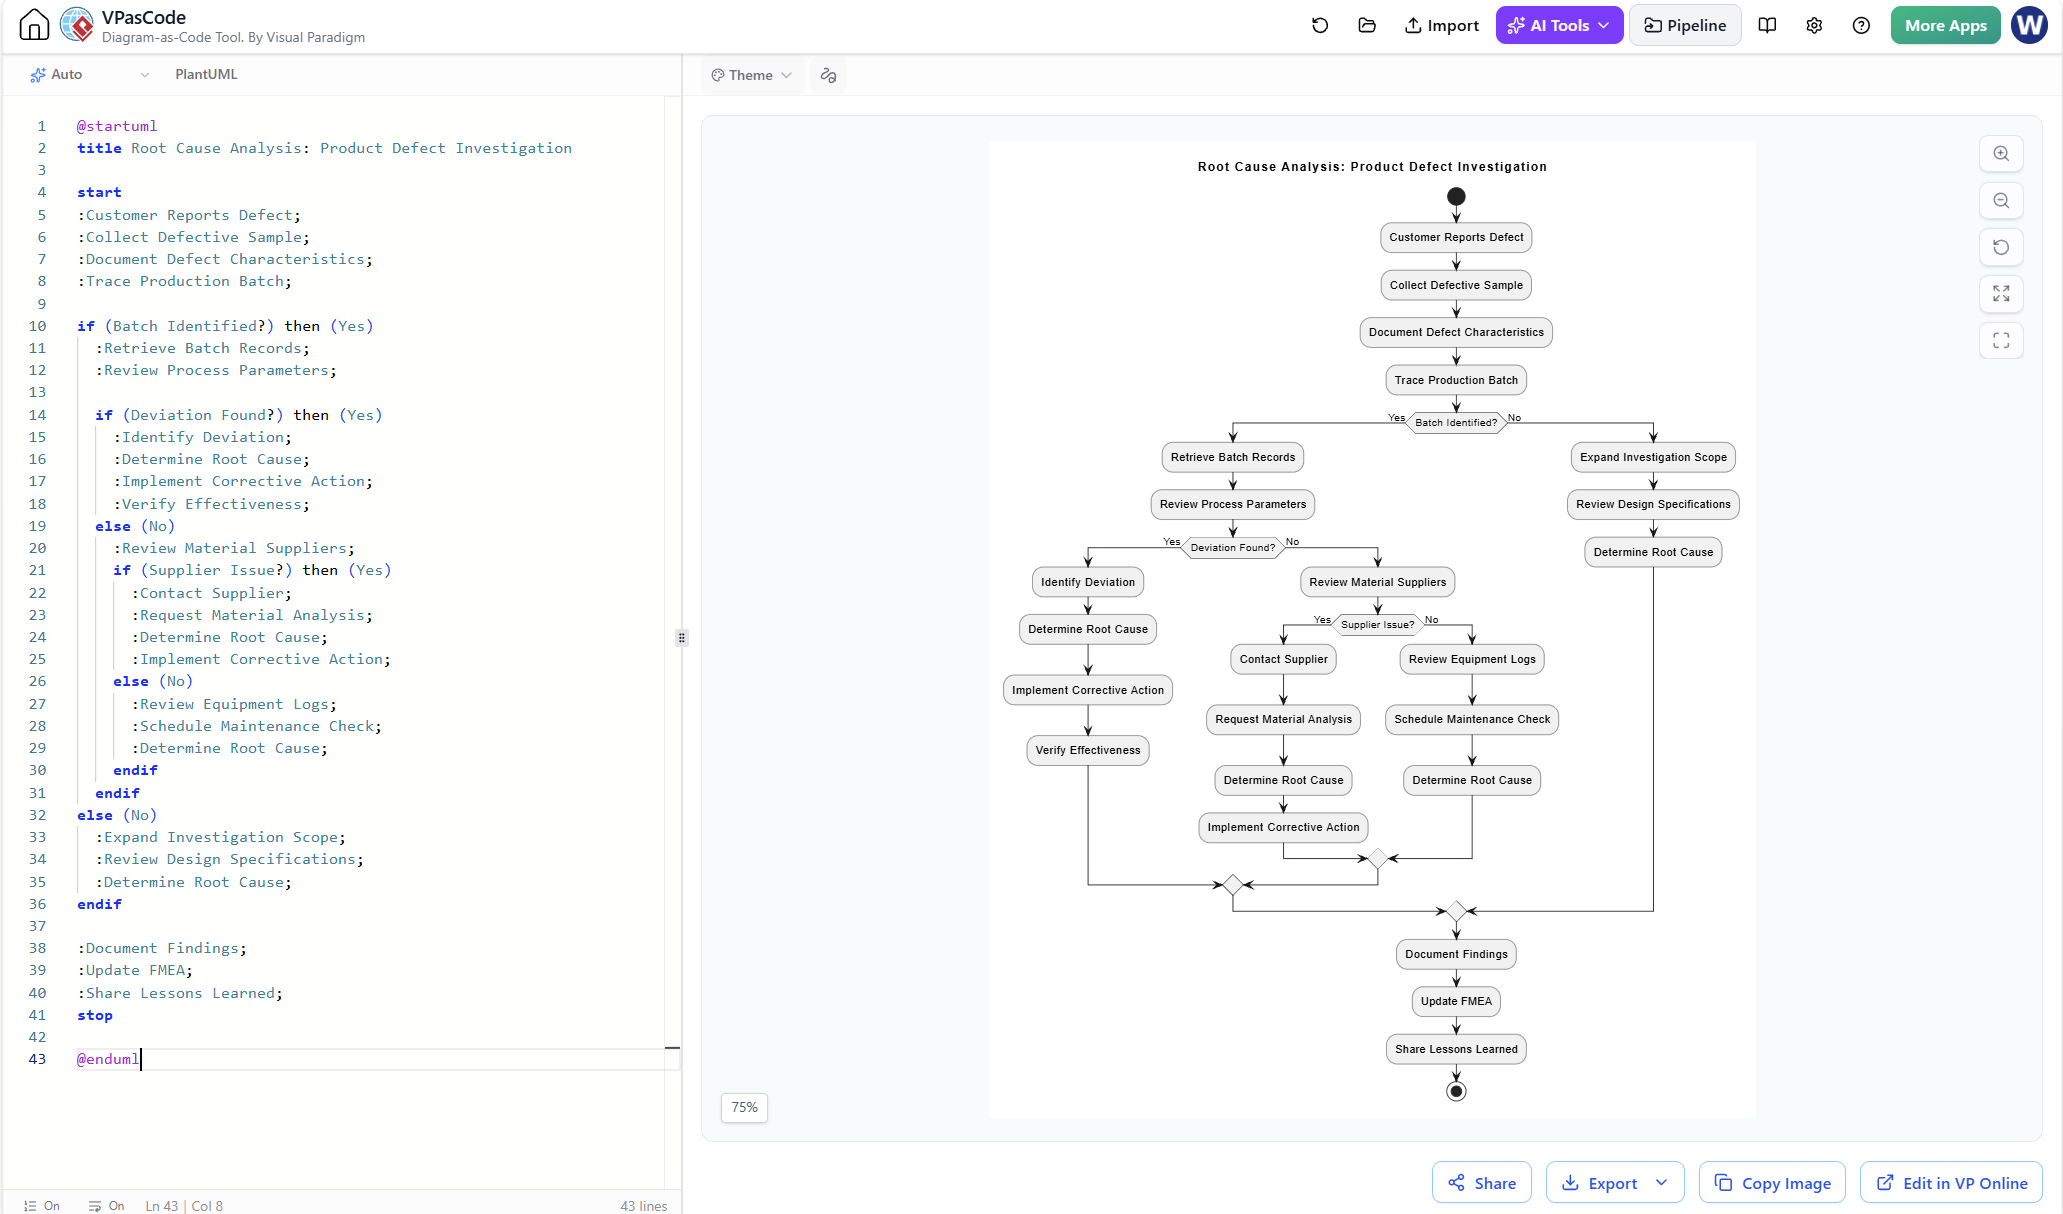
Flowcharts excel at root cause analysis, as shown in this problem-solving example:
@startuml
title Root Cause Analysis: Product Defect Investigation

start
:Customer Reports Defect;
:Collect Defective Sample;
:Document Defect Characteristics;
:Trace Production Batch;

if (Batch Identified?) then (Yes)
  :Retrieve Batch Records;
  :Review Process Parameters;

  if (Deviation Found?) then (Yes)
    :Identify Deviation;
    :Determine Root Cause;
    :Implement Corrective Action;
    :Verify Effectiveness;
  else (No)
    :Review Material Suppliers;
    if (Supplier Issue?) then (Yes)
      :Contact Supplier;
      :Request Material Analysis;
      :Determine Root Cause;
      :Implement Corrective Action;
    else (No)
      :Review Equipment Logs;
      :Schedule Maintenance Check;
      :Determine Root Cause;
    endif
  endif
else (No)
  :Expand Investigation Scope;
  :Review Design Specifications;
  :Determine Root Cause;
endif

:Document Findings;
:Update FMEA;
:Share Lessons Learned;
stop

@enduml
Explanation: This root cause analysis flowchart demonstrates systematic investigation of a product defect. Decision diamonds guide investigators through different hypotheses—process deviations, supplier issues, or equipment problems—until the root cause is identified and corrective action is verified. The flowchart accelerates problem-solving by providing a structured, rational investigation path.
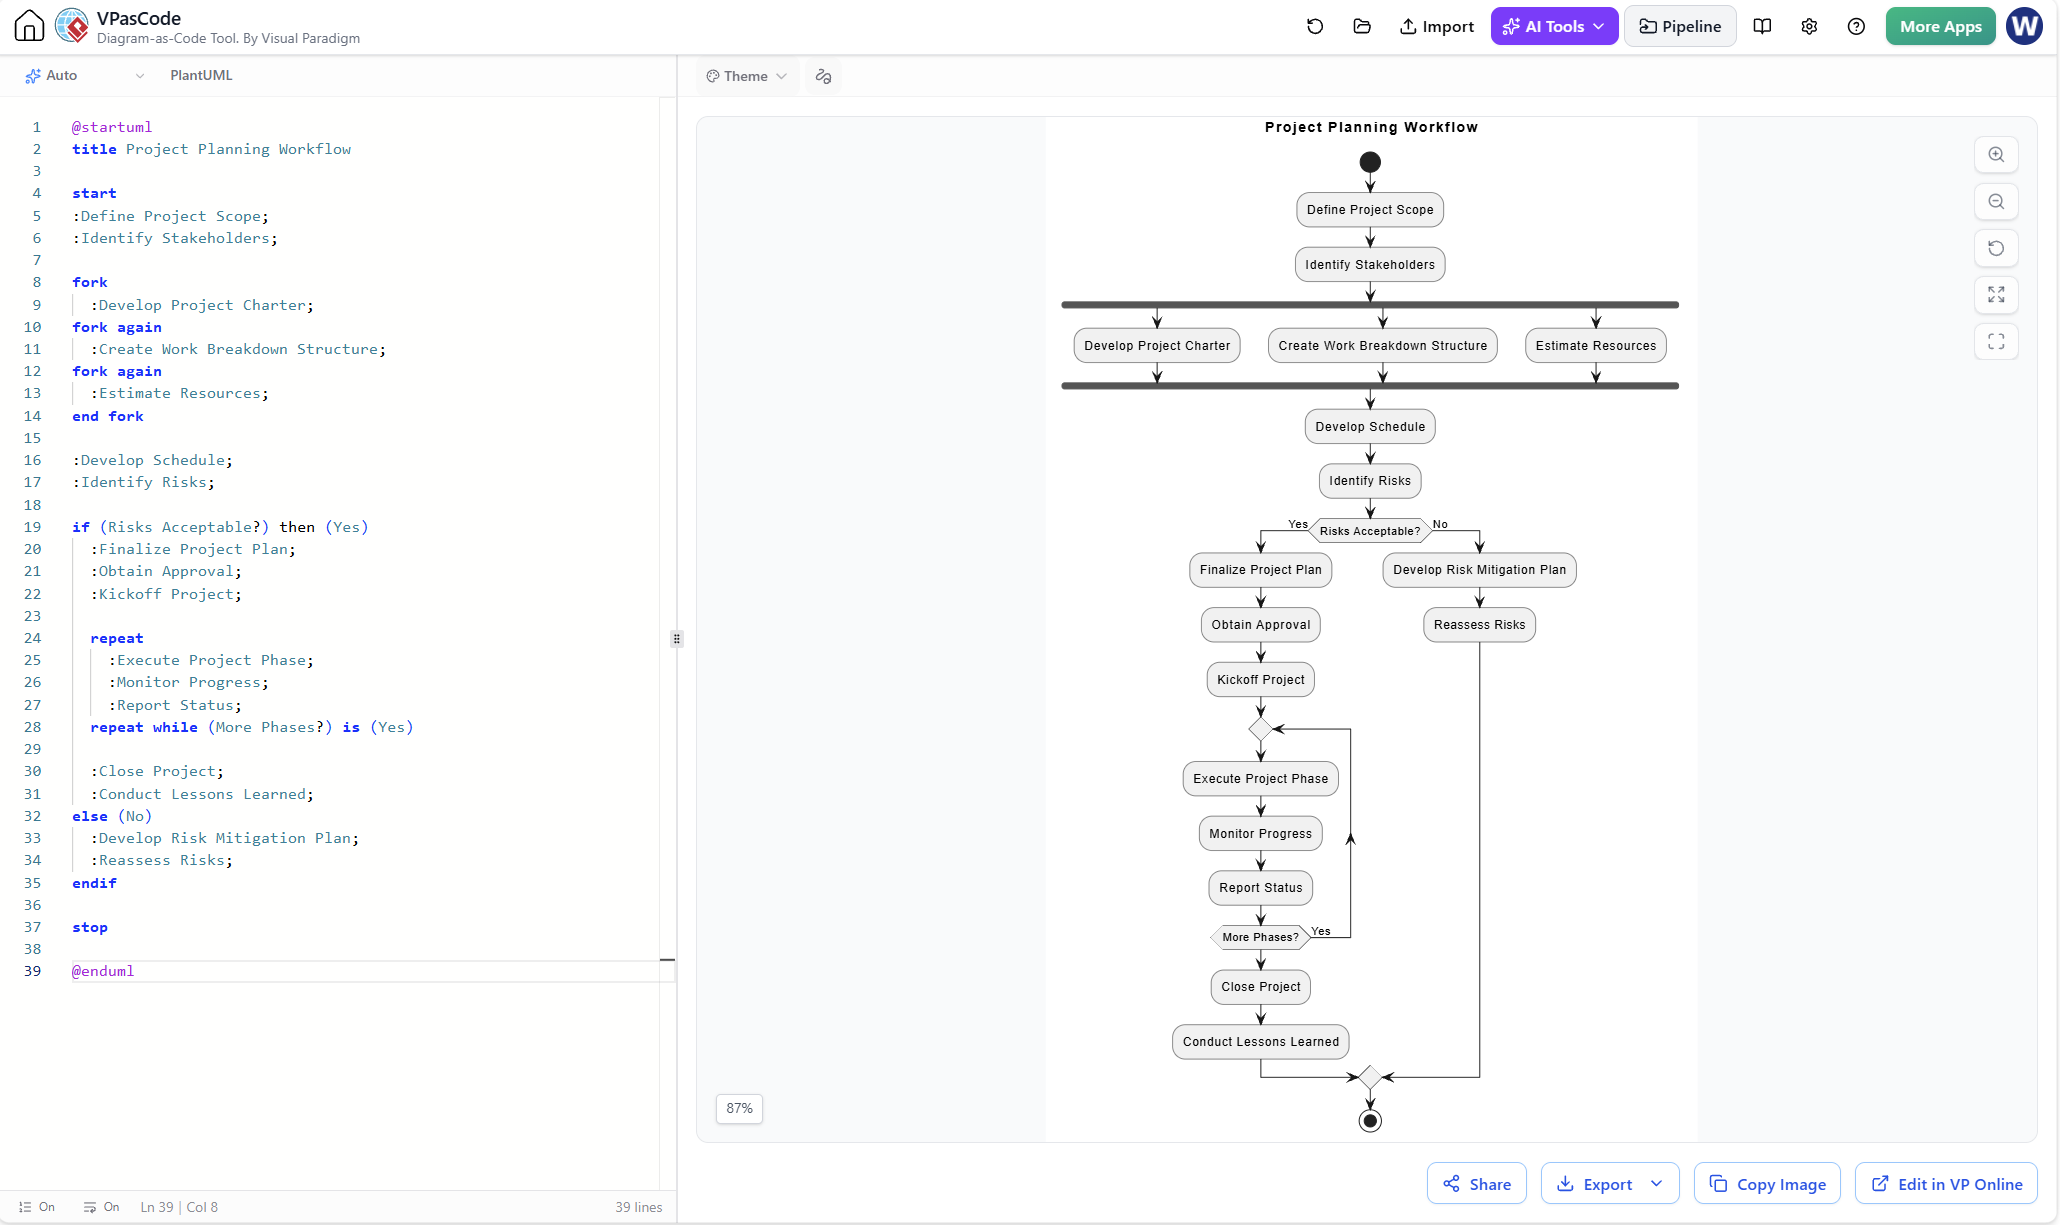
Example 4: Project Planning Flowchart
@startuml
title Project Planning Workflow

start
:Define Project Scope;
:Identify Stakeholders;

fork
  :Develop Project Charter;
fork again
  :Create Work Breakdown Structure;
fork again
  :Estimate Resources;
end fork

:Develop Schedule;
:Identify Risks;

if (Risks Acceptable?) then (Yes)
  :Finalize Project Plan;
  :Obtain Approval;
  :Kickoff Project;

  repeat
    :Execute Project Phase;
    :Monitor Progress;
    :Report Status;
  repeat while (More Phases?) is (Yes)

  :Close Project;
  :Conduct Lessons Learned;
else (No)
  :Develop Risk Mitigation Plan;
  :Reassess Risks;
endif

stop

@enduml
Explanation: This project planning flowchart incorporates parallel activities using the fork construct, showing tasks that occur simultaneously (charter development, WBS creation, resource estimation). The repeat loop demonstrates iterative project execution and monitoring. Flowcharts like this help project managers communicate complex plans and identify critical dependencies.
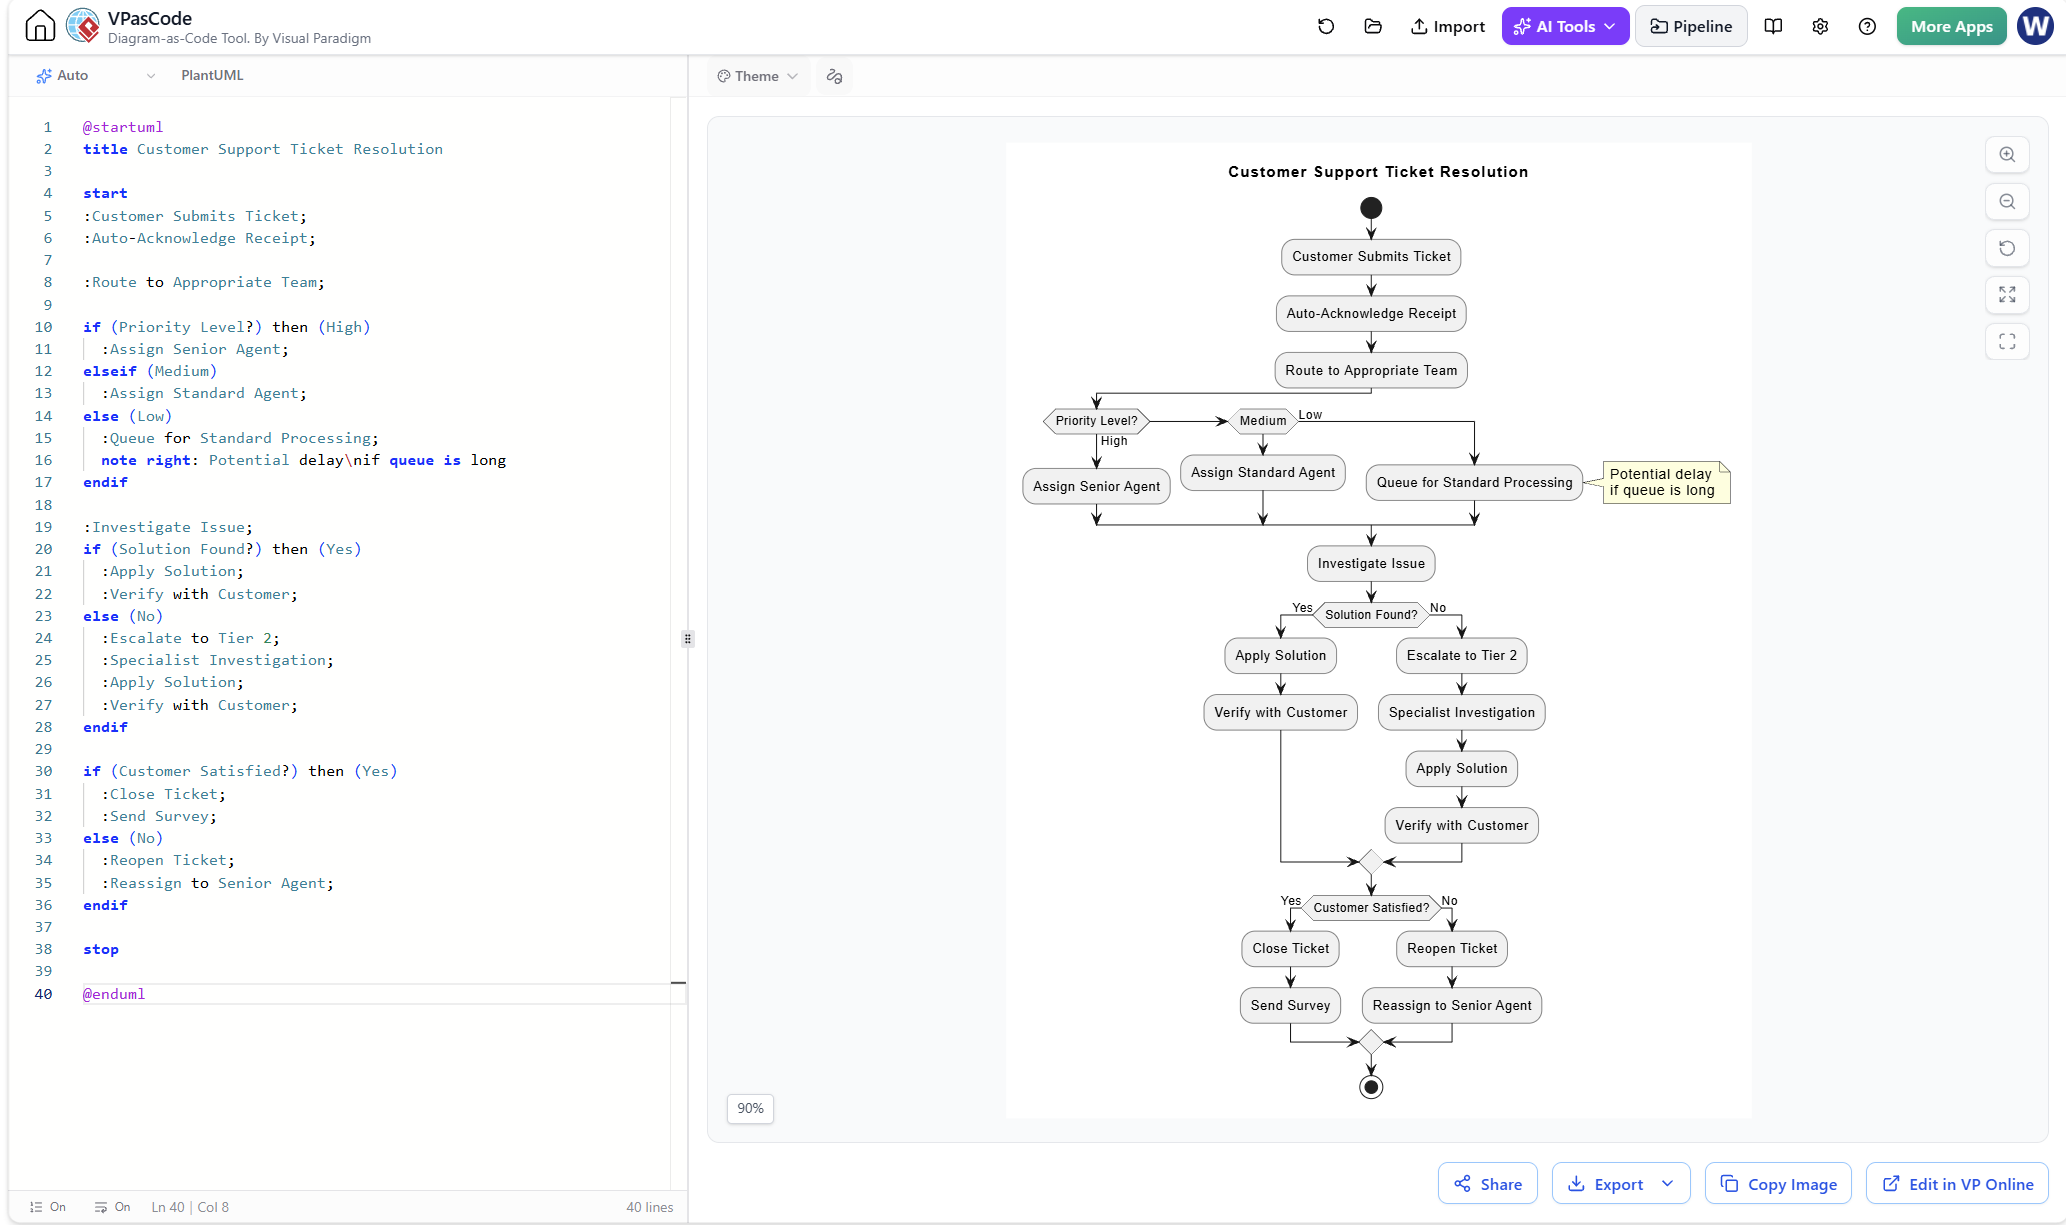
Example 5: Service Process with Delay Identification
@startuml
title Customer Support Ticket Resolution

start
:Customer Submits Ticket;
:Auto-Acknowledge Receipt;

:Route to Appropriate Team;

if (Priority Level?) then (High)
  :Assign Senior Agent;
elseif (Medium)
  :Assign Standard Agent;
else (Low)
  :Queue for Standard Processing;
  note right: Potential delay\nif queue is long
endif

:Investigate Issue;
if (Solution Found?) then (Yes)
  :Apply Solution;
  :Verify with Customer;
else (No)
  :Escalate to Tier 2;
  :Specialist Investigation;
  :Apply Solution;
  :Verify with Customer;
endif

if (Customer Satisfied?) then (Yes)
  :Close Ticket;
  :Send Survey;
else (No)
  :Reopen Ticket;
  :Reassign to Senior Agent;
endif

stop

@enduml
Explanation: This service process flowchart highlights a potential delay point (the low-priority queue) with an annotation. Reviewing such flowcharts helps identify bottlenecks and sources of customer dissatisfaction. The decision points reveal where escalation or reassignment may be needed, enabling process improvement discussions.
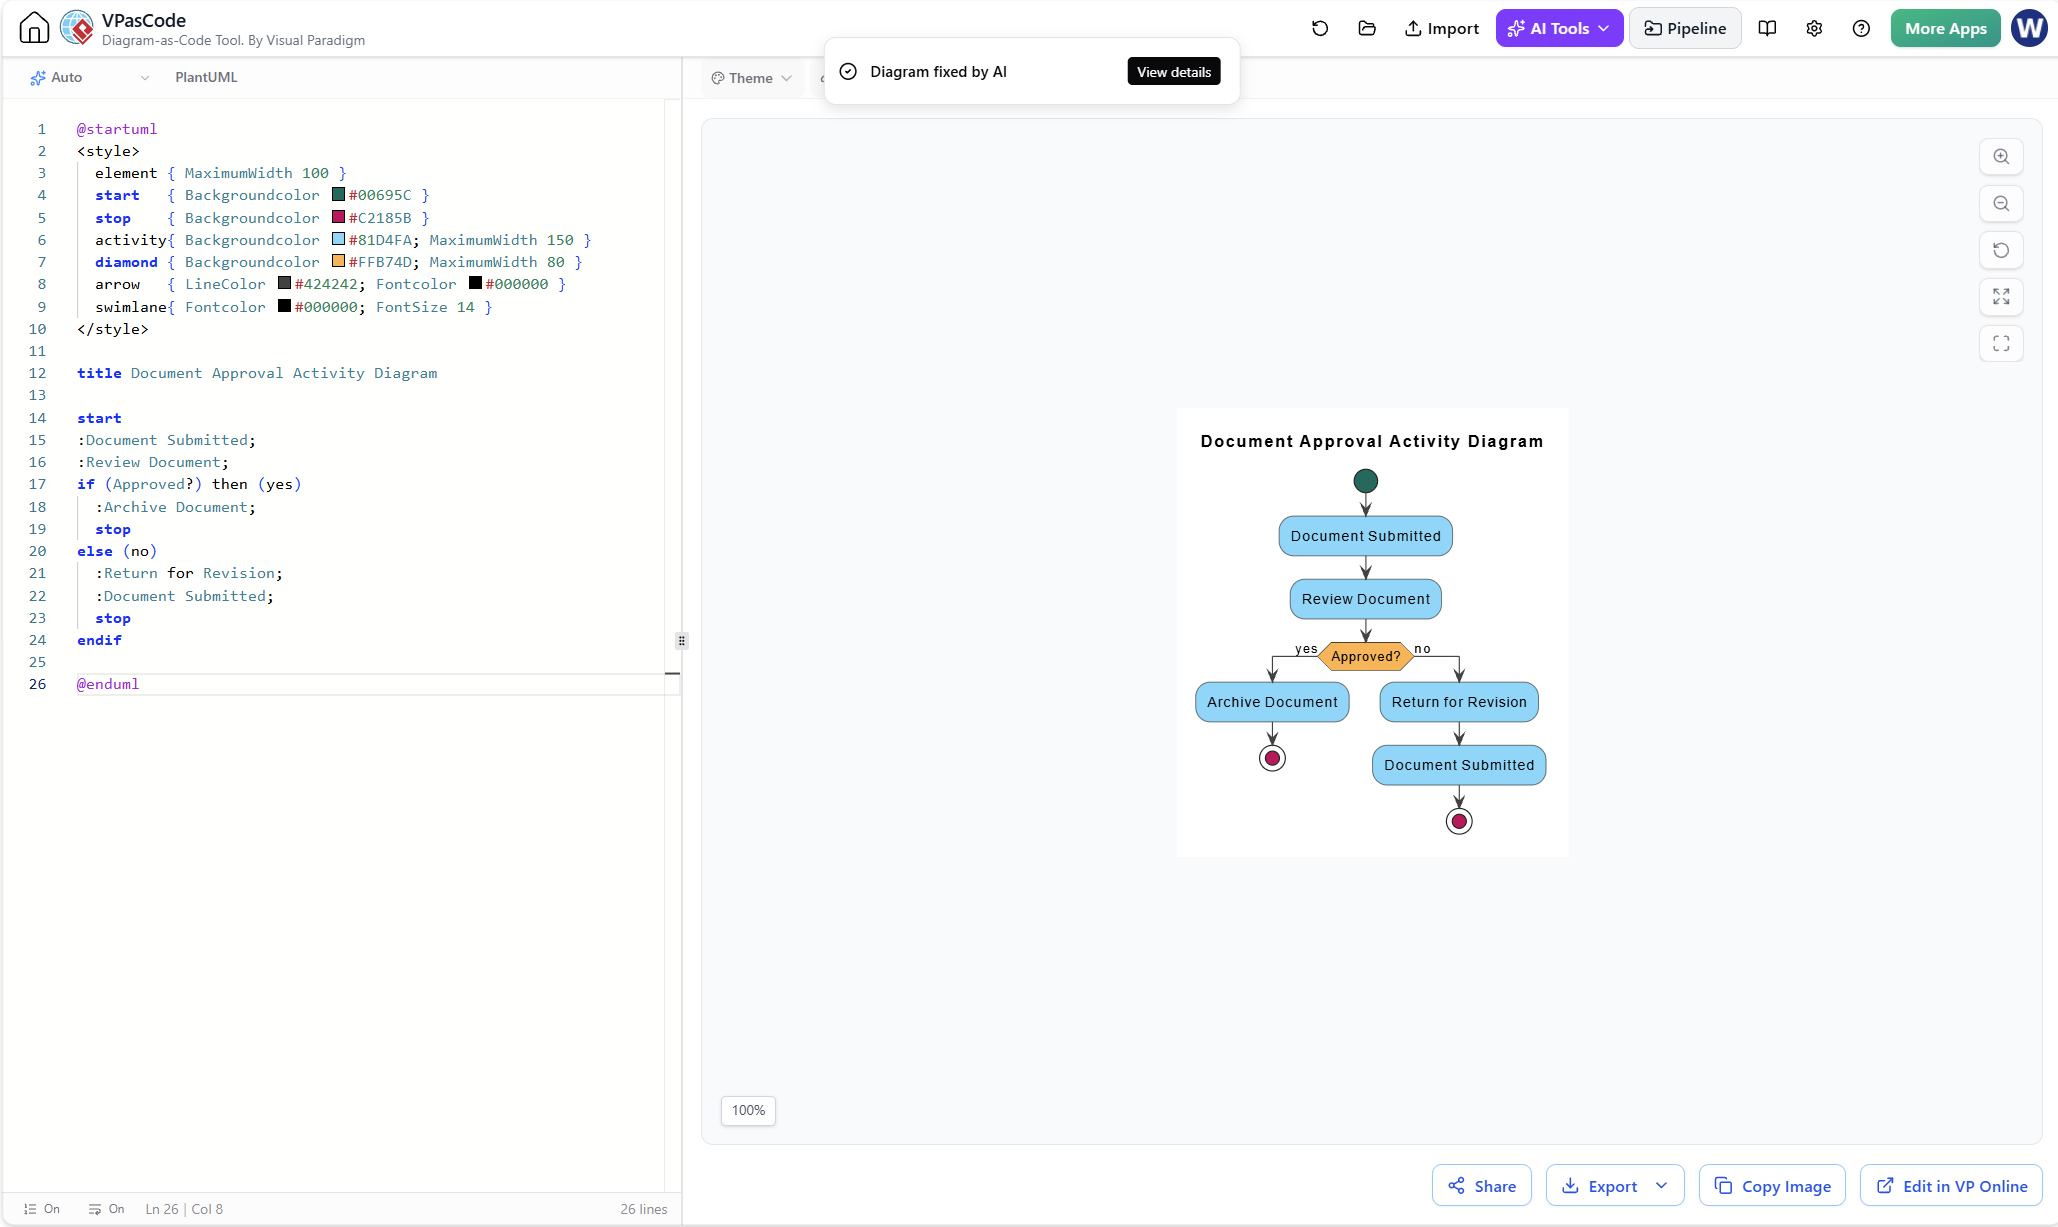
Example 6: Using Visual Paradigm Flowchart + VPasCode
When using Visual Paradigm’s Flowchart tool with VPasCode and AI assistance, the workflow typically involves:
-
AI-assisted generation: Describe your process in natural language, and AI generates initial VPasCode
-
VPasCode editing: Refine the generated code to match actual process details
-
Visualization: The tool renders the code as an editable flowchart diagram
-
Iteration: Update the code and diagram simultaneously as the process evolves
Example VPasCode concept for a simple approval process:
@startuml
title Flowchart: Document Approval

start
:Input: Document Submitted;
:Process: Review Document;
if (Decision: Approved?) then (Yes)
  :Process: Archive Document;
  stop
else (No)
  :Process: Return for Revision;
  :Process: Document Submitted;
endif
stop
@endumlThis approach accelerates flowchart creation while maintaining precision through code-based definition—ideal for version control and collaborative editing.
Conclusion
Flowcharts remain indispensable tools for quality professionals, project managers, and anyone seeking to understand and improve processes. Their power lies in their simplicity and universality: with just a handful of symbols—rectangles, diamonds, arrows, and ovals—complex workflows become transparent and analyzable.
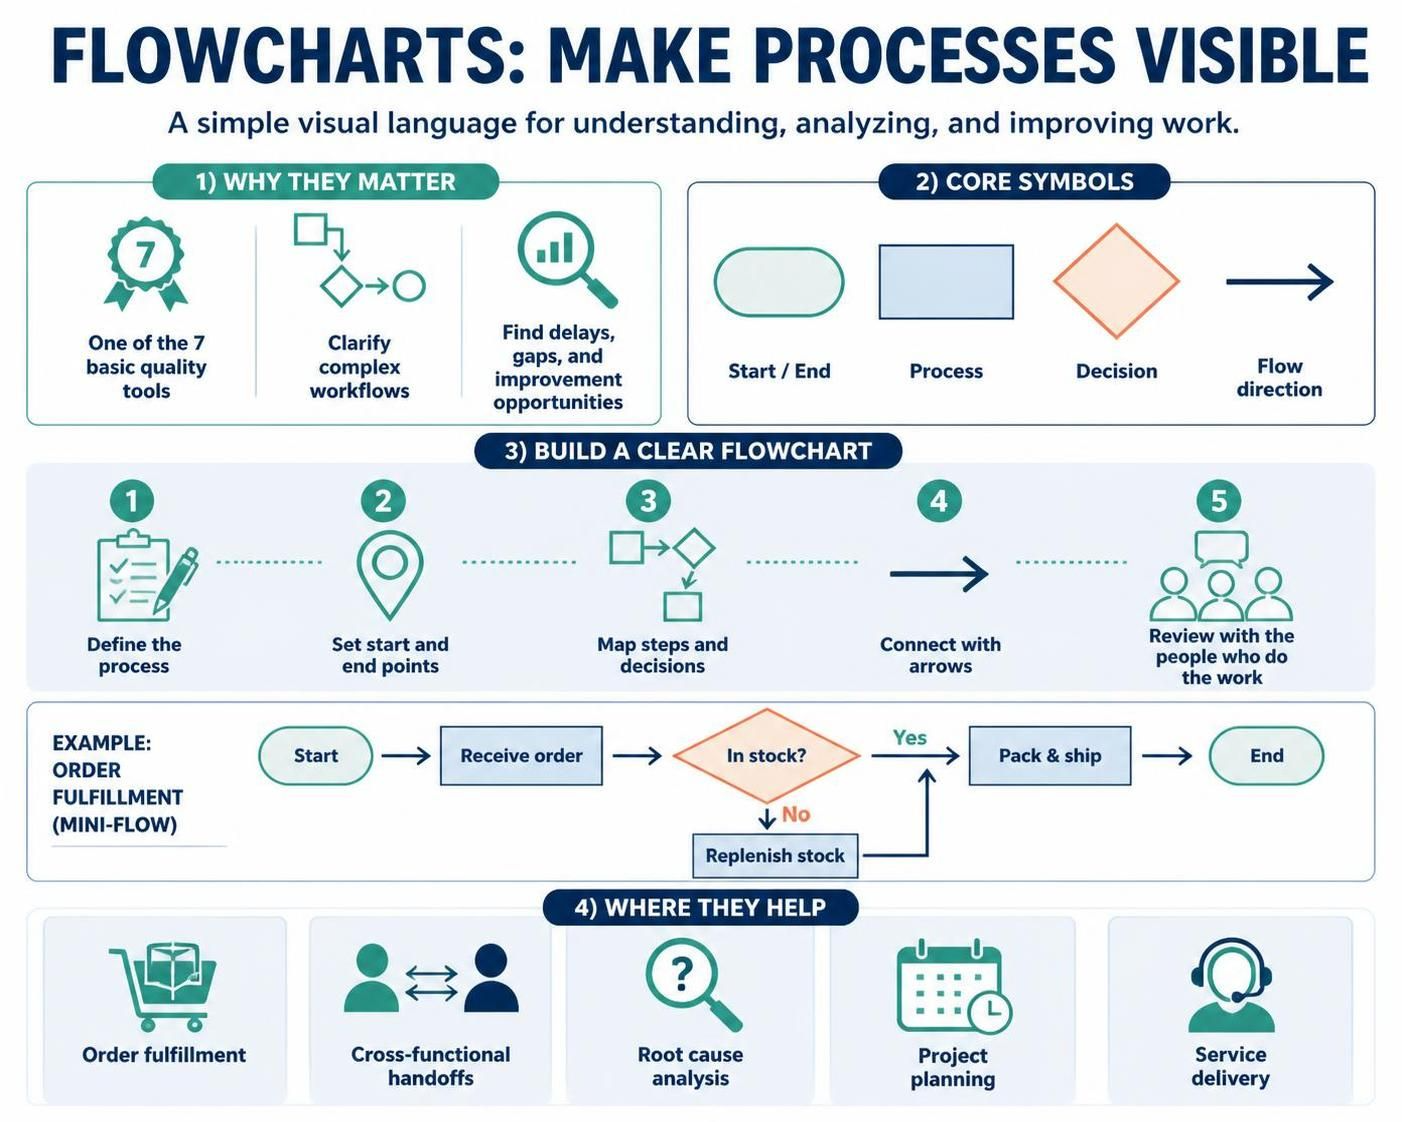
This guide has covered the essential aspects of flowcharts: their purpose as one of the seven basic quality tools, the standard symbols that ensure clear communication, the step-by-step procedure for creating effective diagrams, and practical considerations for maximizing their value. Through multiple PlantUML examples, we’ve demonstrated how flowcharts apply to order fulfillment, cross-functional processes, root cause analysis, project planning, and service delivery.
Key takeaways include:
-
Flowcharts should represent current reality, not idealized processes
-
Process performers should create the flowchart, not technical experts
-
Review and walkthroughs with stakeholders ensure accuracy
-
Post-completion analysis reveals waste, bottlenecks, and improvement opportunities
-
Tools like Visual Paradigm Flowchart + VPasCode + AI accelerate creation while maintaining rigor
Whether drawn on a whiteboard with sticky notes or generated through sophisticated software, the flowchart remains a bridge between complex reality and actionable understanding. By mastering this fundamental tool, you equip yourself and your organization to communicate clearly, identify problems systematically, and improve continuously.