
Introduction
Flowcharts are powerful visual tools that transform complex problem-solving processes into clear, step-by-step diagrams. Whether you’re a beginner learning programming fundamentals or an experienced developer documenting business logic, flowcharts provide a universal language for communicating algorithms and processes.
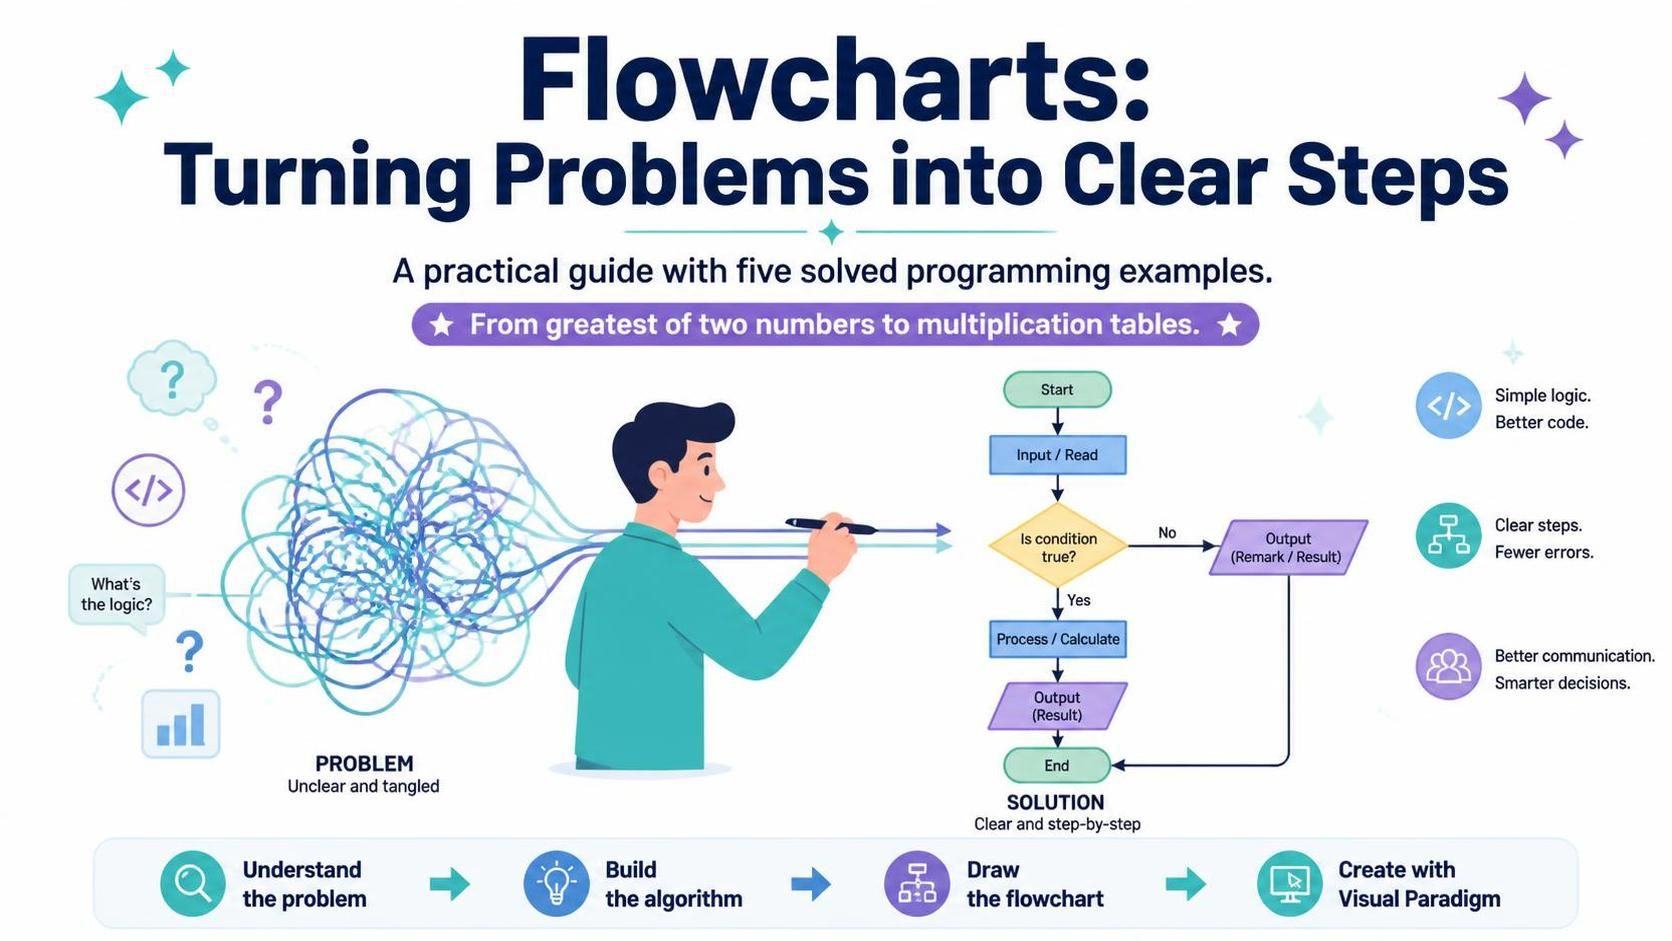
This comprehensive guide walks you through the fundamentals of flowcharts using practical, solved examples. We’ll explore five common programming problems—from finding the greatest of two numbers to generating multiplication tables—and demonstrate how to represent each solution visually. By the end of this article, you’ll understand how to translate algorithms into flowcharts and use modern tools like Visual Paradigm to create professional diagrams effortlessly.
Key Concepts
Before diving into examples, let’s establish the essential building blocks of flowcharts:
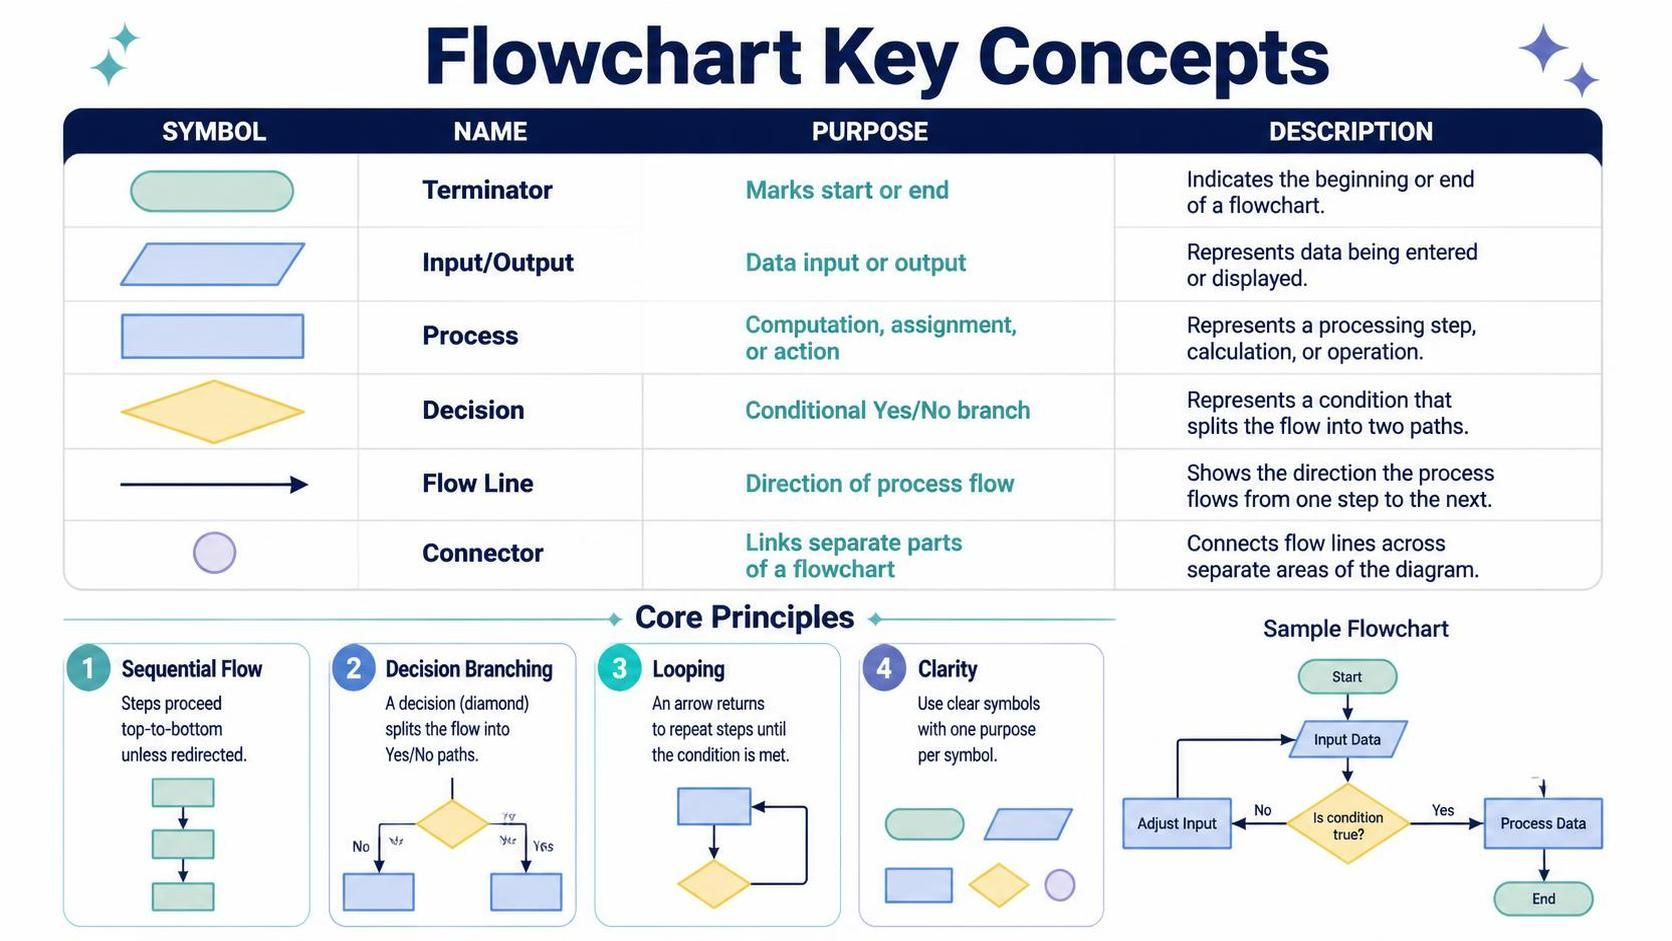
| Symbol | Name | Purpose |
|---|---|---|
| Oval | Terminator | Marks the start or end of a flowchart |
| Parallelogram | Input/Output | Represents data input or output operations |
| Rectangle | Process | Denotes a computation, assignment, or action |
| Diamond | Decision | Represents a conditional branch (Yes/No) |
| Arrow | Flow Line | Indicates the direction of process flow |
| Circle | Connector | Links different parts of a flowchart |
Core Principles
-
Sequential Flow: Processes execute top-to-bottom unless directed otherwise
-
Decision Branching: Diamond shapes split the flow based on conditions
-
Looping: Arrows can loop back to repeat steps until a condition is met
-
Clarity: Each symbol should have a single, clear purpose
Solved Examples with PlantUML Diagrams
Example 1: Find the Greatest of Two Numbers
Algorithm:
-
Start
-
Input two variables
aandb -
Check condition: If
a > b, go to Step 4; else go to Step 5 -
Print “a is greater”
-
Print “b is greater”
-
Stop
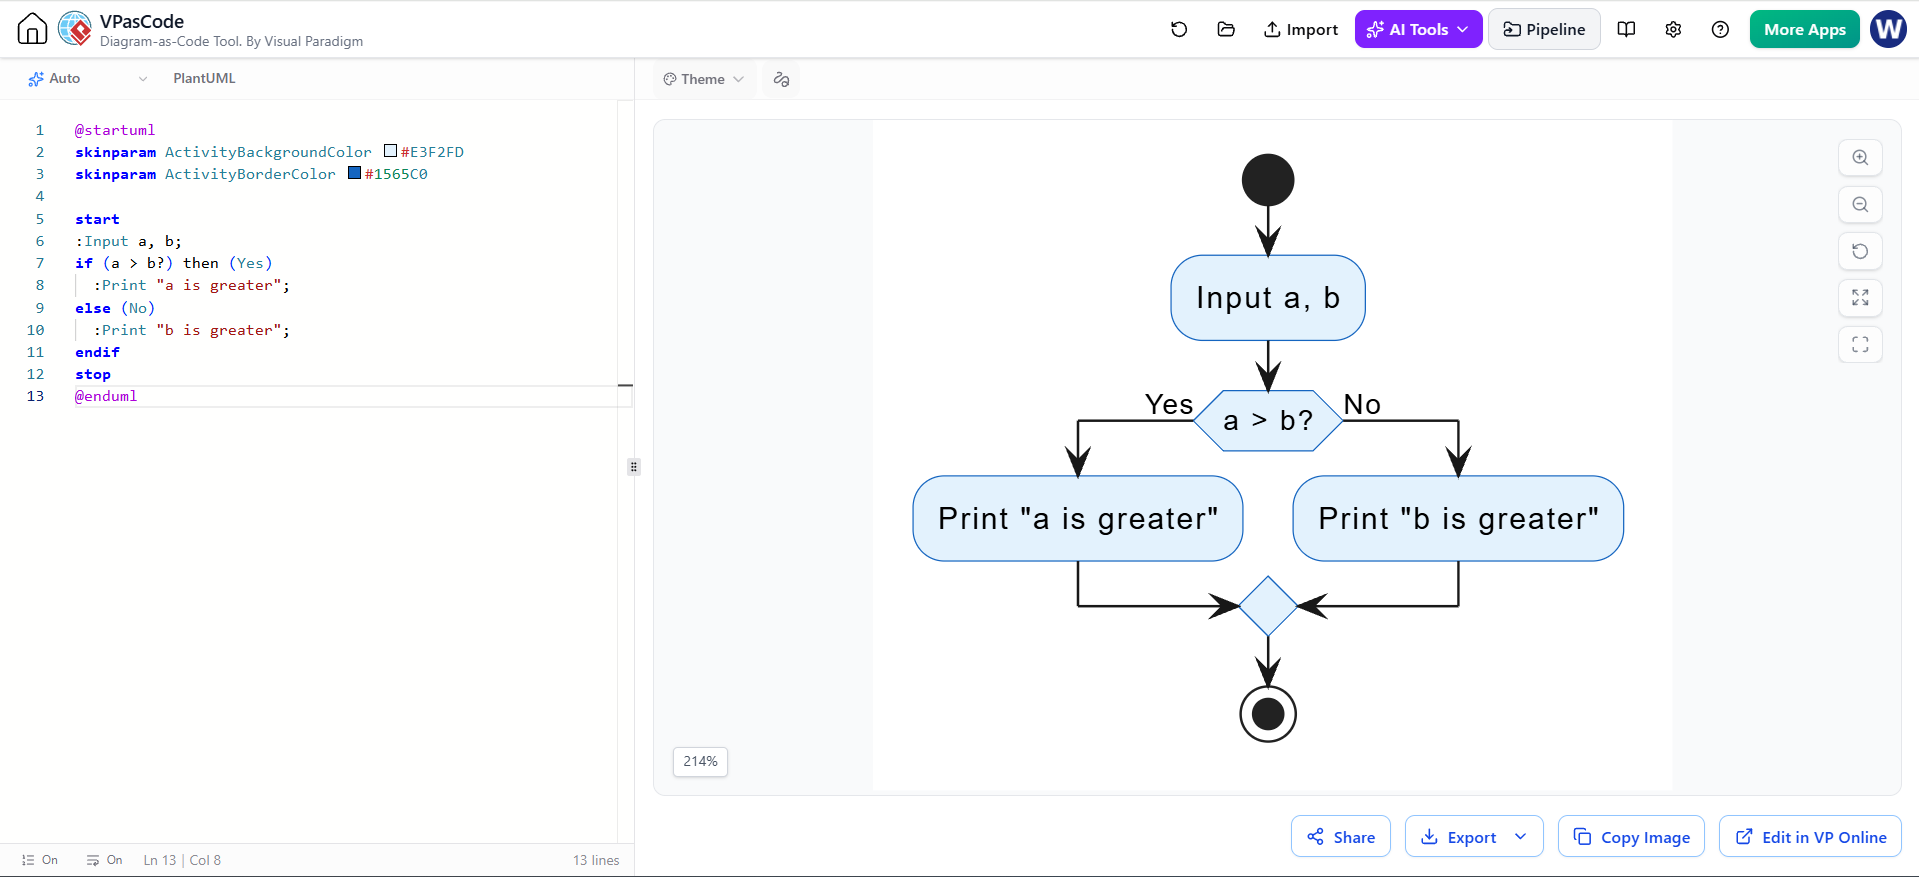
@startuml
skinparam ActivityBackgroundColor #E3F2FD
skinparam ActivityBorderColor #1565C0

start
:Input a, b;
if (a > b?) then (Yes)
  :Print "a is greater";
else (No)
  :Print "b is greater";
endif
stop
@enduml
Explanation: The decision diamond evaluates a > b. If true, the left branch executes; otherwise, the right branch executes. Both paths converge at the end.
Example 2: Check Whether a Number is Odd or Even
Algorithm:
-
Start
-
Input
a -
Check condition: If
a % 2 == 0, go to Step 5; else go to Step 4 -
Print “number is odd”
-
Print “number is even”
-
Stop
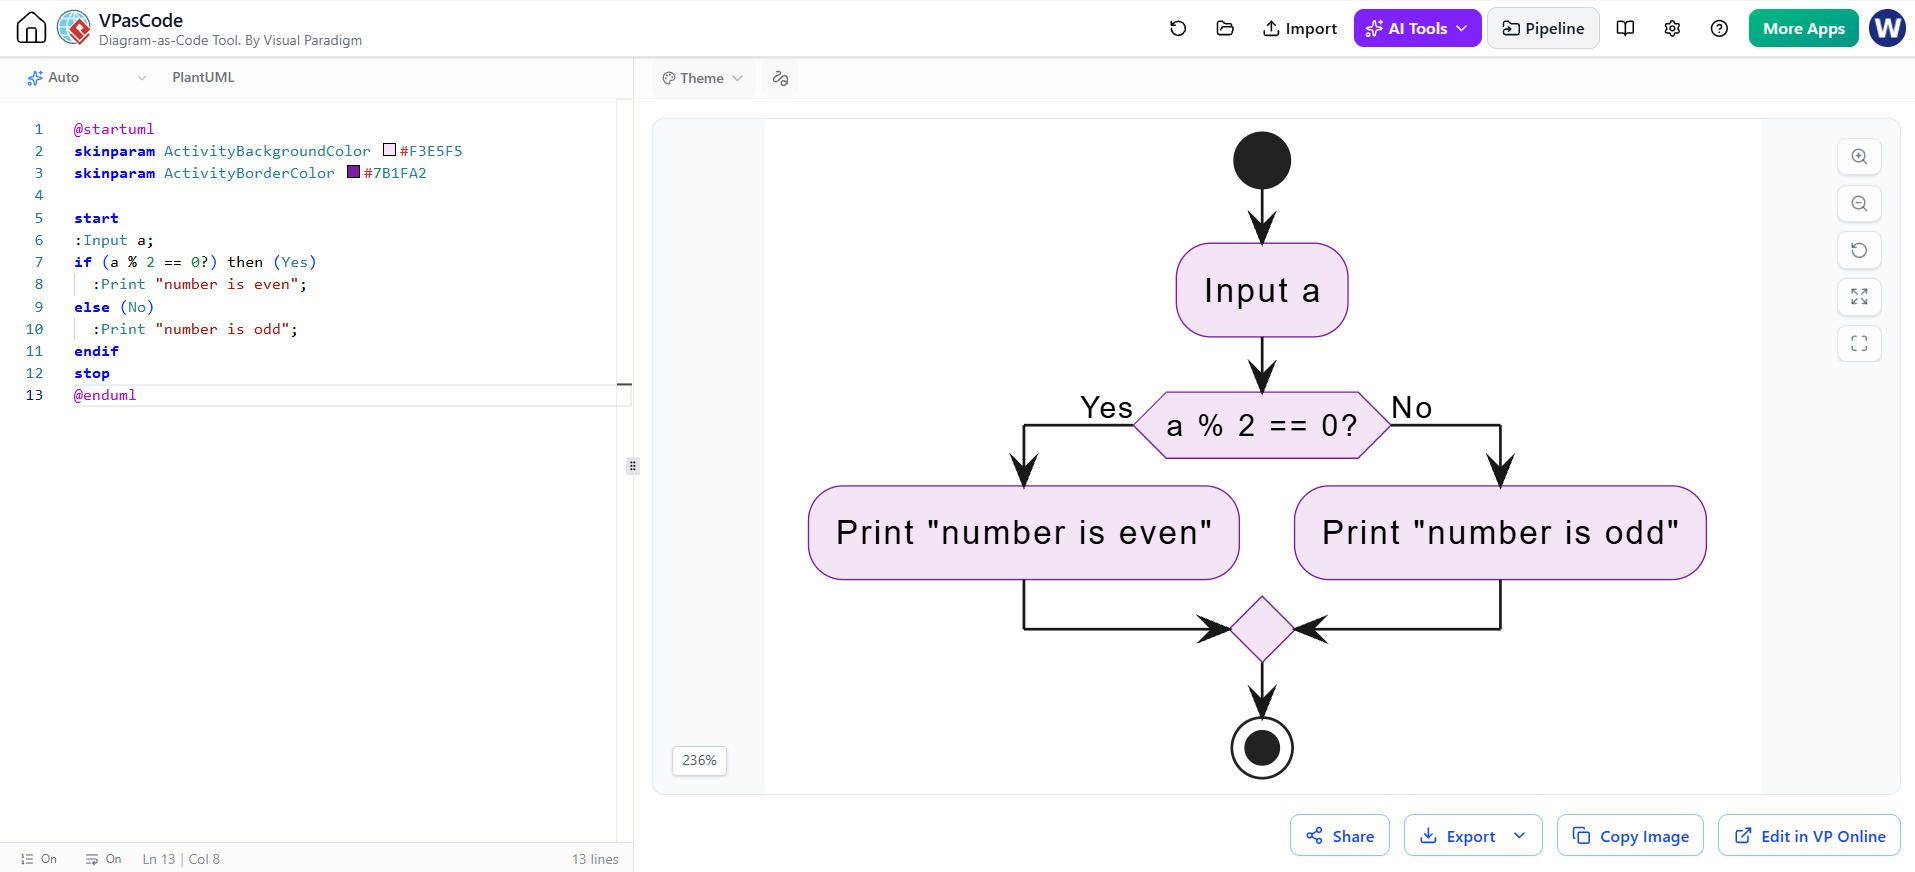
@startuml
skinparam ActivityBackgroundColor #F3E5F5
skinparam ActivityBorderColor #7B1FA2

start
:Input a;
if (a % 2 == 0?) then (Yes)
  :Print "number is even";
else (No)
  :Print "number is odd";
endif
stop
@enduml
Explanation: The modulo operator % returns the remainder. If the remainder is zero, the number is even; otherwise, it’s odd.
Example 3: Print the Input Number 5 Times
Algorithm:
-
Start
-
Input number
a -
Initialize
c = 1 -
Check condition: If
c <= 5, go to Step 5; else go to Step 7 -
Print
a -
c = c + 1, go to Step 4 -
Stop
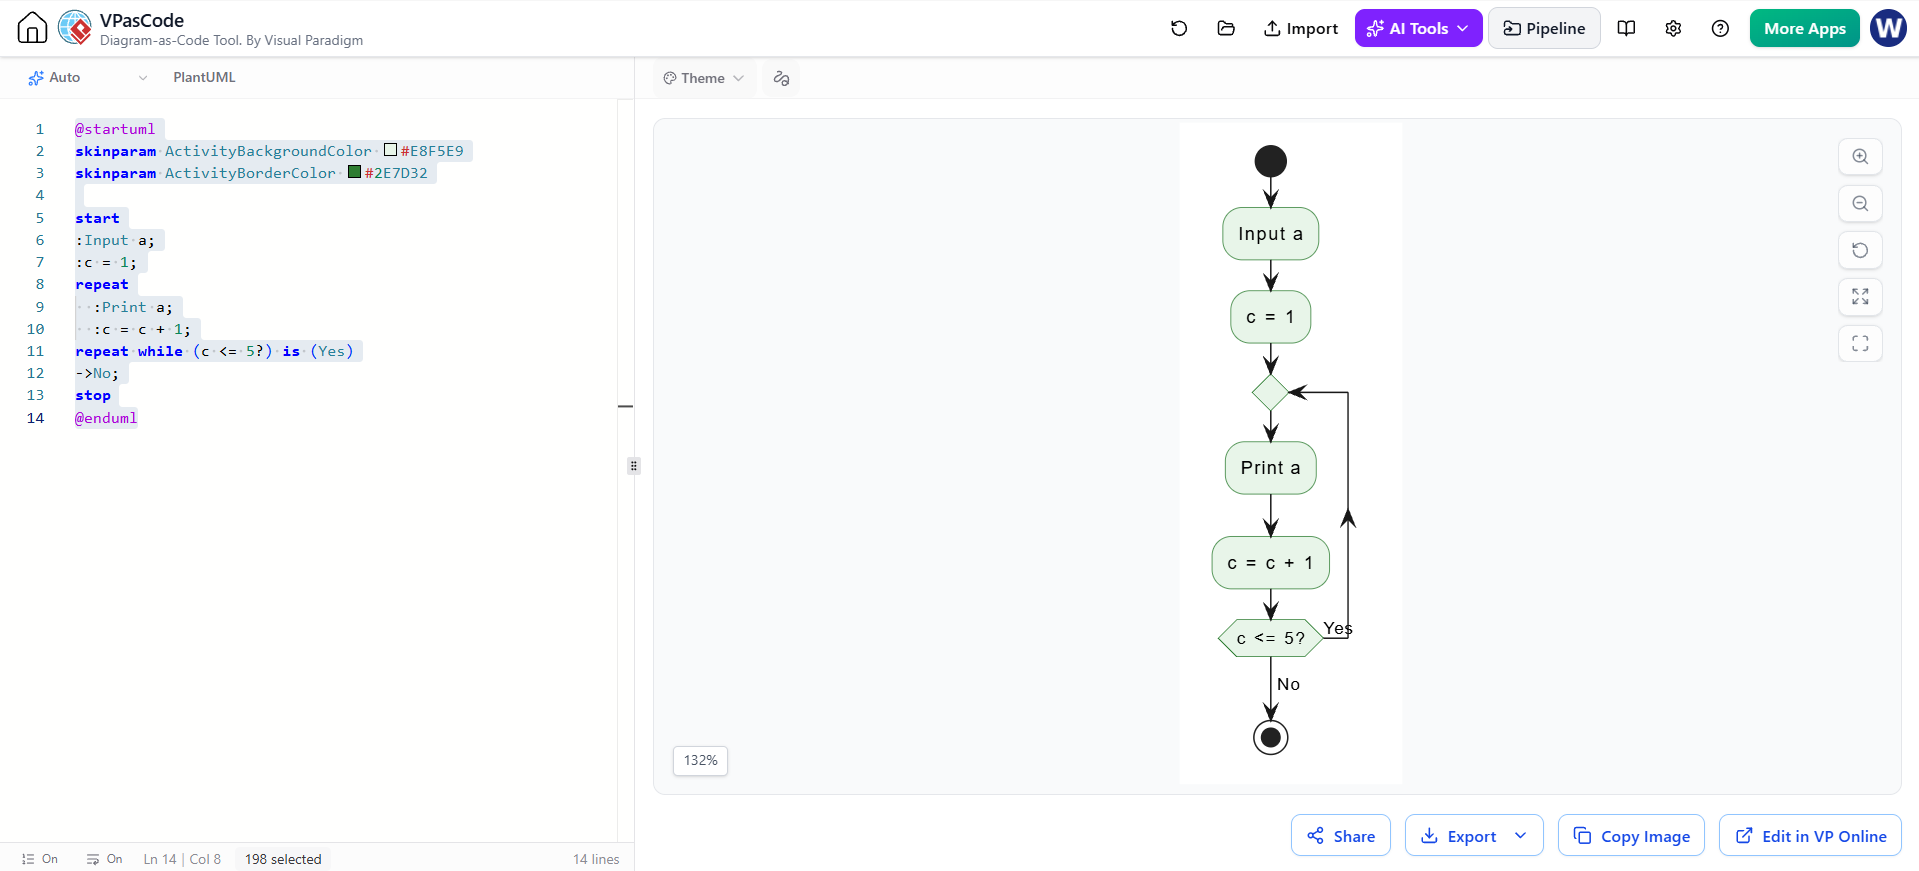
@startuml
skinparam ActivityBackgroundColor #E8F5E9
skinparam ActivityBorderColor #2E7D32

start
:Input a;
:c = 1;
repeat
  :Print a;
  :c = c + 1;
repeat while (c <= 5?) is (Yes)
->No;
stop
@enduml
Explanation: This introduces a loop structure. The counter c tracks iterations. The loop repeats while c <= 5, printing the input number five times.
Example 4: Print Numbers from 1 to 10
Algorithm:
-
Start
-
Initialize
c = 1 -
Check condition: If
c < 11, go to Step 4; else go to Step 6 -
Print
c -
c = c + 1, go to Step 3 -
Stop
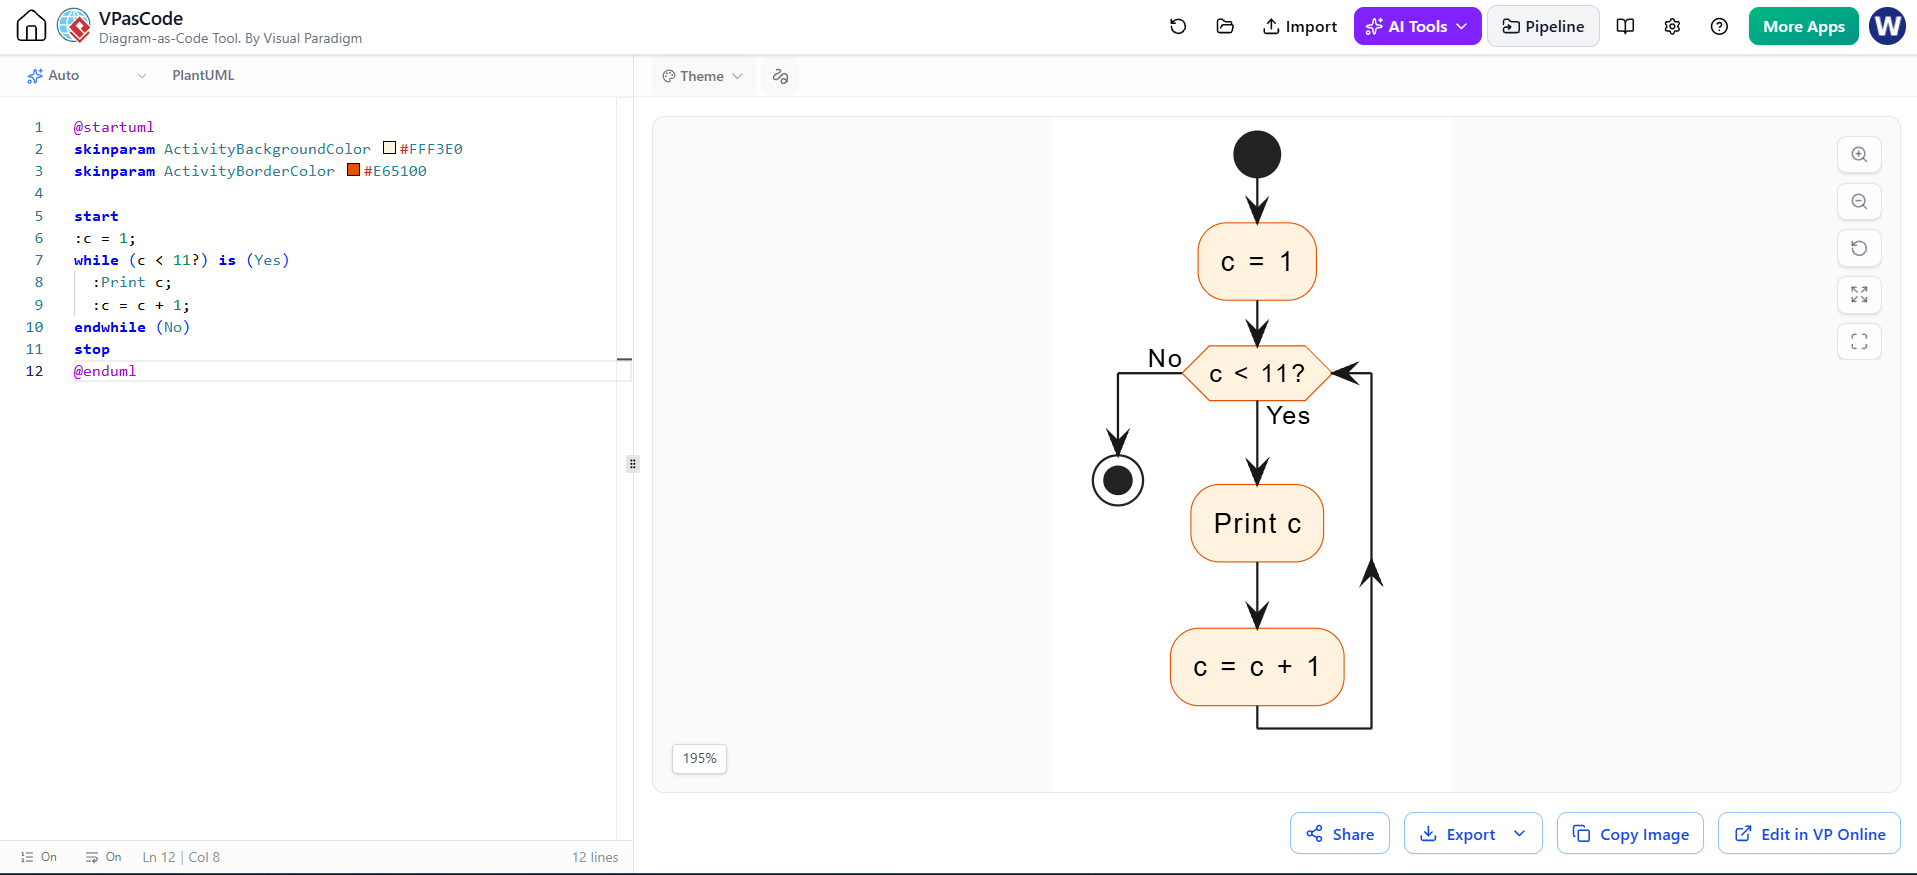
@startuml
skinparam ActivityBackgroundColor #FFF3E0
skinparam ActivityBorderColor #E65100

start
:c = 1;
while (c < 11?) is (Yes)
  :Print c;
  :c = c + 1;
endwhile (No)
stop
@enduml
Explanation: A while loop checks the condition before each iteration. The loop runs for c = 1, 2, ..., 10, printing each number until c reaches 11.
Example 5: Print the First 5 Multiples of 3
Algorithm:
-
Start
-
Initialize
c = 1 -
Check condition: If
c < 6, go to Step 4; else go to Step 6 -
Print
3 * c -
c += 1, go to Step 3 -
Stop
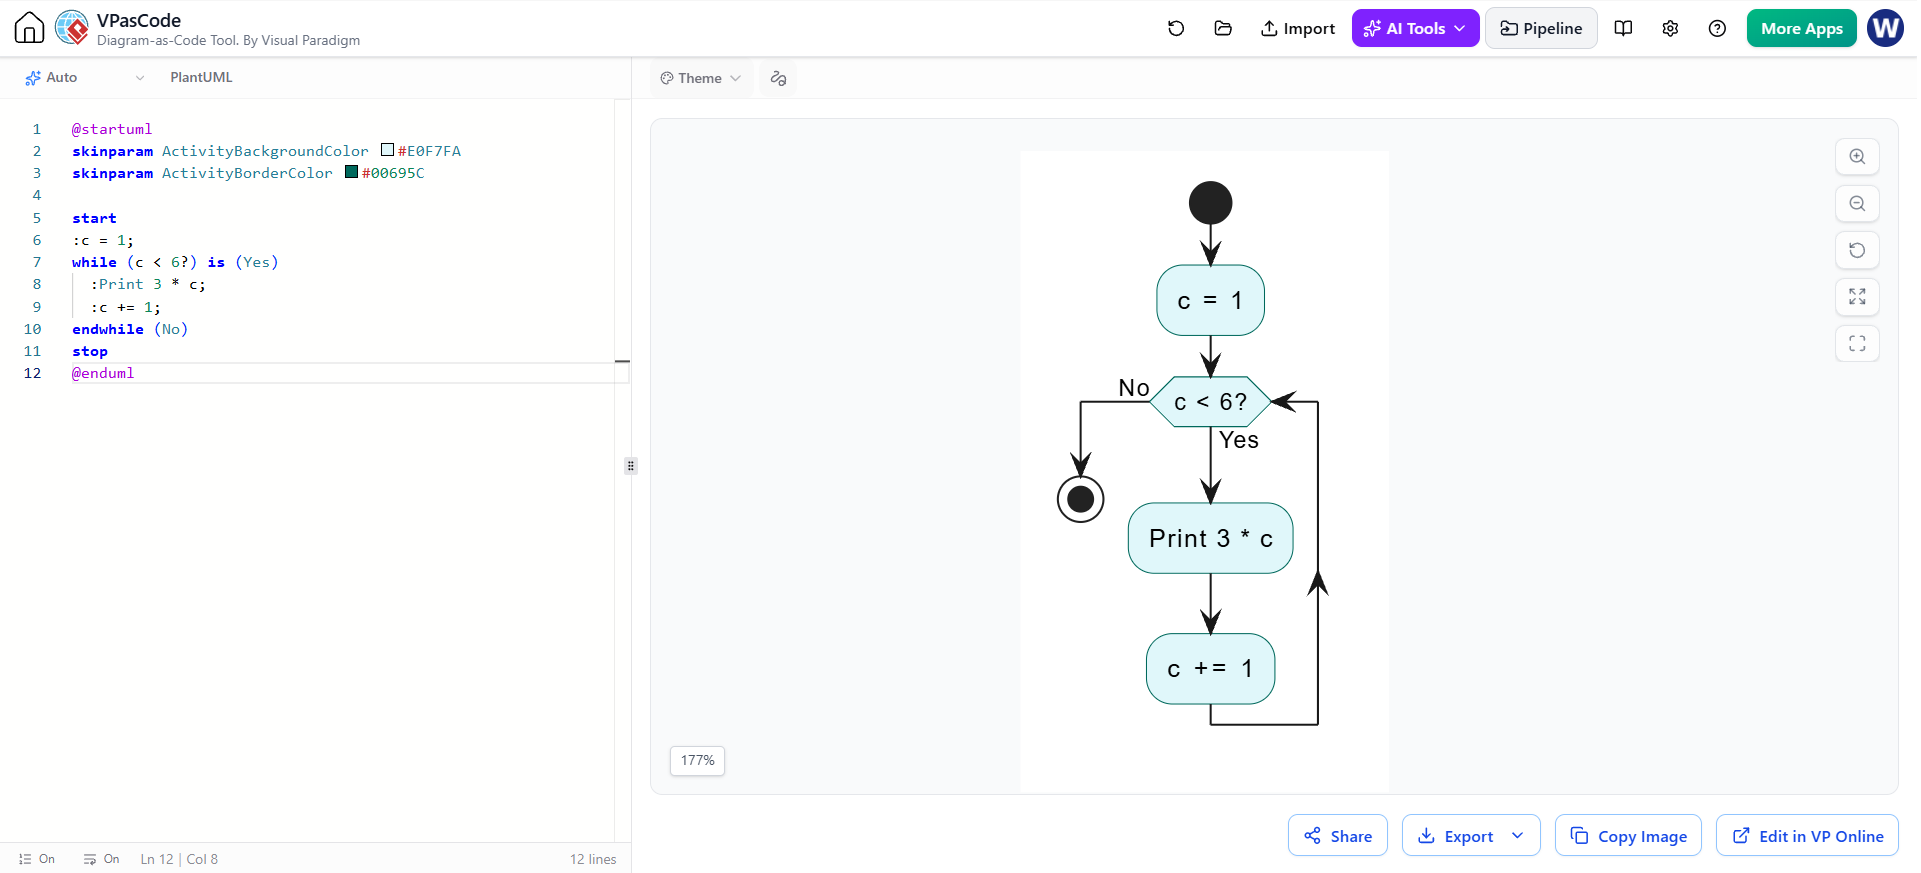
@startuml
skinparam ActivityBackgroundColor #E0F7FA
skinparam ActivityBorderColor #00695C

start
:c = 1;
while (c < 6?) is (Yes)
  :Print 3 * c;
  :c += 1;
endwhile (No)
stop
@enduml
Explanation: This loop multiplies the counter by 3 during each iteration, producing the output: 3, 6, 9, 12, 15.
Tooling: Visual Paradigm Flowchart + VPasCode + AI
Modern diagramming has been revolutionized by AI-assisted tools. Visual Paradigm offers a complete suite for flowchart creation:

Visual Paradigm Flowchart
-
Drag-and-Drop Interface: Intuitive symbol palette with standard flowchart shapes
-
Smart Alignment: Automatic grid snapping and connector routing
-
Rich Formatting: Custom colors, fonts, and themes for professional output
-
Export Options: PNG, SVG, PDF, and direct sharing links
VPasCode (Visual Paradigm as Code)
-
Text-to-Diagram: Write PlantUML or Mermaid code and generate diagrams instantly
-
Version Control Friendly: Store diagrams as text for Git integration
-
Rapid Prototyping: Perfect for developers who prefer keyboard over mouse
AI-Assisted Diagramming
-
Natural Language Input: Describe your process in plain English—AI generates the flowchart
-
Auto-Completion: AI suggests next steps based on context
-
Error Detection: Identifies logic gaps like missing decision branches
-
Algorithm-to-Flowchart: Paste pseudocode and let AI convert it into a diagram
Workflow Tip: Start with a natural language description → let AI draft the flowchart → refine using VPasCode → polish in Visual Paradigm’s visual editor.
Conclusion
Flowcharts remain one of the most effective tools for visualizing algorithms and processes. Through the five solved examples in this guide, we’ve explored essential concepts—from basic sequential flow and decision branching to iteration loops—using PlantUML for code-based diagram generation.
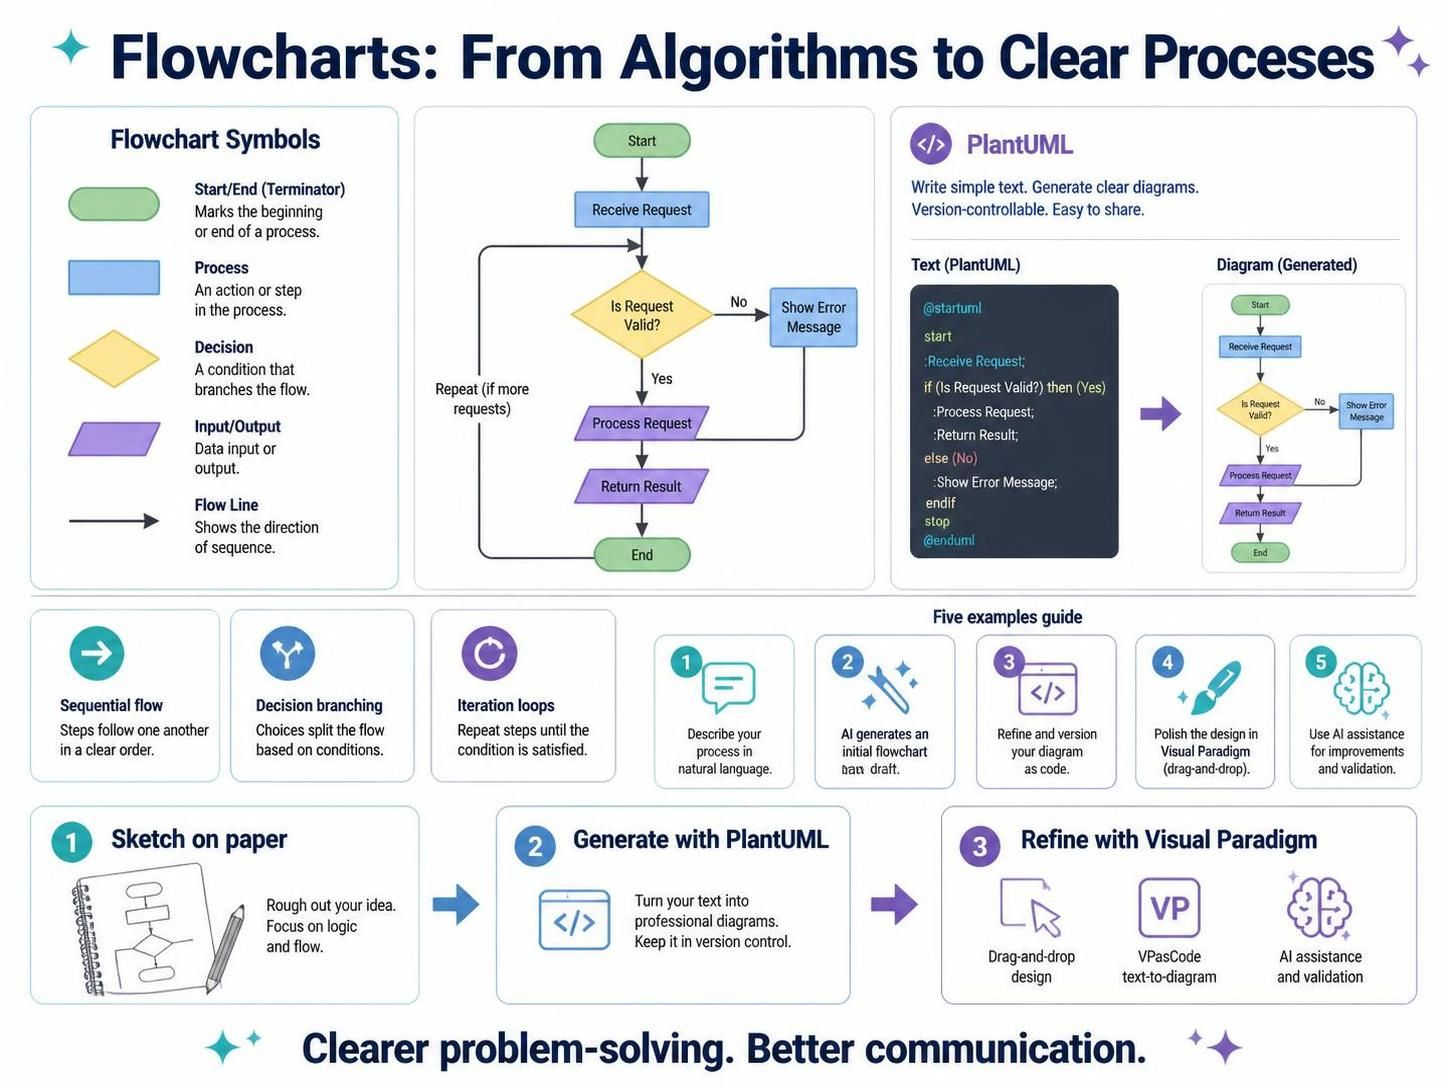
Key Takeaways:
-
Flowcharts use standard symbols (ovals, rectangles, diamonds, parallelograms) to represent different operations
-
Decision structures enable branching logic; loops enable repetition
-
PlantUML provides a text-based, version-controllable approach to diagram creation
-
Visual Paradigm combines drag-and-drop ease with VPasCode flexibility and AI assistance, making it an ideal tool for both beginners and professionals
Whether you’re designing a simple odd/even checker or documenting complex business workflows, mastering flowcharts will sharpen your problem-solving skills and improve communication with stakeholders. Start with pen and paper, migrate to PlantUML for precision, and leverage AI-powered tools like Visual Paradigm to bring your diagrams to life.
Ready to create your first flowchart? Try Visual Paradigm’s free online editor or paste one of the PlantUML examples above into VPasCode to see it rendered instantly.