


In the landscape of modern governance, risk, and compliance (GRC), visibility into data movement is non-negotiable. Regulatory bodies do not merely inspect code or review policies; they demand proof of how information travels through an organization’s ecosystem. Data Flow Diagrams (DFDs) serve as the visual evidence required to demonstrate control over sensitive data. These diagrams map the journey of information from creation to deletion, identifying every process, store, and external interaction involved.
When preparing for a regulatory audit, the distinction between a casual sketch and a compliant artifact is significant. A robust DFD acts as a blueprint for auditors, allowing them to trace data lineage without needing to interrogate every individual system. This guide details the construction, maintenance, and strategic application of Data Flow Diagrams to meet strict compliance standards such as GDPR, HIPAA, and SOX.
🛡️ The Role of DFDs in Regulatory Audits
Regulatory frameworks increasingly require organizations to understand their data architecture. An auditor cannot verify compliance if the flow of information remains opaque. Data Flow Diagrams bridge this gap by translating complex technical architectures into understandable visual representations.
- Transparency: DFDs provide a clear view of where data resides and how it moves.
- Accountability: Every process and data store is assigned an owner or function.
- Gap Analysis: Visualizing flows reveals missing security controls or unauthorized paths.
- Documentation: They serve as living documents that update alongside system changes.
Without a structured diagram, auditors must rely on interviews and fragmented documentation, which increases the risk of oversight. A well-crafted DFD reduces audit friction and demonstrates a mature control environment.
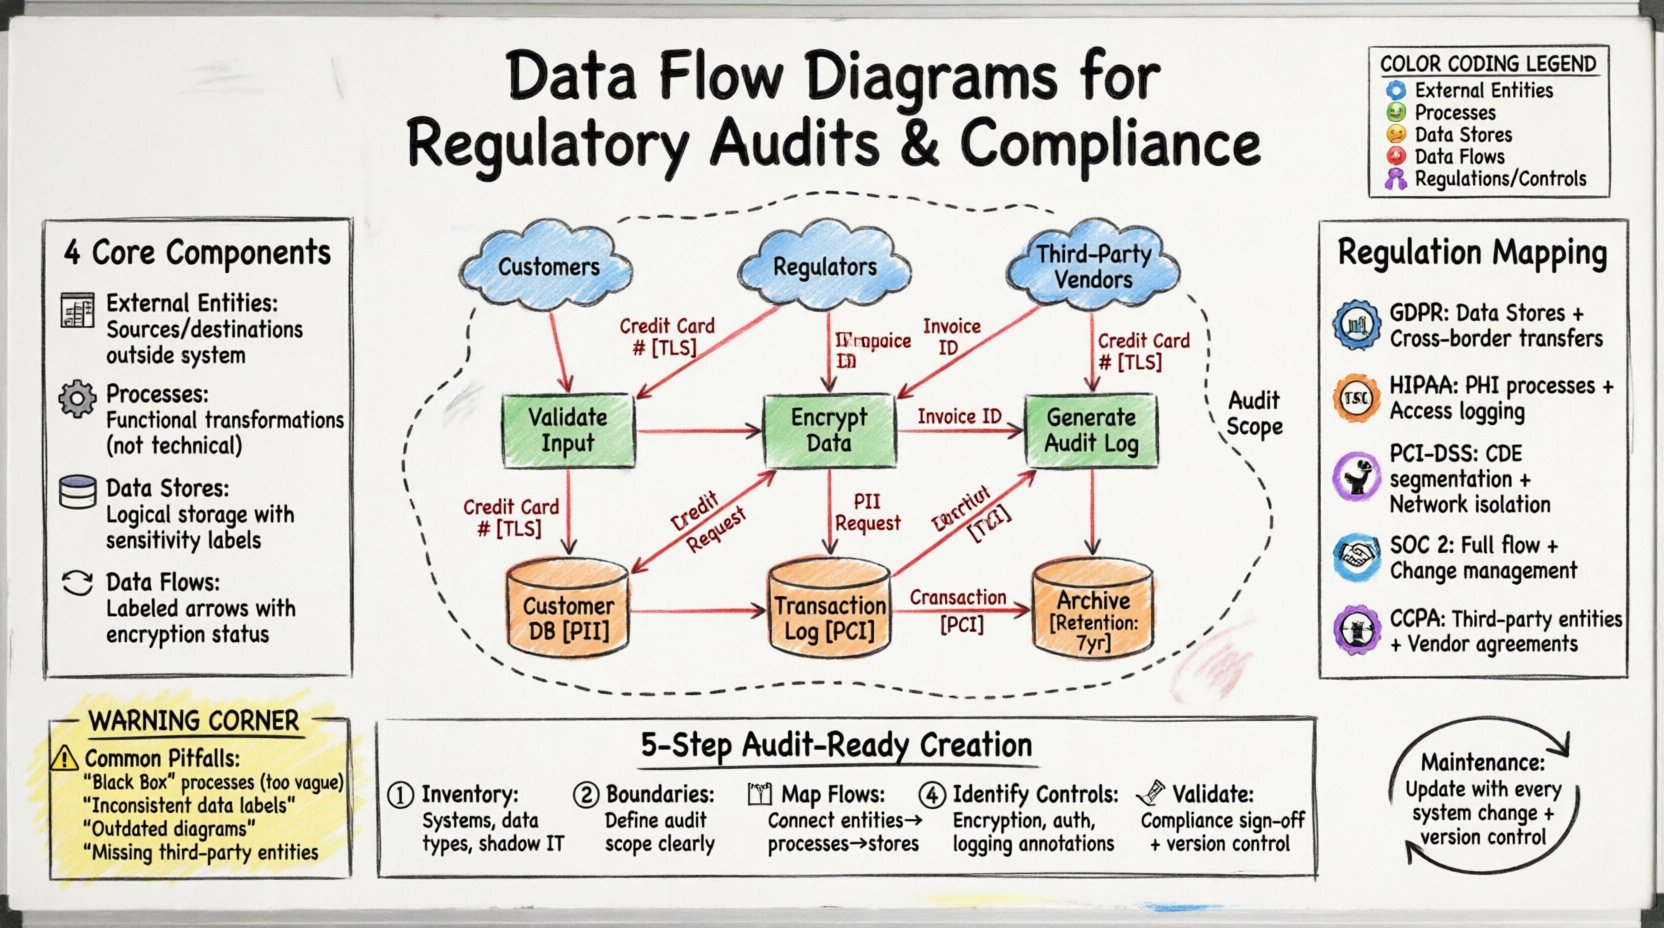
🧩 Core Components of a Compliant DFD
To satisfy audit requirements, every element within a Data Flow Diagram must be defined precisely. Ambiguity is the enemy of compliance. Each symbol represents a critical control point that must be documented.
1. External Entities 🏢
External entities represent sources or destinations of data outside the system boundary. In a compliance context, these are often critical:
- Customers: Sources of personal identifiable information (PII).
- Regulators: Entities receiving reports or data for oversight.
- Third-Party Processors: Vendors handling data on behalf of the organization.
- Internal Departments: HR, Legal, or Finance teams initiating data requests.
2. Processes ⚙️
Processes transform data. They are the active steps where data is modified, aggregated, or routed. For audits, processes must be named functionally rather than technically.
- Bad: “Run SQL Script” (Too technical).
- Good: “Calculate Tax Liability” (Functional).
Each process requires an associated control description. Does this step encrypt data? Does it validate input? Does it log access?
3. Data Stores 🗃️
Data stores represent where information rests. This is often the highest risk area in compliance.
- Logical vs. Physical: Diagrams should show logical storage (e.g., “Customer Database”) rather than specific file paths.
- Classification: Stores holding sensitive data (PHI, PCI) must be identified clearly.
- Retention: The diagram should ideally link to retention schedules.
4. Data Flows 🔄
Data flows are the arrows connecting entities, processes, and stores. They define the path of information.
- Direction: Must clearly indicate input and output.
- Labeling: Every arrow must be labeled with the data type (e.g., “Credit Card Number”, “Invoice ID”).
- Encryption: Flows crossing network boundaries should be noted as encrypted or unencrypted.
📊 Hierarchy of Diagrams for Audits
Compliance audits often require a layered approach. A single diagram rarely captures the full scope of an organization’s data architecture. A hierarchy of diagrams allows for both high-level overview and detailed inspection.
| Level | Name | Focus | Audit Use Case |
|---|---|---|---|
| 0 | Context Diagram | System boundary and external interaction | High-level scope definition |
| 1 | Level 1 DFD | Major processes and data stores | Understanding core architecture |
| 2 | Level 2 DFD | Detailed subprocesses | Control point verification |
| 3 | Level 3 DFD | Atomic data movements | Specific data element tracking |
Context Diagram (Level 0)
This is the starting point. It shows the entire system as one bubble and all external entities interacting with it. It establishes the scope of the audit. If a data flow enters the system in this diagram, it must be accounted for in lower levels.
Level 1 & 2 Breakdowns
As you decompose the system, you must ensure the sum of the parts equals the whole. Every data flow exiting a Level 0 process must appear in a Level 1 process. This consistency is a primary check for auditors. Inconsistencies suggest undocumented systems or shadow IT.
📋 Mapping DFDs to Specific Regulations
Different regulatory frameworks have distinct requirements for data mapping. A DFD created for one standard may need adjustments for another. Below is a breakdown of how DFD elements align with major compliance regimes.
| Regulation | Key Requirement | DFD Element Focus | Compliance Evidence |
|---|---|---|---|
| GDPR (General Data Protection Regulation) | Data Subject Rights & Location | Data Stores & Transfers | Proof of cross-border transfer controls |
| HIPAA (Health Insurance Portability) | Protected Health Information (PHI) | Processes & Access | Encryption and access logging on flows |
| PCI-DSS (Payment Card Industry) | Cardholder Data Environment (CDE) | Network Segmentation | Isolation of card data from public networks |
| SOC 2 (Service Organization Control) | Security & Availability | Entire Flow | Change management and backup flows |
| CCPA (California Consumer Privacy Act) | Consumer Data Sales | Third-Party Entities | Vendor data sharing agreements |
Case Study: GDPR Data Subject Rights
Under GDPR, individuals have the right to know what data an organization holds about them. A DFD must explicitly show:
- Where personal data is collected.
- How long it is retained (Data Stores).
- Where it is sent (External Entities).
- How it is deleted (Processes).
If a data flow leaves the system to a third-party processor, the DFD must link to a Data Processing Agreement (DPA). This visual link is crucial for demonstrating accountability.
🛠️ Creating Audit-Ready Diagrams
Creating a DFD that withstands scrutiny requires a disciplined approach. It is not enough to draw a picture; the diagram must be accurate, current, and maintained.
Step 1: Inventory and Discovery 🔎
Before drawing, you must know what exists. Conduct a thorough inventory of systems, databases, and applications.
- Interview system owners.
- Review network topology.
- Scan for shadow IT applications.
- Document all data types involved.
Step 2: Define Boundaries 🚧
Clearly mark the system boundary. What is inside the scope of the audit, and what is outside? This prevents scope creep during the audit process. Everything outside the boundary is an External Entity.
Step 3: Map the Flows 🗺️
Draw the connections. Ensure that:
- No data flows bypass a process (data cannot move from a store to another store without processing).
- No data flows bypass the boundary (data cannot leave without an arrow crossing the line).
- All data types are labeled.
Step 4: Identify Controls 🛡️
Overlay control information onto the diagram. This can be done via annotations or a legend.
- Encryption: Mark flows that use TLS/SSL.
- Authentication: Mark processes that require login.
- Logging: Mark processes that generate audit logs.
- Masking: Mark processes that hide sensitive data.
Step 5: Validation and Sign-Off ✍️
The diagram must be validated by the people who manage the systems. An IT architect may draw the diagram, but a Compliance Officer must verify its accuracy against policy. Obtain formal sign-off to establish ownership.
⚠️ Common Pitfalls in Compliance DFDs
Auditors are trained to find discrepancies. Common errors in DFDs can lead to immediate findings or restatements.
1. The “Black Box” Problem 🌑
Decomposing a process too deeply without explaining the internal logic creates a black box. If a process handles sensitive data, it must be detailed enough to show where the data is transformed. If it is too vague, the auditor assumes the worst.
2. Inconsistent Data Labels 🏷️
Using “Customer Data” on one arrow and “PII” on another creates confusion. Standardize terminology. If a data store is called “UserDB” in one place, it must be called “UserDB” everywhere.
3. Outdated Diagrams 📉
A DFD is only as good as its currency. If the organization migrates from on-premise servers to cloud storage, the DFD must update. An outdated diagram suggests a lack of governance.
4. Missing External Entities 🏢
Organizations often forget to document third-party vendors. If a system sends data to a cloud provider, that provider must appear as an External Entity. Failure to do so hides the risk of data exfiltration.
🔄 Maintenance and Lifecycle Management
Compliance is not a one-time event. It is a continuous state. The DFD must evolve with the organization.
Change Management Integration
DFDs should be part of the Change Management process. Before a new feature is deployed, the DFD must be reviewed to ensure the new data flows are secure and documented.
- Trigger: New application, new vendor, new regulation.
- Review: Compliance team validates changes.
- Update: Diagram is revised and versioned.
- Archive: Old versions are stored for historical audit trails.
Version Control
Every version of the DFD should have a date, a version number, and an author. This creates an audit trail of the organization’s understanding of its own systems over time.
📈 Integrating DFDs with Data Mapping
Data Flow Diagrams and Data Mapping often run parallel. While a DFD shows the movement of data through processes, a Data Map shows the specific fields and attributes.
- DFD: Shows that “Customer Name” flows from “Registration” to “Billing”.
- Data Map: Shows that “Customer Name” is stored in field “CUST_NME” in table “TBL_CUST”.
For high-stakes audits, these two artifacts are linked. The DFD provides the context, and the Data Map provides the technical detail. Using both creates a robust defense against regulatory findings.
🤝 Managing Third-Party Dependencies
Modern organizations rely heavily on vendors. This introduces complexity into the DFD.
Vendor Data Flows
When data leaves your organization, the DFD must show the handoff. You must document:
- The vendor’s name (External Entity).
- The purpose of the data transfer.
- The security measures in place during transfer.
Limited Visibility
Sometimes, you cannot see inside a vendor’s system. In this case, the DFD should clearly mark the vendor’s internal processes as “Black Box” or “Vendor Internal Processing”. Do not guess. If you do not know, state that you do not know, and document the reliance on vendor assurances (e.g., SOC 2 reports).
🔎 Preparing for the Audit Review
When the auditor arrives, the DFD is your primary visual aid. Preparation involves more than just drawing lines.
- Walkthroughs: Be prepared to walk the auditor through the diagram line by line.
- Supporting Docs: Have policies, logs, and configurations ready to back up what the diagram claims.
- Gap Remediation: If a gap is found (e.g., a missing encryption flow), have a remediation plan ready to show.
- Clarity: Ensure the diagram is legible. Large print, clear labels, and minimal clutter.
Auditors appreciate clarity. If they can understand the system in 10 minutes using the DFD, the audit process will be smoother. If they spend 2 hours deciphering the diagram, trust is eroded.
📌 Final Thoughts on DFD Strategy
Data Flow Diagrams are more than technical drawings; they are strategic assets for compliance. They translate technical complexity into regulatory language. By maintaining accurate, detailed, and current diagrams, organizations demonstrate a commitment to data stewardship.
Investing time in DFDs pays dividends during audits. It reduces the time spent answering questions, lowers the risk of findings, and improves the overall security posture of the organization. Treat the diagram as a living document, subject to the same rigor as the data it represents.