


Software delivery has evolved significantly over the last two decades. The traditional waterfall model, characterized by rigid phases and extensive upfront documentation, has largely given way to iterative and continuous approaches. In this modern landscape, Data Flow Diagrams (DFD) often face scrutiny regarding their relevance. Critics argue that static diagrams cannot keep pace with the velocity of change inherent in Agile and DevOps cultures. However, when adapted correctly, these visual models remain vital tools for understanding system logic, identifying bottlenecks, and ensuring security compliance.
This guide explores how to effectively integrate Data Flow Diagrams into fast-paced environments. We will examine the core components of DFDs, their specific applications within Agile ceremonies, their role in DevOps pipelines, and strategies for maintaining accuracy without slowing down development.
Understanding the Core Components of a DFD 🧩
Before integrating DFDs into modern workflows, it is necessary to establish a shared understanding of the notation. A Data Flow Diagram maps the movement of data through a system. It does not focus on control flow or timing, but rather on the transformation and storage of information.
A standard DFD consists of four primary elements:
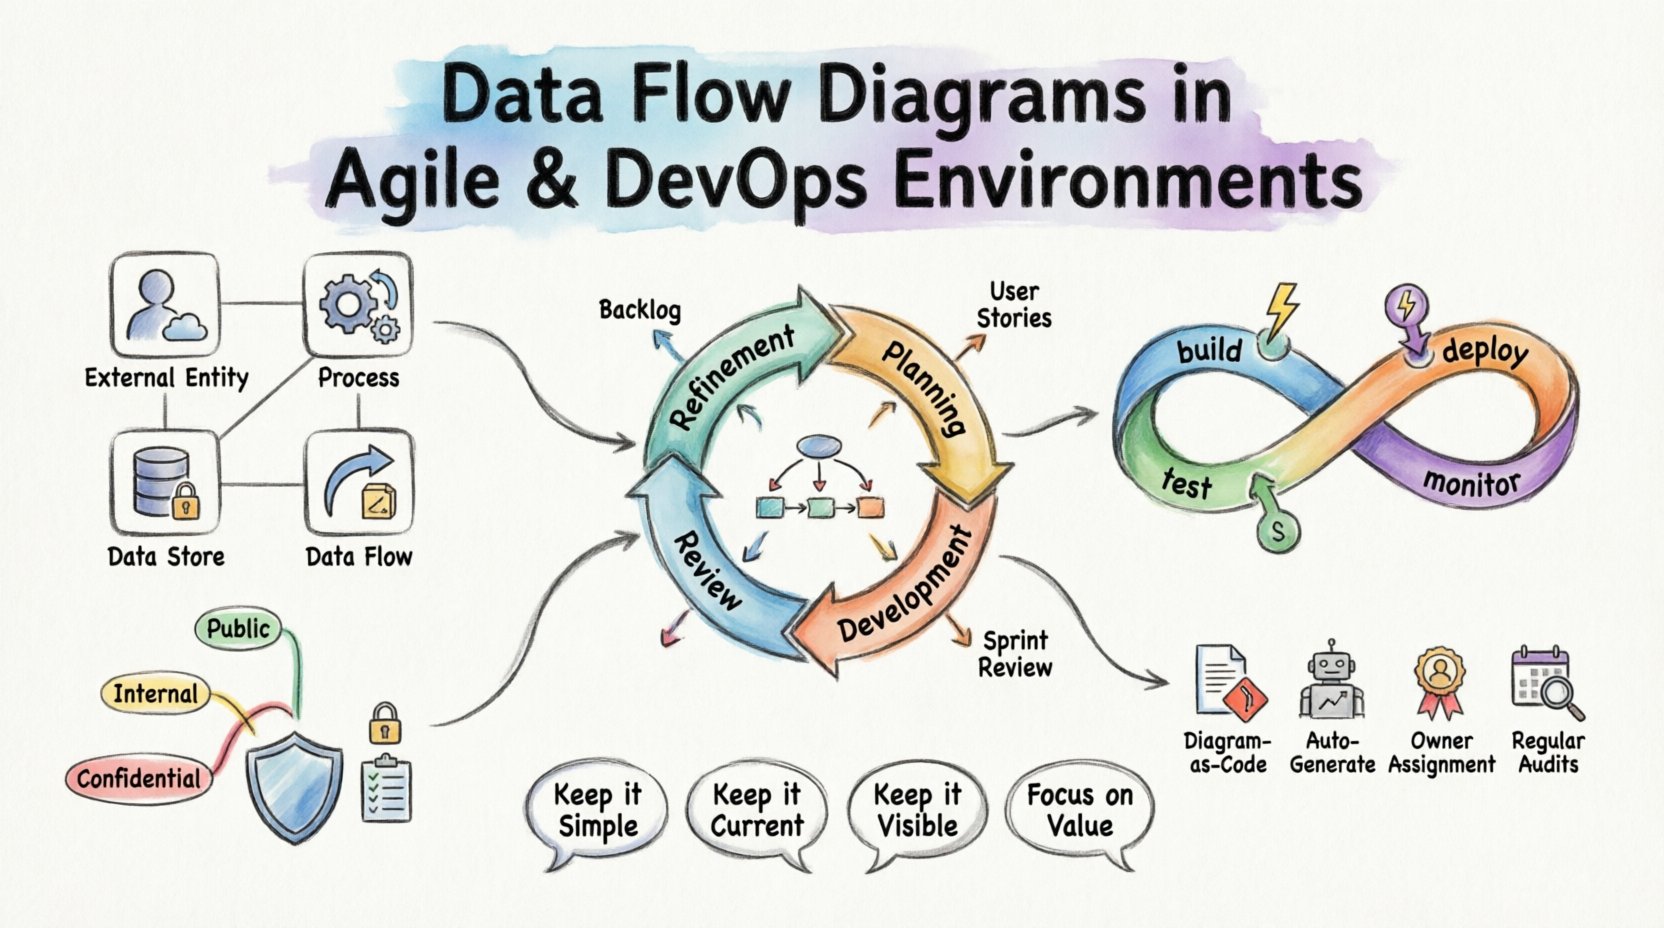
- External Entities: Sources or destinations of data outside the system boundary (e.g., users, other systems, hardware devices).
- Processes: Transformations that convert input data into output data. These represent the logic or business rules.
- Data Stores: Repositories where data is held at rest (e.g., databases, file systems, queues).
- Data Flows: The paths along which data moves between entities, processes, and stores.
Visualizing these components helps teams align on how information traverses the architecture. In complex systems, data can become fragmented or obscured. A clear diagram reveals these paths immediately.
The Agile Context: Documentation as a Living Artifact 📝
Agile methodologies prioritize working software over comprehensive documentation. This principle sometimes leads to the abandonment of architectural diagrams. However, omitting visual documentation entirely can lead to knowledge silos. When key personnel leave or when new members join, understanding the system’s data logic becomes difficult without a reference point.
In an Agile environment, DFDs must evolve from static deliverables to living artifacts. They should be updated incrementally, often alongside user stories.
Integration with Sprints
Consider how DFDs fit into the sprint cycle:
- Refinement: During backlog refinement, the team reviews incoming stories. A high-level DFD helps identify dependencies between different data stores or external systems.
- Planning: When breaking down stories, developers can reference the DFD to understand input requirements and output expectations.
- Development: As code is written, the diagram serves as a sanity check. Does the implementation match the designed flow?
- Review: During the sprint review, the updated diagram provides stakeholders with a visual confirmation of the new capability.
Level of Detail
Not every diagram needs to be a deep dive. Different levels of abstraction serve different purposes:
| Level | Focus | Best Used By |
|---|---|---|
| Context Diagram | System boundaries and external interactions | Stakeholders, Product Owners |
| Level 0 (Top-Level) | Major processes and data stores | Architects, Senior Developers |
| Level 1 (Detailed) | Specific logic and sub-processes | Developers, QA Engineers |
In Agile teams, maintaining a Level 0 or Context diagram is often sufficient for high-level alignment. Detailed Level 1 diagrams should be created only when a specific feature requires complex data transformation logic.
DevOps and Automation: Mapping the Pipeline 🚀
DevOps focuses on the automation of the software delivery process. This involves continuous integration and continuous deployment (CI/CD). While CI/CD pipelines automate the movement of code, the movement of data within the application itself remains a critical concern.
A Data Flow Diagram in a DevOps context helps visualize the interaction between the application layer and the infrastructure layer.
Identifying Bottlenecks
Performance issues often stem from data handling rather than computation. By mapping data flows, teams can identify:
- Unnecessary Transfers: Data moving between services that could be cached or processed locally.
- Latency Points: Synchronous calls that block user interaction.
- Bulk Operations: Large data sets moving through pipelines that could saturate network bandwidth.
CI/CD Pipeline Integration
Automated testing strategies can leverage DFDs to ensure data integrity. When a new service is deployed, automated checks can verify that data flows match the defined diagram.
- Contract Testing: Verify that the input and output of a process match the expected schema defined in the flow.
- Dependency Scanning: Ensure that changes to a data store do not break downstream consumers.
- Security Scanning: Check if sensitive data flows through insecure channels.
Security and Compliance Considerations 🛡️
Data security is a primary concern in modern software delivery. Regulations such as GDPR or HIPAA require strict controls over where personal data is stored and how it is processed. DFDs play a crucial role in demonstrating compliance.
Data Classification
When creating diagrams, it is helpful to tag data flows with sensitivity levels. This allows security teams to prioritize protection measures.
- Public Data: No special encryption required.
- Internal Data: Encrypted in transit, access-controlled.
- Confidential Data: Encrypted at rest and in transit, strict access logging.
By visualizing where confidential data moves, teams can ensure that it is not inadvertently exposed to third-party services or external entities that do not have clearance.
Access Control Mapping
DFDs help clarify the principle of least privilege. If a diagram shows a process accessing a data store, the team can verify that the service account used by that process has only the necessary permissions.
Maintaining Accuracy: Avoiding the Stale Diagram Trap 🔄
The most common failure point for DFDs in modern environments is obsolescence. A diagram created during the initial design phase often becomes inaccurate as soon as the first sprint concludes. A stale diagram is worse than no diagram, as it misleads developers and creates false assumptions.
Strategies for Synchronization
To prevent diagrams from becoming outdated, teams must adopt specific maintenance strategies.
- Diagram as Code: Store diagram definitions in version control alongside the application code. This allows changes to be reviewed via pull requests.
- Automated Generation: Where possible, generate diagrams from the codebase or infrastructure definitions. This ensures the visual representation matches the actual deployment.
- Owner Assignment: Assign specific ownership of diagram sections to feature teams. When a feature changes, the owner is responsible for updating the relevant flow.
- Regular Audits: Schedule quarterly reviews of the architecture diagrams. Ensure they still reflect the production environment.
Collaboration Across Teams 🤝
Data Flow Diagrams are not just technical documents; they are communication tools. They bridge the gap between development, operations, security, and business stakeholders.
Development and Operations Alignment
Developers often focus on functionality, while Operations focuses on stability and uptime. A DFD helps Operations understand where data volume spikes might occur. It helps Developers understand where data persistence is critical for recovery.
Security Team Integration
Security teams can use DFDs to perform threat modeling. By identifying every entry point (External Entity) and every storage point (Data Store), they can systematically evaluate potential attack vectors.
Business Stakeholder Visibility
Non-technical stakeholders benefit from Context Diagrams. They can see how their business inputs result in business outputs without getting bogged down in technical implementation details. This fosters better trust and clearer expectations.
Common Challenges and Solutions 🛠️
Implementing DFDs in Agile and DevOps is not without challenges. Below are common issues and practical solutions.
| Challenge | Impact | Solution |
|---|---|---|
| Diagram Complexity | Too many details make the diagram unreadable. | Use abstraction layers. Hide details until requested. |
| Tooling Friction | Editors are slow or require separate licenses. | Use lightweight, collaborative, text-based tools. |
| Time Consumption | Creating diagrams takes time away from coding. | Focus on high-value diagrams only. Automate others. |
| Version Conflicts | Multiple people editing the same diagram. | Implement strict version control and branching. |
Step-by-Step Implementation Guide 📍
If you are looking to introduce or reintroduce Data Flow Diagrams into your current workflow, follow this structured approach.
Step 1: Assess Current State
Begin by reviewing existing documentation. Identify what data flows are already understood and where the gaps are. Determine if existing diagrams are accurate enough to be useful.
Step 2: Define Scope
Do not attempt to diagram the entire enterprise at once. Start with a specific service or a critical feature. Define the boundaries of the system clearly.
Step 3: Draft the Context Diagram
Create the highest level view. Identify the external entities and the primary data inputs and outputs. Get stakeholder sign-off on this level before diving deeper.
Step 4: Decompose Processes
Break down the main processes into sub-processes. Map the data stores involved. Ensure every flow has a defined start and end point.
Step 5: Review and Validate
Conduct a walkthrough with the development team. Ask them to trace a piece of data from entry to exit. If they cannot trace it, the diagram is incomplete.
Step 6: Integrate into Workflow
Link the diagram to your issue tracking system. Reference the diagram URL in pull requests. Make it a mandatory part of the definition of done for features that alter data paths.
The Future of Data Flow Visualization 🔮
As systems become more distributed and event-driven, the nature of data flow changes. Microservices and serverless architectures introduce ephemeral processes that are harder to visualize statically. Dynamic mapping is becoming more important.
Future implementations may rely on runtime telemetry to update diagrams automatically. Observability tools can ingest logs and metrics to show real-time data paths. This shifts the DFD from a design artifact to a monitoring artifact.
Until then, manual maintenance remains necessary. The discipline required to keep a DFD accurate translates to better code quality and system understanding. Teams that invest in visual clarity often find that debugging becomes faster and onboarding becomes easier.
Key Takeaways for Teams 📌
- Keep it Simple: A diagram that is too complex is useless. Stick to the level of detail required for the task.
- Keep it Current: An outdated diagram is dangerous. Automate updates or assign ownership.
- Keep it Visible: Place diagrams where the team can see them, not in a buried document repository.
- Focus on Value: Only create diagrams that solve a specific problem, such as onboarding, security auditing, or dependency mapping.
Data Flow Diagrams remain a powerful tool for understanding system behavior. In Agile and DevOps environments, they must be lightweight, collaborative, and integrated into the daily workflow. By treating them as living documents rather than static artifacts, teams can maintain a clear view of their data landscape without sacrificing velocity.
The goal is not perfection in documentation, but clarity in understanding. When everyone understands how data moves, the system becomes more resilient, secure, and efficient. This shared understanding is the foundation of high-performing engineering teams.