


In the landscape of system analysis and business process modeling, clarity is paramount. A Data Flow Diagram (DFD) serves as the visual blueprint for how information moves through a system. Unlike flowcharts that depict control flow, DFDs focus specifically on data transformation, storage, and external interactions. This guide explores the practical application of DFDs across various industries, providing deep insight into their construction and utility without relying on specific software tools.
Understanding the mechanics of data movement allows architects to identify bottlenecks, ensure security compliance, and streamline operations. By examining real-world scenarios, we can see how abstract symbols translate into functional system designs. This resource covers foundational concepts, detailed case studies, and critical best practices for creating effective diagrams.
Core Components of a Data Flow Diagram 🧩
Before diving into complex scenarios, it is essential to establish a shared vocabulary. A DFD is composed of four primary elements. Each element represents a specific function within the data ecosystem. Confusion between these symbols can lead to misinterpretation of system logic.
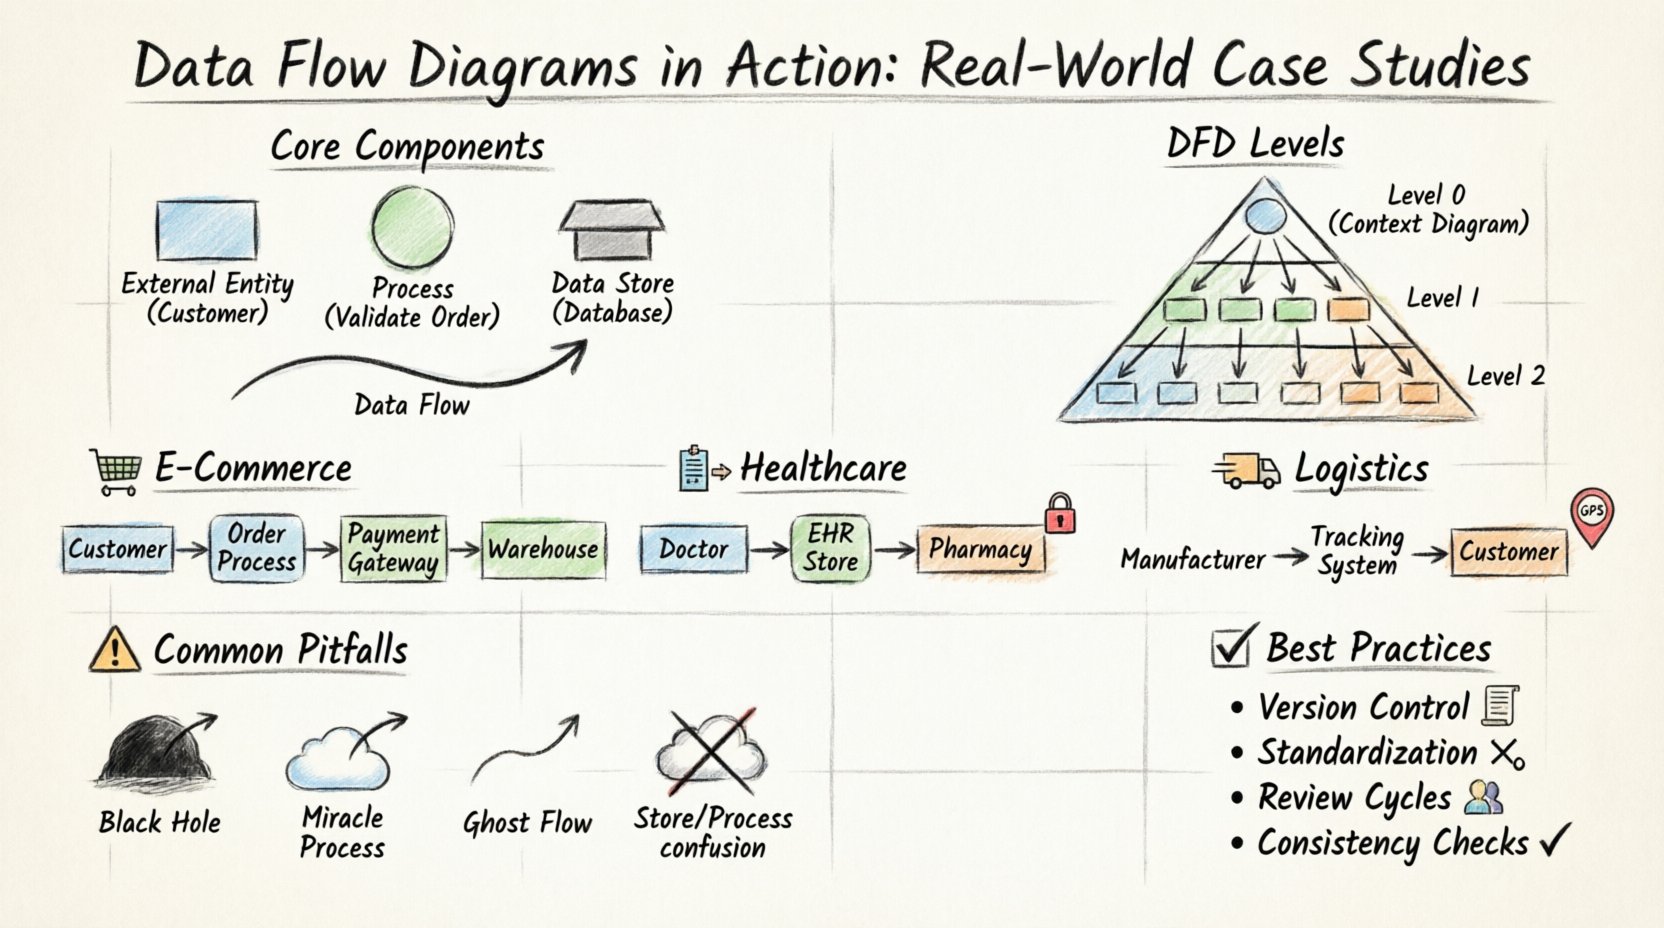
- External Entity: An external source or destination of data. This could be a person, organization, or another system.
- Process: A transformation or calculation performed on the data. It changes input into output.
- Data Store: A repository where data is held for later retrieval. This represents databases, files, or logs.
- Data Flow: The movement of data between entities, processes, and stores. Arrows indicate direction.
Symbol Reference Table 📋
| Element | Shape | Function | Example |
|---|---|---|---|
| External Entity | Rectangle | Source/Sink | Customer, Vendor |
| Process | Circle/Rounded Rectangle | Transformation | Calculate Tax, Validate Login |
| Data Store | Open Rectangle | Storage | Order Database, User Profile |
| Data Flow | Arrow | Movement | Payment Info, Shipping Request |
Understanding DFD Levels 📉
Complex systems cannot be represented in a single view. To maintain clarity, DFDs are decomposed into levels. This hierarchy allows stakeholders to see the big picture before examining granular details.
- Context Diagram (Level 0): The highest level view. It shows the system as a single process and its interaction with external entities. No internal data stores are visible.
- Level 1 Diagram: Breaks the main process into major sub-processes. Data stores are introduced.
- Level 2 Diagram: Further decomposition of Level 1 processes. Used for detailed design specifications.
Consistency is key. Every data flow entering a Level 1 process must appear in the Context Diagram. Similarly, inputs and outputs must match between parent and child diagrams. This ensures the integrity of the model throughout the decomposition process.
Case Study 1: E-Commerce Order Processing 🛒
One of the most common applications of DFDs is in e-commerce platforms. The order processing workflow involves multiple touchpoints, from browsing to fulfillment. A robust diagram ensures that customer data is handled securely and inventory is updated accurately.
System Context (Level 0)
The system boundary encompasses the entire order management platform. External entities include the Customer, Payment Gateway, and Warehouse System. The primary data flow begins with a customer placing an order.
- Customer: Sends Order Details and Payment Information.
- System: Processes payment and requests shipment.
- Warehouse: Receives shipping instructions and confirms dispatch.
Level 1 Decomposition
At this level, the single process is split into four distinct functions. This reveals where data is stored and how it changes state.
- Validate Order: Checks stock availability and customer details.
- Process Payment: Communicates with the payment gateway.
- Create Invoice: Generates a record for the transaction.
- Update Inventory: Reduces stock count based on order status.
Data Flow Analysis
Consider the flow of sensitive data. Payment information enters the Process Payment bubble but never touches the Create Invoice process directly. It goes to a secure Transaction Log store. This separation of concerns is critical for compliance.
- Input: Credit Card Number, Order ID.
- Output: Transaction Status, Receipt.
- Storage: Encrypted Transaction Log, Customer Database.
Errors in this diagram often manifest as orphaned data flows. For instance, if an order is cancelled, the data must flow back to the Inventory store to restore stock levels. If this flow is missing, inventory discrepancies occur.
Case Study 2: Healthcare Patient Management 🏥
Healthcare systems demand higher security and accuracy. Data privacy is not optional; it is a regulatory requirement. A DFD here must clearly delineate who can access what data.
Key Challenges
In this environment, the distinction between a Process and a Data Store is vital. Sensitive health records must remain in storage until a specific authorization process retrieves them.
- Entities: Doctor, Patient, Insurance Provider, Lab.
- Processes: Diagnosis, Prescription, Billing, Lab Request.
- Stores: Electronic Health Record (EHR), Billing Ledger, Lab Results.
Flow Logic
The data flow for a prescription involves multiple steps. The doctor enters a request, which goes to a Verification Process. This process checks drug interactions against the patient’s history in the EHR store. Only after clearance does the data flow to the Pharmacy.
Here is a breakdown of the critical paths:
- Admission Flow: Patient Info → Registration Process → Patient Profile Store.
- Consultation Flow: Symptoms → Diagnosis Process → Medical History Store.
- Prescription Flow: Medication → Pharmacy Interface → Inventory Store.
A common pitfall in healthcare DFDs is the lack of audit trails. Every modification to a data store must have a corresponding data flow indicating the source of the change. This allows for accountability if a record is altered.
Security Considerations
Not all data flows are equal. Some are marked as Public, while others are Confidential. The diagram should visually represent these distinctions. For example, the Insurance Provider receives billing data but not clinical notes. This logical separation prevents unauthorized access.
Case Study 3: Supply Chain Logistics 🚚
Logistics involves tracking physical goods through digital systems. The DFD here focuses on status updates and location data. The complexity lies in the real-time nature of the data.
System Scope
The system tracks goods from the manufacturer to the final delivery point. Key entities include the Manufacturer, Transporter, Distribution Center, and Customer.
Process Breakdown
- Ship Order: Initiates the movement of goods.
- Track Location: Updates the current position of the package.
- Confirm Delivery: Finalizes the transaction.
Data Flow Dynamics
In logistics, data flows are often asynchronous. A truck may send a location update that is stored temporarily until the system processes it. This requires a buffering mechanism in the data store design.
| Stage | Input Data | Process | Output Data |
|---|---|---|---|
| Dispatch | Order ID, Address | Route Calculation | Tracking Number |
| In Transit | GPS Coordinates | Position Update | Status Log |
| Delivery | Signature Scan | Completion Check | Delivery Confirmation |
One critical aspect of this diagram is error handling. If a package is lost, the data flow must trigger a Discrepancy Alert. This alert is a data flow that moves from the Tracking Store to the Support Team entity.
Common Pitfalls in DFD Design ⚠️
Even experienced analysts make mistakes. Identifying these common errors early saves significant time during the development phase.
1. Black Holes
A black hole is a process that has inputs but no outputs. The data enters, but nothing happens. In a DFD, this indicates a logic error. Every process must produce some result, even if that result is an error message.
2. Miracle Processes
The opposite of a black hole is a miracle process. This has outputs but no inputs. It implies that data is being generated out of thin air. Every output must be traceable to a specific input source.
3. Ghost Flows
This occurs when data flows are drawn but never actually used or stored. These clutter the diagram and confuse stakeholders. Review every arrow to ensure it serves a purpose.
4. Data Store Confusion
Do not confuse a process with a data store. A process changes data; a store holds it. A common mistake is drawing a process inside a data store or vice versa. This blurs the line between transformation and retention.
Best Practices for Maintenance 🛠️
A DFD is not a one-time artifact. It must evolve with the system. As requirements change, the diagram must be updated to reflect the new reality.
- Version Control: Keep records of diagram versions. Changes should be documented with dates and reasons.
- Standardization: Use consistent naming conventions for processes and stores. Get User Info and Retrieve User Data should be the same process.
- Review Cycles: Conduct regular reviews with stakeholders. Business rules often change faster than code.
- Consistency Checks: Ensure that child diagrams match parent diagrams in terms of inputs and outputs. This is known as balancing.
Integrating DFDs with Other Models 🔗
DFDs do not exist in isolation. They work best when integrated with other modeling techniques. This provides a holistic view of the system.
DFD vs. Entity Relationship Diagram (ERD)
While DFDs show how data moves, ERDs show how data is structured. Using both ensures that the logical flow matches the physical database design. For example, a Customer entity in an ERD should correspond to a Customer data store in the DFD.
DFD vs. Use Case Diagrams
Use Case diagrams focus on user interactions. DFDs focus on data movement. Together, they explain who does what and how the data supports that action.
Final Considerations for System Architects 🏛️
Creating a Data Flow Diagram is an exercise in communication. It translates complex logic into a visual language that technical and non-technical teams can understand. The value lies in the analysis, not just the drawing.
When reviewing a DFD, ask these questions:
- Is every data point accounted for?
- Are there any unauthorized data flows?
- Does the diagram reflect the actual business rules?
- Is the level of detail appropriate for the audience?
By adhering to these principles, you ensure that the system design is robust, secure, and efficient. The diagram becomes a living document that guides development and maintenance long after the initial design phase.
Summary of Key Takeaways 📝
- Structure: Use Context, Level 1, and Level 2 diagrams for hierarchy.
- Accuracy: Ensure all inputs have outputs and vice versa.
- Security: Map data sensitivity and access controls explicitly.
- Consistency: Maintain alignment between diagrams and actual system behavior.
The journey from concept to implementation is paved with clear documentation. Data Flow Diagrams provide the roadmap needed to navigate complex system architectures. By applying these real-world case studies and adhering to best practices, you can build systems that are not only functional but maintainable and secure.