


Data Flow Diagrams (DFDs) serve as a cornerstone in the field of systems analysis and business process modeling. For a Business Analyst, mastering the ability to visualize how information moves through a system is not just a technical skill—it is a communication superpower. A well-constructed DFD provides clarity where there was confusion, revealing bottlenecks, redundancies, and opportunities for optimization.
This guide explores the practical application of DFDs from a business perspective. It covers the foundational concepts, the structural components, the different levels of abstraction, and the methodology for creating effective diagrams without relying on specific software tools. By the end, you will understand how to leverage these diagrams to bridge the gap between stakeholder needs and technical implementation.
What is a Data Flow Diagram? 🧐
A Data Flow Diagram is a graphical representation of the flow of data through an information system. Unlike a flowchart, which focuses on the control logic and decision-making steps, a DFD focuses strictly on the movement of data. It answers the question: What happens to the data?
For a Business Analyst, the DFD is a tool for discovery. It helps you understand the current state (As-Is) and design the future state (To-Be). It allows you to abstract away the physical details of the system to focus on the logical flow of information.
Why DFDs Matter for Business Analysts 🤔
- Clarifying Requirements: Stakeholders often struggle to describe complex systems in text. A visual model makes the requirements tangible.
- Identifying Gaps: When mapping data flow, missing data stores or external entities become immediately apparent.
- Communication: It provides a common language between business stakeholders and technical teams.
- Process Optimization: It highlights unnecessary data movements or bottlenecks in the workflow.
Core Components of a DFD 🧩
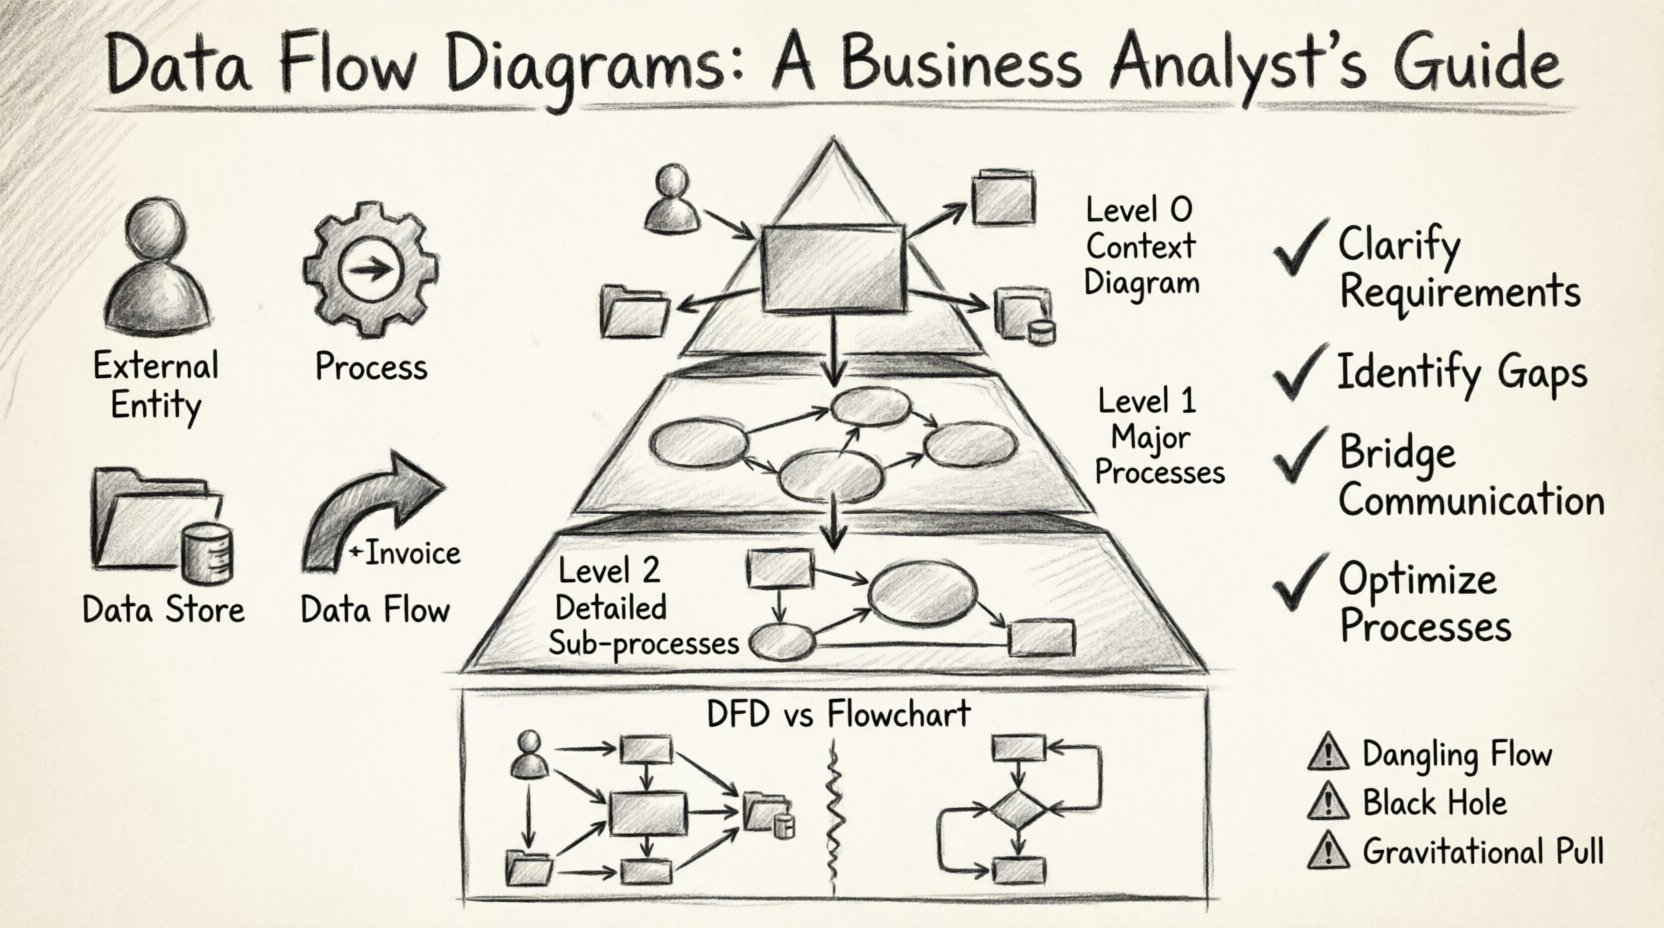
Understanding the building blocks is essential before attempting to draw a diagram. There are four primary symbols used in standard DFD notation. While specific styles (like Gane & Sarson or Yourdon & DeMarco) vary slightly, the concepts remain consistent.
1. External Entities 👤
An external entity represents a source or destination of data outside the system boundary. This could be a person, a group, another system, or an organization. The system interacts with them, but they are not part of the internal logic.
- Examples: Customer, Supplier, Bank, Government Agency.
- Role: They initiate data flows or receive final outputs.
2. Processes ⚙️
A process represents a transformation of data. It takes input data, performs some action (calculation, validation, storage), and produces output data. In a DFD, processes are not about how the action is performed technically, but what is happening to the data.
- Examples: Calculate Tax, Validate Order, Generate Report.
- Rule: A process must have at least one input and one output.
3. Data Stores 📂
A data store represents where data is held for later use. It is not a process; it does not change the data. It is a passive repository. This could be a database table, a file, a physical filing cabinet, or a cloud bucket.
- Examples: Customer Database, Inventory Log, Archived Orders.
- Rule: Data flows into a store for saving and out of a store for retrieval.
4. Data Flows 🔄
A data flow shows the movement of data between entities, processes, and stores. It represents a packet of information traveling through the system. It is depicted as an arrow.
- Labeling: Every arrow must have a clear label describing the data (e.g., “Invoice”, “Payment Details”).
- Direction: Arrows indicate the direction of movement.
Levels of Abstraction 📉
DFDs are hierarchical. You do not draw everything on one page. Instead, you break the system down into levels of increasing detail. This allows stakeholders to see the big picture first, then drill down into specifics.
Context Diagram (Level 0) 🌍
The Context Diagram is the highest level view. It shows the system as a single process (often called the “System” or “Enterprise”) and its interactions with all external entities. It defines the boundary of the project.
- Focus: Boundaries and external interfaces.
- <Detail: No internal processes or data stores shown.
Level 1 Diagram 📋
The Level 1 diagram breaks the single process from the Context Diagram into major sub-processes. It shows the major data stores and how data moves between these major functions.
- Focus: Major functional areas of the system.
- Detail: Shows how the system is organized logically.
Level 2 Diagram (and below) 🔍
Level 2 diagrams take a single process from Level 1 and decompose it further. This level is often used for technical teams to understand specific logic. For Business Analysts, this level is useful when defining detailed requirements for complex modules.
- Focus: Specific sub-processes.
- Detail: Granular data movement and validation steps.
Creating a DFD: A Step-by-Step Approach 🛠️
Creating a DFD is an iterative process. It requires gathering information, modeling, and validating. Follow this structured approach to ensure accuracy.
Step 1: Define the System Boundary 🚧
Before drawing anything, decide what is inside the system and what is outside. This is critical for the Context Diagram. Ask stakeholders: “Who are we building this for?” and “What data comes in and goes out?”
Step 2: Identify External Entities 👥
List all the people, departments, or systems that interact with your project. Do not include internal users unless they act as a separate system. For example, if a manager approves a request, they are an External Entity, but the “Approval Process” is inside the system.
Step 3: Map the Major Processes 🔄
Identify the key actions the system must perform. Name them using verb-noun phrases (e.g., “Process Payment”, not “Payment”). Ensure every process has data going in and data coming out.
Step 4: Connect the Data Flows 📡
Draw arrows to connect entities, processes, and stores. Ensure every arrow is labeled. If data moves from the Customer to the System, label it “Order Request”. If data moves from the System to the Customer, label it “Receipt”.
Step 5: Validate and Balance ⚖️
This is the most critical step. Input and Output Balance must be maintained across levels. If a Level 1 process receives “Order Details”, the Level 2 decomposition of that process must also receive “Order Details” (or parts of it) as input. This is known as data conservation.
DFD vs. Flowchart: Know the Difference 🔄
It is common to confuse Data Flow Diagrams with Flowcharts. While both are diagrams, they serve different purposes. Understanding the distinction prevents modeling errors.
| Feature | Data Flow Diagram (DFD) | Flowchart |
|---|---|---|
| Focus | Flow of data | Flow of control / Logic |
| Logic | Does not show decision points | Shows decision points (Yes/No) |
| Entities | External sources/destinations | Start/End points |
| Best For | System Analysis, Requirements | Algorithm Design, Coding |
| State Changes | Data is transformed | Process is executed |
Common Pitfalls to Avoid ⚠️
Even experienced analysts can make mistakes when modeling data flows. Watch out for these common errors.
- Dangling Data Flows: An arrow that leads nowhere. Every line must connect two components.
- Black Holes: A process that has input but no output. Data cannot disappear.
- Gravitational Pulls: A process that has output but no input. Data cannot appear from nothing.
- Data Store Confusion: Treating a data store as a process. A store holds data; it does not change it. If data is changed, it must go through a process first.
- Control Flow in DFD: Do not use DFDs to show decision logic (If/Then). Use flowcharts for that. DFDs are about data movement.
- Overcomplication: Trying to put too much detail in a Level 1 diagram. Keep high-level diagrams high-level.
Best Practices for Business Analysts ✅
To get the most value from your DFDs, adhere to these principles.
1. Use Consistent Naming 🏷️
Use the same terms for data flows across all diagrams. If you call it “Customer ID” in the Context Diagram, do not change it to “Client Number” in the Level 1 diagram. Consistency reduces confusion during reviews.
2. Limit Processes per Diagram 📐
A good rule of thumb is to have no more than 7 to 9 processes on a single Level 1 diagram. If you exceed this, consider splitting the system into sub-systems. This keeps the diagram readable.
3. Focus on the Logical, Not Physical 🧠
A Logical DFD shows how the business works, regardless of technology. A Physical DFD shows how the system works using specific hardware or software. Start with Logical. Do not mention databases or servers in the Logical model.
4. Involve Stakeholders Early 🤝
Draw the diagram and walk through it with the stakeholders. Ask them to trace a specific transaction. “If I place an order, where does the money go?” This validation ensures the model matches reality.
5. Maintain Version Control 📅
Requirements change. DFDs must evolve. Keep track of versions. When a process changes, update the diagram and note the change. This creates an audit trail for the system evolution.
Integration with Requirements Engineering 📝
DFDs do not exist in a vacuum. They are deeply connected to your Requirements Specification Document (RSD). Here is how to align them.
- Traceability: Each process in the DFD should map to a functional requirement. If a process has no requirement, question its necessity.
- Non-Functional Requirements: DFDs can help identify performance needs. For example, if a process requires data from a distant store, latency might be a concern.
- Validation: Use the DFD to validate that all data required by the business is accounted for. If a report is needed, ensure the data flows into a store or process that supports it.
Validation and Review 🔍
Once the diagram is drafted, it must undergo a formal review. This is not just a visual check; it is a logical check.
The Walkthrough Method
Conduct a walkthrough session. Select a specific data item, such as “Sales Order”. Trace it from the External Entity through every process and store until it reaches its final destination. Does the path make sense? Is the data complete at every stage?
The Conservation Check
Verify that data is conserved. If a process outputs “Shipping Address”, the input must have included “Address” information. If data disappears, the model is incomplete.
The Decomposition Check
Ensure that Level 2 diagrams are true decompositions of Level 1. The inputs and outputs of the parent process must match the sum of the inputs and outputs of the child processes.
Case Study: Online Retail System 🛒
To illustrate, consider an Online Retail System. The Context Diagram would show the “Customer” sending an “Order” and receiving a “Invoice”. The “Warehouse” sends “Stock Availability”.
In the Level 1 Diagram, the system breaks down into “Receive Order”, “Process Payment”, “Update Inventory”, and “Ship Goods”. The “Customer Database” and “Inventory Database” serve as data stores.
This structure helps the Business Analyst identify that “Process Payment” requires data from “Receive Order” and must update the “Inventory Database”. It also highlights that the “Warehouse” is an external entity, meaning the system must interface with their inventory system.
Maintenance and Evolution 🔄
Systems are living entities. As the business grows, the DFD must change. A DFD is not a one-time deliverable.
- Change Management: When a new feature is added, update the DFD first. This helps identify downstream impacts.
- Refactoring: If a process becomes too complex, decompose it. If two processes are rarely used together, consider merging them.
- Documentation: Keep the DFD alongside the requirements. It serves as a visual index for the document.
Conclusion on Visual Modeling 🎯
Data Flow Diagrams are more than just technical drawings; they are a language of business logic. They translate abstract requirements into concrete visual paths. By following the principles of hierarchy, consistency, and validation, Business Analysts can create models that drive successful system implementation.
The goal is not perfection in the first draft, but clarity in the communication. A DFD that sparks a conversation and reveals a missing requirement is a successful diagram, regardless of how many arrows it contains. Focus on the data, respect the flow, and let the diagram guide your analysis.
With practice, creating these diagrams will become a natural part of your analytical toolkit. They remain one of the most reliable methods for ensuring that the final system actually supports the business needs it was designed to serve.