


Software architecture is often invisible until it breaks. When a junior developer joins a team, they face a wall of code that seems impenetrable. They struggle to understand how data flows from one service to another. They do not see the boundaries. They do not see the responsibilities. This lack of visibility causes anxiety. It leads to slow progress.
The challenge is not just about writing code. It is about understanding the mental model of the system. Without a clear map, developers wander through the codebase, touching files they should not touch. This creates technical debt. It introduces bugs. It frustrates the team.
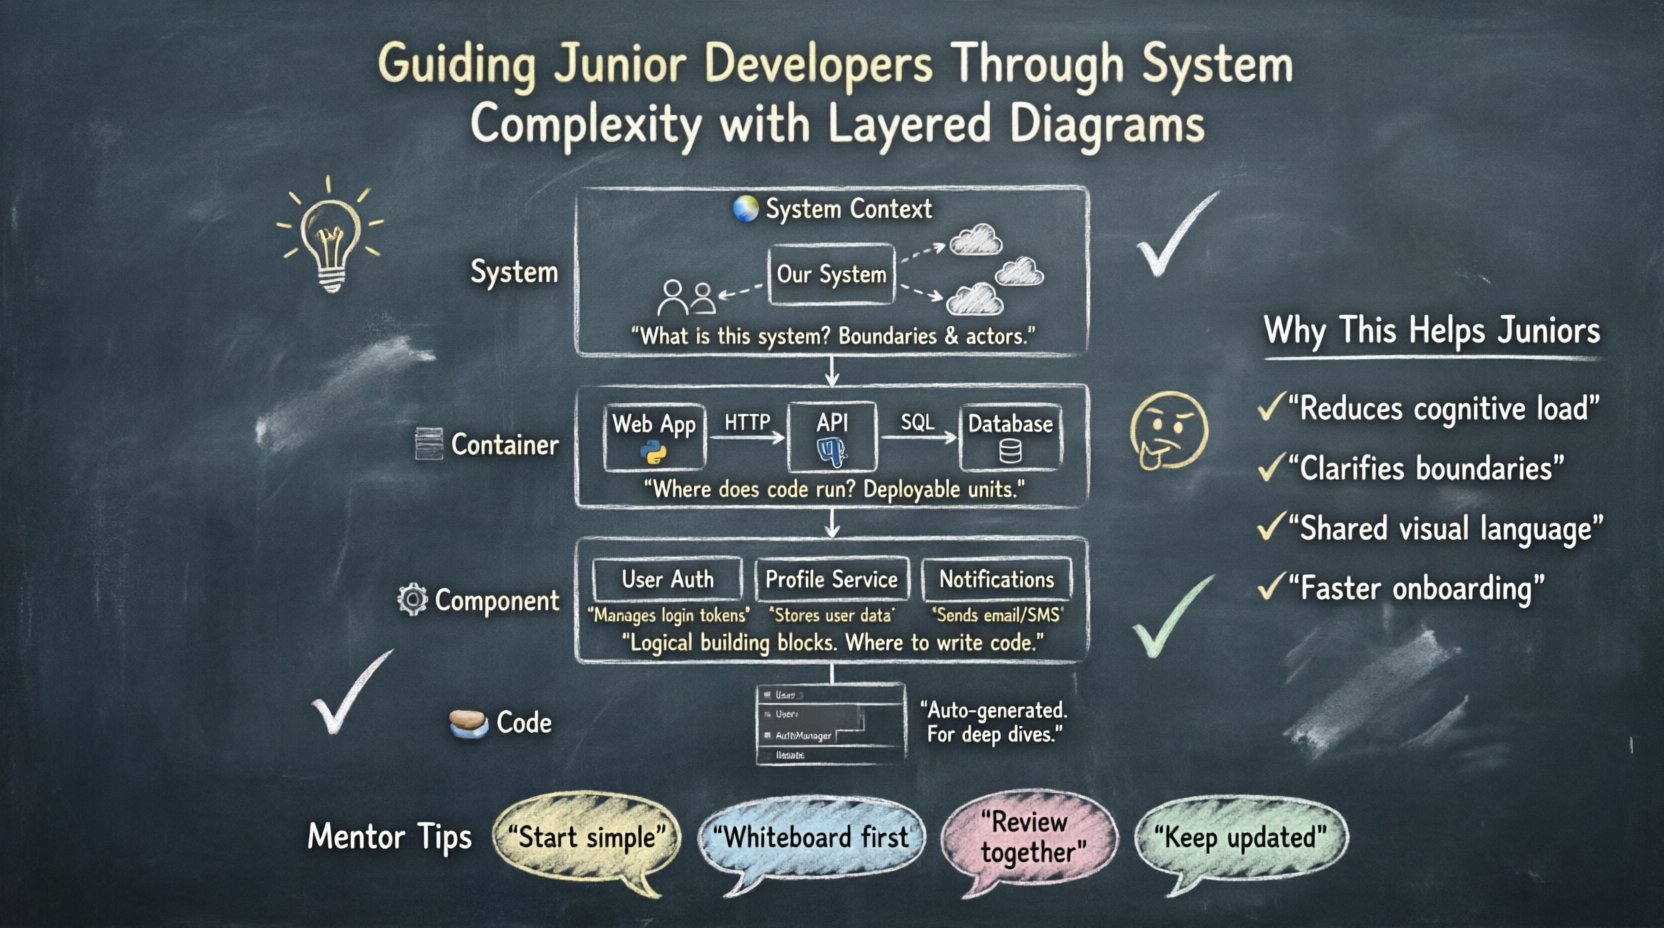
Layered diagrams offer a solution. Specifically, the C4 Model provides a structured way to visualize complexity. It breaks down the system into manageable chunks. It allows mentors to guide juniors step-by-step. This guide explores how to use these diagrams to build confidence and competence.
Why Juniors Struggle with System Complexity 🤯
Junior developers often face a cognitive load problem. They are learning syntax, tools, and frameworks simultaneously. Adding the context of the entire system overwhelms them. They get lost in implementation details.
Here are common friction points:
- Blind Spots: They see the code for a function but not the service it belongs to.
- Dependency Confusion: They do not know which database connects to which API.
- Context Switching: They jump between microservices without understanding the boundary.
- Assumption Errors: They assume a module is stateless when it is actually stateful.
Without visual aids, these gaps remain hidden until a production incident occurs. Diagrams act as a shared language. They translate abstract logic into concrete shapes. This reduces the time spent explaining concepts verbally.
What Is the C4 Model? 🧱
The C4 Model is a technique for documenting software architecture. It uses a hierarchy of diagrams. Each level zooms in on a specific part of the system. It avoids clutter by focusing on one aspect at a time.
There are four levels in this model:
- System Context: The big picture.
- Container: The running parts.
- Component: The logical building blocks.
- Code: The detailed implementation.
Using this hierarchy helps mentors scaffold learning. A junior starts with the top layer. They understand the system before diving into the code. This approach respects their cognitive limits.
Level 1: System Context Diagrams 🌍
The System Context diagram is the entry point. It shows the software system as a single box. It also shows the people and systems that interact with it.
What to Include
- The System: A box labeled with the project name.
- Users: Icons representing humans using the system.
- External Systems: Boxes representing databases, third-party APIs, or other services.
- Relationships: Lines showing data flow between the system and external actors.
Why It Helps Juniors
This diagram answers the question: “What is this system?” It provides boundaries. It prevents the junior from thinking the system is the entire network. It clarifies who owns what data.
Example Scenario:
A junior developer is tasked with fixing a bug in the user profile section. The Context diagram shows that the user profile system talks to an Identity Provider. It also talks to a Notification Service. The junior now knows they cannot change the Identity Provider logic directly. They must use the provided API.
Level 2: Container Diagrams 📦
Containers represent the high-level building blocks. These are deployable units. Examples include web applications, mobile apps, databases, and APIs.
What to Include
- Containers: Boxes representing the running technology.
- Technologies: Labels indicating the stack (e.g., Java, Python, PostgreSQL).
- Connections: Lines showing communication protocols (e.g., HTTP, gRPC, SQL).
Why It Helps Juniors
This level bridges the gap between the abstract system and the physical infrastructure. It tells the junior where the code actually runs. It clarifies deployment boundaries.
Key Teaching Points:
- Explain why a specific database was chosen.
- Discuss how the frontend communicates with the backend.
- Highlight security boundaries between containers.
If a junior needs to modify data, the Container diagram shows which service holds the data. They do not need to search every file. They know to look in the database service first.
Level 3: Component Diagrams ⚙️
Components are the logical units inside a container. These are not physical deployments. They are groups of functionality. For example, a “User Management” component inside a web application.
What to Include
- Components: Boxes representing distinct functions.
- Interfaces: Lines showing how components talk to each other.
- Responsibilities: Labels explaining what each component does.
Why It Helps Juniors
This is often the most useful layer for daily work. It defines the internal structure of a container. It helps juniors understand where to write code.
Mentorship Strategy:
- Ask the junior to draw the component diagram for a feature.
- Review the connections. Are they logical?
- Check if responsibilities are split correctly.
This exercise forces the junior to think about modularity. They learn that code should be organized by function, not just by file type. It encourages separation of concerns.
Level 4: Code Diagrams 💻
The Code level is rarely drawn manually. It is usually generated from the source code. It shows classes and objects.
When to Use It
Juniors rarely need to draw this. However, they should understand how to read it. Automated tools can generate these diagrams from the codebase.
Why It Matters:
- It validates the Component diagram.
- It shows dependencies between classes.
- It highlights circular dependencies.
Mentors should show juniors how to generate these diagrams. This teaches them how to use tools to explore the codebase without reading every line.
Comparing the Layers 📊
Understanding the distinction between layers is vital. Here is a comparison to clarify the differences.
| Level | Focus | Audience | Detail |
|---|---|---|---|
| Context | System Boundaries | Stakeholders | High |
| Container | Technology Stack | Developers | Medium |
| Component | Logical Structure | Developers | Low |
| Code | Implementation | Engineers | Very Low |
Notice how the audience changes. The Context diagram is for everyone. The Code diagram is only for those writing the code. Juniors should start with Context and move down only when necessary.
Mentoring Strategies for Diagramming 🤝
Creating diagrams is a skill. Juniors need guidance to do this effectively. Here are practical strategies for mentors.
1. Start with Whiteboards
Before opening software, use a whiteboard or paper. This removes the pressure of perfect shapes. It focuses on the logic. Let the junior sketch the Context diagram first.
2. Enforce Consistency
Define a standard for symbols. Use the same icon for a database everywhere. Use the same color for external systems. Consistency reduces cognitive load when reading the diagrams.
3. Review, Don’t Just Create
A diagram is only useful if it is understood. Have the junior explain the diagram to you. If they stumble, the diagram is unclear. If they can explain it, they understand the system.
4. Keep It Updated
Outdated diagrams are worse than no diagrams. They create false confidence. Encourage juniors to update the diagram when they change the code. Make this part of the definition of done.
5. Use Templates
Provide a template for each level. This ensures no critical information is missing. It also saves time. The junior focuses on the content, not the layout.
Common Pitfalls to Avoid ⚠️
Even with a good model, mistakes happen. Watch out for these common issues.
- Over-Engineering: Drawing too many components for a simple system. Keep it simple.
- Too Much Detail: Including database columns in a Component diagram. Stay at the logical level.
- Ignoring Data Flow: Focusing on boxes and forgetting the arrows. The arrows show the movement of information.
- Static Images: Treating the diagram as a one-time task. The system evolves. The diagram must evolve too.
Building a Culture of Visualization 🚀
When juniors understand diagrams, the whole team benefits. Communication improves. Onboarding speeds up. Code reviews become easier.
Benefits for the Team
- Faster Onboarding: New hires can read the diagrams before reading code.
- Better Documentation: Diagrams serve as living documentation.
- Clearer Design Decisions: Teams can discuss architecture before writing code.
- Reduced Knowledge Silos: Everyone understands the system, not just one person.
Handling Legacy Systems 🏛️
What if the system has no diagrams? You must build them from scratch. This is a great learning opportunity for juniors.
Steps to Reverse Engineer
- Identify the System: What is the name? What does it do?
- Map the Users: Who uses it? Who calls it?
- Find the Containers: Where does it run? What databases does it use?
- Extract Components: What are the main modules?
This process forces the junior to explore the codebase deeply. They learn the history of the system. They understand the technical debt.
Tools and Standards 🛠️
While specific tools are not required, standards are. The C4 Model provides the standard. The tool is secondary.
- Use any diagramming software that supports shapes and lines.
- Ensure the files are stored in the version control system.
- Keep the diagrams in a readable format (e.g., SVG, PNG).
The goal is accessibility. Anyone on the team should be able to open the file and understand it.
Measuring Success 📈
How do you know if the diagrams are working? Look for these signals.
- Reduced Questions: Juniors ask fewer questions about where to find code.
- Fewer Mistakes: Fewer incidents caused by misunderstanding boundaries.
- Better PRs: Pull requests are more focused and accurate.
- Active Participation: Juniors contribute to the documentation.
These metrics indicate that the junior has internalized the architecture. They are moving from a consumer of the system to a steward of it.
Final Thoughts on Mentorship 💡
Mentoring is about empowerment. It is about giving the tools to solve problems independently. Layered diagrams are one of those tools. They structure thought. They clarify communication.
When you guide a junior through the C4 Model, you are not just teaching them to draw boxes. You are teaching them to think about systems. You are showing them how to manage complexity. This skill lasts longer than any specific technology.
Start small. Pick one system. Draw one diagram. Explain it. Repeat. Over time, the complexity will feel less like a wall and more like a map. The junior developer will gain confidence. The team will gain efficiency.
Remember, the goal is understanding. If the diagram does not help the developer understand the code, it needs to change. Adapt the diagrams to the team’s needs. Keep the focus on clarity and learning.
By investing time in visualization, you build a stronger foundation for your team. You create a culture where knowledge is shared openly. You prepare the next generation of architects to handle the systems of tomorrow.