Designing complex software systems requires more than just writing code. It demands clear communication and a shared mental model among developers, stakeholders, and operations teams. When dealing with microservices architecture, this challenge intensifies. The distribution of logic across multiple services creates a web of dependencies that can easily become opaque. This is where the C4 model shines. It provides a structured approach to visualizing software architecture, breaking it down into four distinct levels of abstraction. By utilizing these levels, teams can document their systems effectively without overwhelming the audience with unnecessary detail.
This guide explores how to map microservices architecture using the C4 model levels. We will examine each layer in depth, discussing the appropriate content, the intended audience, and the specific challenges associated with documentation at each stage. The goal is to establish a sustainable documentation practice that evolves alongside the software.
📐 Understanding the C4 Model Framework
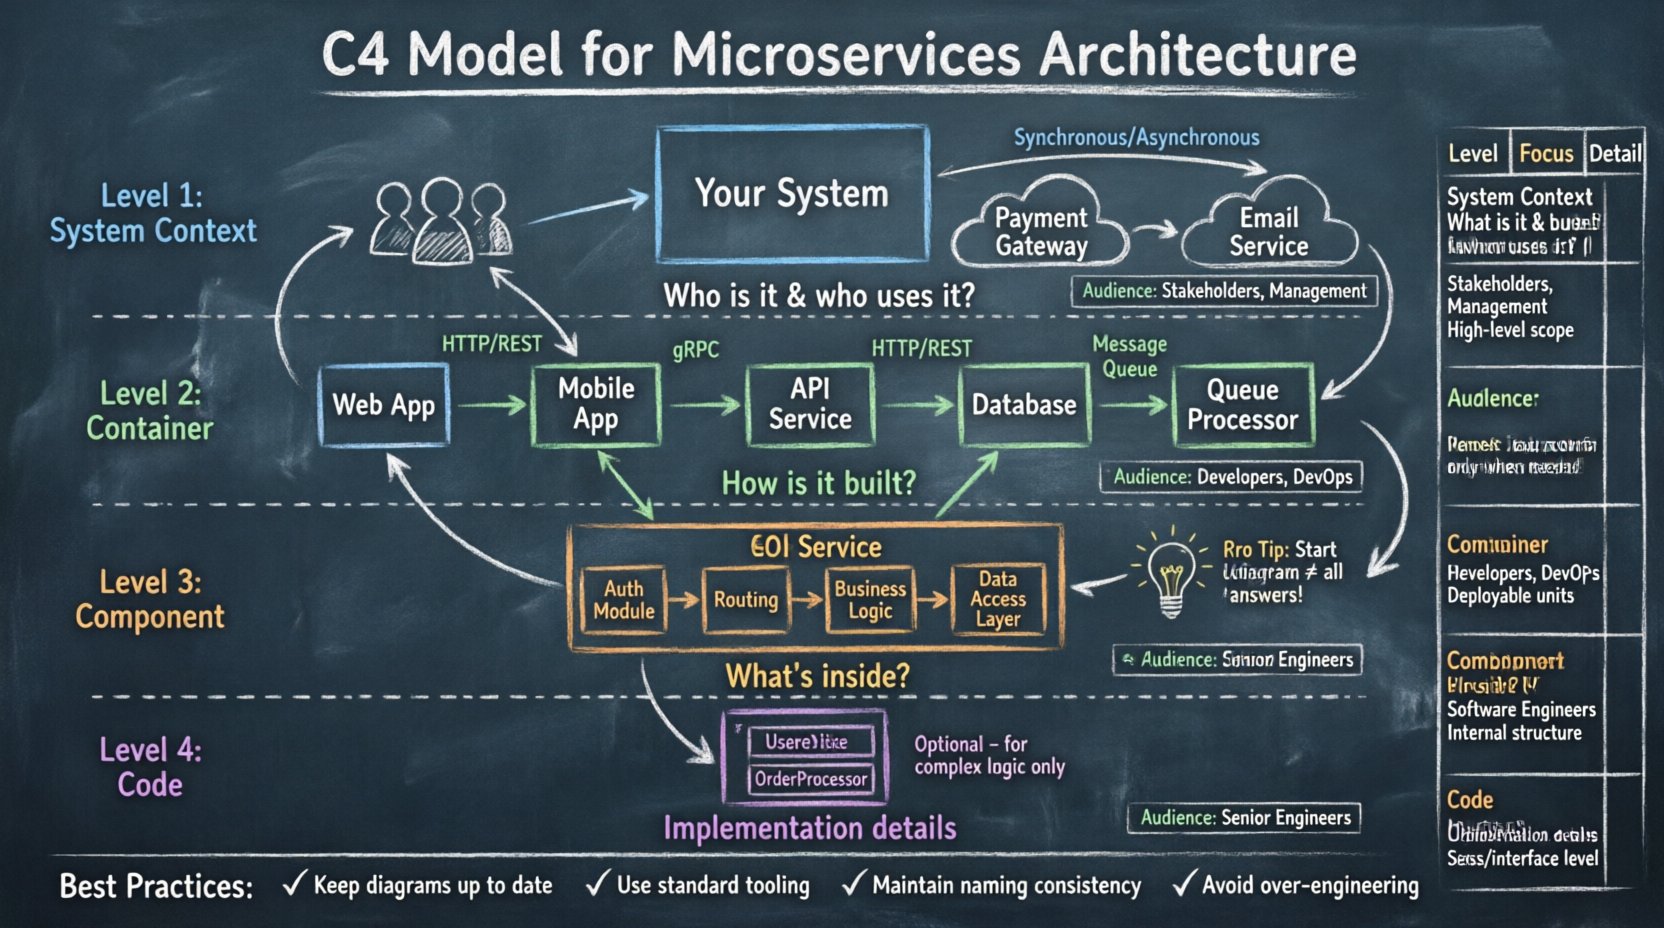
The C4 model stands for Context, Containers, Components, and Code. It is a hierarchy of diagrams that helps software architects and engineers communicate the structure of their systems. Unlike traditional Unified Modeling Language (UML) diagrams, which often get too bogged down in implementation details, the C4 model focuses on high-level structural relationships.
Why is this critical for microservices? In a monolithic architecture, the codebase is contained in a single repository. Visualizing the flow is straightforward. In a microservices environment, services are distributed, often deployed independently, and may use different technologies. A single diagram cannot capture the complexity. The C4 model solves this by offering a zoom-in mechanism.
Each level serves a specific purpose:
- Level 1: System Context – Shows how the system fits into the world.
- Level 2: Container – Shows the high-level building blocks of the system.
- Level 3: Component – Shows the internal structure of the containers.
- Level 4: Code – Shows the class structure (optional and rarely needed).
This progression allows you to start broad and narrow down only when necessary. It prevents the common pitfall of trying to explain everything in one massive, unreadable diagram.
🌍 Level 1: The System Context Diagram
The first level is the broadest view. It answers the question: “What is this system, and who interacts with it?” This diagram is the most important for non-technical stakeholders, including product managers, business analysts, and new hires.
📋 Key Elements
A System Context diagram typically contains the following elements:
- System in Scope: The application or platform you are documenting. This is the central box.
- Users: People who interact with the system. These can be internal employees or external customers.
- External Systems: Third-party services or legacy systems that communicate with your system.
🔗 Relationships and Data Flow
Connecting these elements are lines that represent interactions. These lines should indicate the type of communication:
- Synchronous: Requests that require an immediate response, such as an API call.
- Asynchronous: Events or background processing, such as email notifications or queued jobs.
- Data Store: Connections that imply reading or writing to a database located outside the immediate scope.
It is crucial to keep this diagram simple. Do not include internal details here. If a user interacts with a microservice, draw a line from the user to the System in Scope box, not directly to the specific microservice. This abstraction preserves the boundary of the system.
🎯 Audience and Purpose
The audience for this diagram includes anyone needing a high-level overview. It is used during project kickoff meetings to align on scope. It helps answer questions like: “Does this system need to talk to the payment gateway?” or “Who owns the user account data?”
By focusing on the boundary, you define the contract of the system. If a requirement changes that affects an external interaction, this diagram should be the first to update.
📦 Level 2: The Container Diagram
Once the boundary is established, we zoom in. The Container level answers: “How is the system built at a high level?” In microservices architecture, this is where the distinct services are defined.
📋 Defining a Container
A container is a deployable unit of software. It is not a specific technology, but rather a runtime environment. Examples include:
- A web application (running in a browser or server).
- A mobile application (running on a device).
- A database (storing persistent data).
- A background job processor (handling tasks asynchronously).
- A software library (shared code across multiple projects).
Each container has a specific purpose and technology stack. The diagram should group related containers together logically. For example, a frontend container and a backend API container might sit side by side, while a database container sits below them to indicate data storage.
🔗 Inter-Container Communication
The connections between containers are vital. They represent the architecture of the microservices. You must define:
- Protocol: Is the communication HTTP/REST, gRPC, GraphQL, or a message queue?
- Direction: Is the flow one-way or bidirectional?
- Data: What kind of data is passed? (e.g., “User Credentials”, “Order Details”, “Logs”).
Visual clarity is key here. Avoid spaghetti lines. If a container communicates with many others, consider grouping them or using a bus architecture visualization. The goal is to show the flow of control and data without cluttering the page.
🎯 Audience and Purpose
This diagram is primarily for developers and technical architects. It helps them understand how to deploy the system. It answers questions like: “Where does the API live?” “Is there a dedicated caching layer?” and “Do we need a separate service for notifications?”
It also aids in identifying dependencies. If a specific container relies on a legacy database, this relationship becomes visible. This visibility is essential for migration planning and refactoring efforts.
⚙️ Level 3: The Component Diagram
Zooming further in, the Component level answers: “What is inside this container?” A container is often too complex to be understood as a single block. It contains multiple logical groups of code that perform specific functions.
📋 Defining a Component
A component is a logical grouping of functionality. It is not a physical file or class, but a cohesive unit of work within the container. Examples include:
- API Gateway: Handles routing and authentication.
- Database Service: Manages persistence logic.
- Business Logic Module: Contains the core rules and calculations.
- Authentication Service: Handles user login and token management.
Unlike containers, components do not have their own runtime environment. They run inside the container. The diagram should show how these components interact to fulfill the requirements of the container.
🔗 Internal Relationships
Connections at this level are internal. They represent method calls, data access, or internal messaging. You should focus on:
- Interfaces: How components expose their functionality to others.
- Data Flow: How data moves from input to processing to output.
- Dependencies: Which components rely on others to function.
This level helps identify bottlenecks and coupling. If two components are tightly coupled, it might indicate a need for refactoring. It also helps new developers navigate the codebase by providing a map of logical responsibilities.
🎯 Audience and Purpose
This diagram is for software engineers working on the codebase. It serves as a reference during development and debugging. It clarifies ownership of specific features. If a bug occurs in the “Order Processing” logic, the component diagram shows exactly which part of the container handles it.
It is important not to over-document. If a component is simple, a list of methods may suffice. Only use a diagram if the internal logic is complex enough to warrant visualization.
💻 Level 4: The Code Diagram
The fourth level is rarely used in the C4 model. It focuses on the class structure within a component. It maps the specific objects, methods, and attributes.
📋 When to Use It
Most of the time, source code documentation (like Javadoc or TypeScript definitions) is sufficient. However, there are specific scenarios where a code-level diagram adds value:
- Complex Algorithms: When the logic involves intricate state machines or recursive processes.
- Design Patterns: When implementing specific patterns like Factory, Singleton, or Observer that benefit from visual explanation.
- Legacy Migration: When explaining how old code maps to new structures.
🎯 Audience and Purpose
The audience is strictly senior engineers or architects. For most day-to-day tasks, this level is unnecessary noise. It can quickly become outdated as code changes. The recommendation is to treat this as optional documentation.
📊 Comparing the C4 Levels
To better understand the distinctions, consider the following comparison table.
| Level | Focus | Audience | Duration of Validity | Detail Level |
|---|---|---|---|---|
| Context | System Boundary | Stakeholders, Management | Long Term | High |
| Container | Runtime Environments | Developers, DevOps | Medium Term | Medium |
| Component | Logical Grouping | Developers | Short Term | Low |
| Code | Class Structure | Senior Engineers | Very Short Term | Very Low |
Notice how the audience shifts from business to technical as you go deeper. This is intentional. You do not want to show a database schema to a product manager, nor do you want to show a business context diagram to a developer debugging a memory leak.
🛠️ Best Practices for Documentation
Creating these diagrams is an effort. To ensure they remain useful, follow these best practices.
🔄 Keep Them Up to Date
Outdated diagrams are worse than no diagrams. They create false confidence. Integrate diagram updates into your standard workflow. When a pull request changes the architecture, the diagram should be updated as part of the merge criteria. This ensures the documentation lives alongside the code.
📝 Use a Standard Tooling
Use tools that support the C4 syntax. This ensures consistency in how boxes and lines are drawn. Avoid drawing diagrams in generic image editors if possible, as they are hard to maintain. Version control your diagram files just like you do your source code.
🎨 Maintain Consistency
Stick to a consistent naming convention. If you call a container “User Service” in one diagram, do not call it “Auth Service” in another unless it is the same logical unit. Use standard icons for users, external systems, and containers to reduce cognitive load.
🚫 Avoid Over-Engineering
Do not create a Level 4 diagram for every single class. Focus on the complexity that matters. If a diagram becomes too crowded, split it into multiple views. It is better to have two clear diagrams than one confusing one.
⚠️ Common Pitfalls and How to Avoid Them
Even with a solid framework, teams often stumble. Here are common issues and how to navigate them.
❌ The “Big Ball of Mud” Diagram
This happens when developers try to draw every single dependency. The result is a tangled web that no one can read.
- Solution: Filter connections. Only show the most critical flows. Hide internal API calls between components if they are trivial.
❌ Static Documentation
Drawing a diagram once and never looking at it again.
- Solution: Treat documentation as a living artifact. Schedule regular reviews during sprint planning or architecture review boards.
❌ Ignoring the Audience
Showing code-level details to management or high-level business context to junior developers.
- Solution: Create a documentation index. Link to the appropriate diagram based on the reader’s role. Explain the purpose of each diagram at the top of the document.
❌ Tooling Overhead
Spending more time configuring the drawing tool than actually designing the architecture.
- Solution: Choose a tool that integrates with your existing workflow. If you use text-based configuration (like code-as-diagrams), leverage that to reduce friction.
📈 The Evolution of Microservices Documentation
As the system grows, the documentation must evolve. In the early stages, a monolith might only need a Context and Container diagram. As the system fragments into services, the Component level becomes essential.
It is also important to consider the lifecycle of a microservice. When a service is deprecated, it should be removed from the diagrams. When a new service is introduced, the diagrams should be updated immediately. This prevents the “ghost service” problem, where the architecture document says a service exists, but it has been shut down.
Versioning is another consideration. If you are running multiple versions of an API, the diagram should reflect that. It helps in understanding the migration path from one version to another.
🤝 Collaboration and Knowledge Sharing
The C4 model is not just about documentation; it is about collaboration. When a team sits down to draw the Level 2 diagram, they are forced to discuss the boundaries of their services. This often reveals hidden assumptions.
For example, one team might assume they own the data, while another assumes they only store it temporarily. Drawing the diagram forces these assumptions into the open. This alignment reduces technical debt and prevents integration failures later.
Use these diagrams during onboarding. A new developer can look at the Context diagram to understand where their service fits. They can look at the Container diagram to understand who they need to talk to. This reduces the time spent asking basic architectural questions.
🔍 Technical Considerations for Diagrams
When creating these visuals, keep technical constraints in mind.
- Layout: Group related services together. Avoid crossing lines where possible.
- Color: Use color to indicate status (e.g., production, staging, deprecated) or domain (e.g., finance, user management).
- Labels: Be concise. Use arrows to indicate flow direction. Label the lines with the data type or protocol.
- Responsiveness: Ensure the diagrams render well on different screen sizes, especially for mobile access during troubleshooting.
Remember that diagrams are a communication tool, not an end goal. Their value is measured by how much they reduce confusion and accelerate decision-making.
🔗 Integrating with Other Documentation
The C4 model does not exist in a vacuum. It should complement other documentation types.
- API Specifications: Link from the Component diagram to the API definition (like OpenAPI specs).
- Deployment Guides: Link from the Container diagram to the deployment instructions.
- Runbooks: Link from the System Context diagram to the incident response procedures.
This creates a web of knowledge where the architecture diagram acts as the central hub. It connects the “what” (diagram) with the “how” (guides) and the “why” (specifications).
📝 Summary of Implementation Steps
To implement this effectively in your organization, follow this sequence:
- Identify the System: Define the scope of the project.
- Create Context Diagram: Map users and external systems.
- Define Containers: Identify the major runtime units.
- Map Components: Break down complex containers.
- Review and Validate: Have the team verify accuracy.
- Publish and Maintain: Store in a central repository and update regularly.
By following this structured approach, you ensure that your microservices architecture remains understandable and manageable. The complexity of modern systems requires more than just code; it requires clarity. The C4 model provides the structure to achieve that clarity.