


The Visual Paradigm AI Bar Chart Generator is an innovative, web-based tool designed to simplify the process of creating professional bar charts. By harnessing artificial intelligence, this platform transforms raw data or textual descriptions into visually appealing and customizable bar charts, making data visualization accessible to everyone—regardless of technical or design expertise. Whether you’re a business professional, educator, researcher, or marketer, this tool empowers you to communicate data effectively with minimal effort.
This guide provides an in-depth look at the tool’s features, how it works, practical use cases, benefits, limitations, and step-by-step examples to help you get started.

What is the Visual Paradigm AI Bar Chart Generator?
The Visual Paradigm AI Bar Chart Generator is an online platform that leverages AI to automate the creation of bar charts. Users can input data in various formats—such as raw numbers, CSV files, or natural language descriptions—and the AI intelligently interprets the input to produce a polished bar chart. The tool eliminates the need for manual chart design or complex software, making it ideal for users who need quick, high-quality visualizations.
Accessible via the official tool page, the platform is part of Visual Paradigm’s suite of AI-driven diagramming and visualization tools, designed to streamline workflows and enhance productivity.
Key Features
1. AI-Powered Chart Creation
-
The AI engine interprets diverse data inputs, including:
-
Raw numerical data (e.g., sales figures, survey results).
-
CSV or spreadsheet files.
-
Plain text descriptions (e.g., “Show sales for Q1, Q2, Q3, and Q4 as 10, 20, 15, and 25”).
-
-
Automatically generates bar charts with appropriate labels, scales, and formatting.
2. Intuitive User Interface
-
Web-based with no software installation required.
-
Drag-and-drop functionality and a clean, user-friendly dashboard.
-
Suitable for beginners and advanced users alike.
3. Extensive Customization Options
-
Adjust chart elements such as:
-
Colors (individual bars, backgrounds, or themes).
-
Labels (titles, axis names, data values).
-
Orientation (vertical or horizontal bars).
-
Bar styles (stacked, grouped, or clustered).
-
-
Apply branding elements like logos or custom fonts.
4. Multiple Export Formats
-
Export charts as PNG, JPG, SVG, or PDF for seamless integration into reports, presentations, or websites.
-
High-resolution outputs ensure professional-quality visuals.
5. Collaboration and Sharing
-
Generate shareable links for charts or embed them directly into web pages.
-
Supports team collaboration, allowing multiple users to edit or comment on charts (depending on the platform’s subscription plan).
6. Real-Time Preview
-
View changes instantly as you customize the chart, ensuring the final output matches your vision.
How Does It Work?
The process of creating a bar chart with the Visual Paradigm AI Bar Chart Generator is straightforward:
-
Input Data: Enter data manually, upload a CSV file, or describe the chart in natural language.
-
AI Processing: The AI analyzes the input, identifies key data points, and selects an appropriate chart format.
-
Chart Generation: A draft bar chart is created within seconds.
-
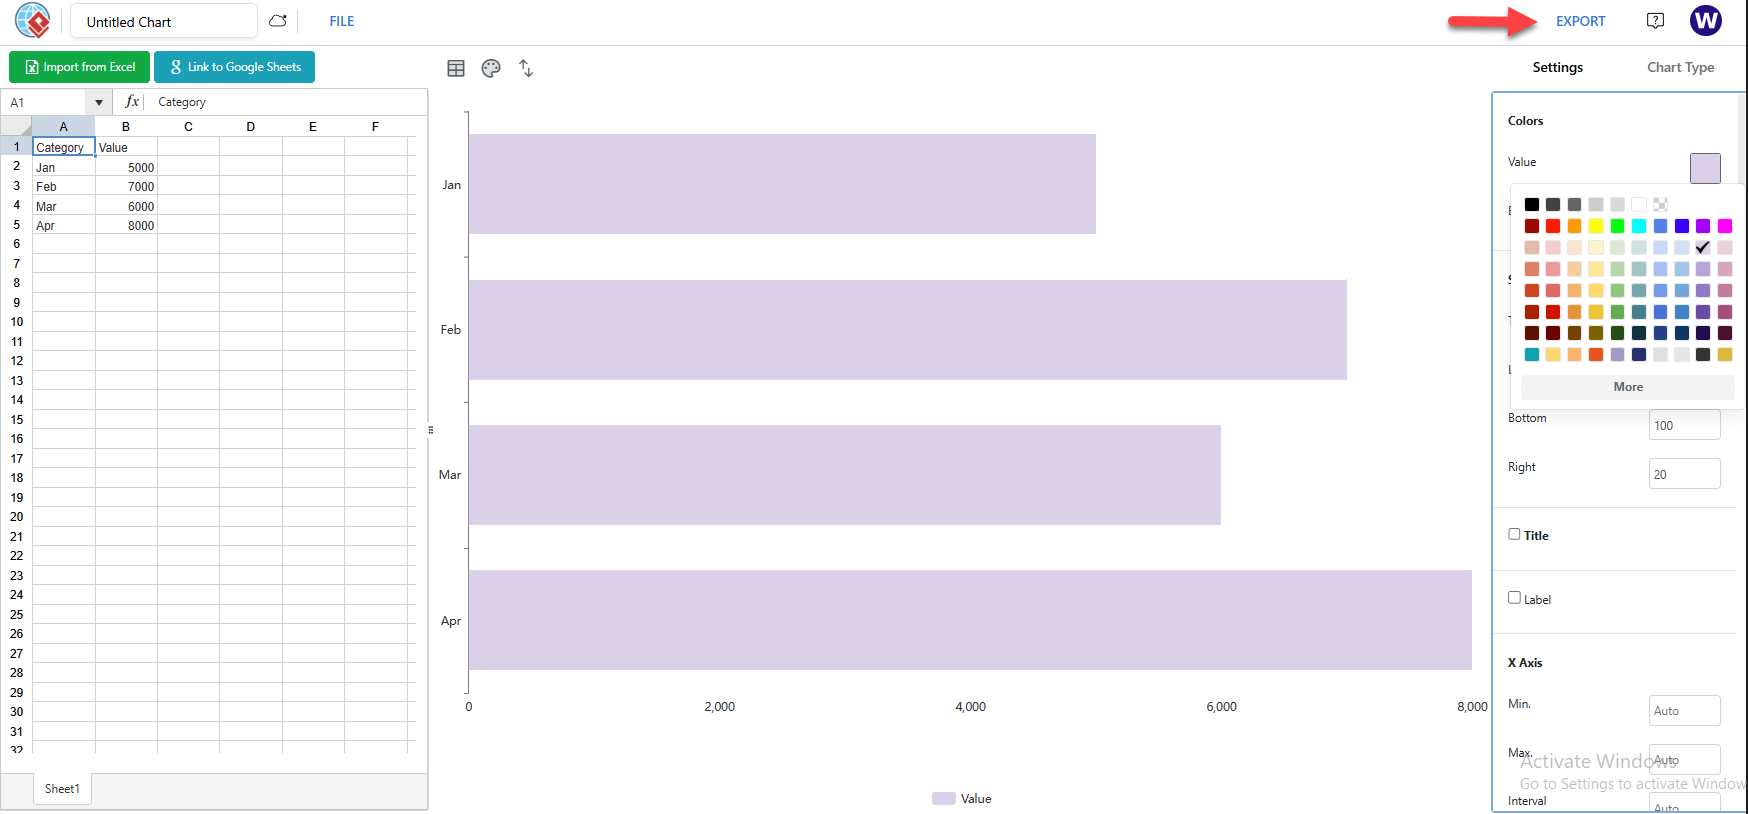
Customization: Modify colors, labels, orientation, or other settings using the intuitive editor.
-
Export/Share: Download the chart in your preferred format or share it via a link or embed code.
Practical Examples
Example 1: Business Sales Report
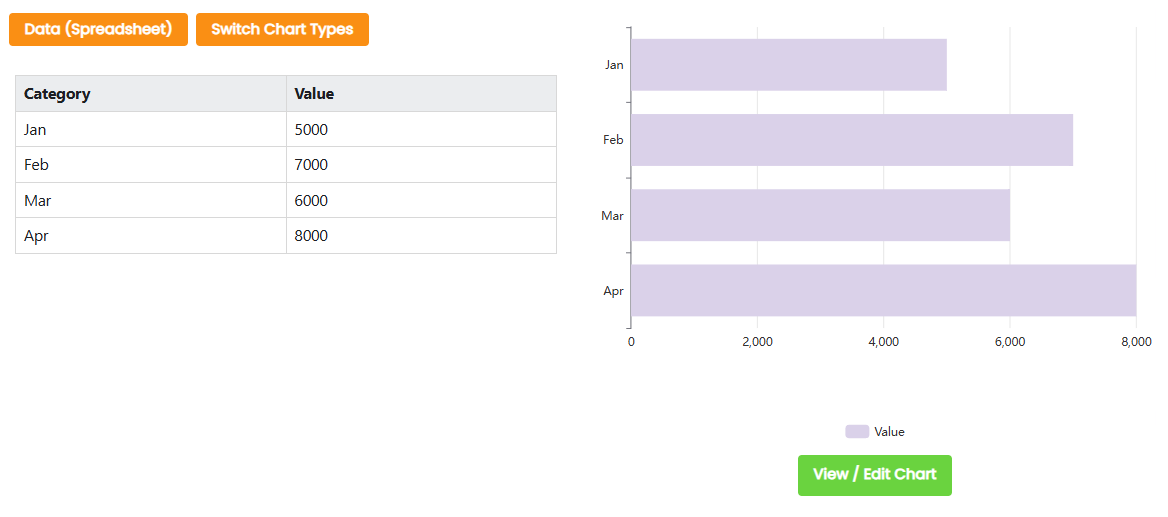
Scenario: A small business owner wants to visualize monthly sales data for 2024 to present to stakeholders.
-
Input: The user types: “Create a bar chart showing sales for January (5000), February (7000), March (6000), and April (8000).”
-
AI Output: The tool generates a vertical bar chart with months on the x-axis and sales (in dollars) on the y-axis.
-
Customization: The user selects a blue-and-green color scheme, adds a title (“2024 Monthly Sales”), and enables data labels on each bar.
-
Export: The chart is downloaded as a PNG for inclusion in a PowerPoint presentation.
Result: A professional bar chart that clearly communicates sales trends to stakeholders.
Example 2: Educational Assignment
Scenario: A high school teacher needs a chart to display student survey results on favorite subjects.
-
Input: The teacher uploads a CSV file with the following data:
Subject, Votes Math, 15 Science, 20 History, 10 English, 25 -
AI Output: The tool creates a horizontal bar chart with subjects on the y-axis and vote counts on the x-axis.
-
Customization: The teacher chooses bright, distinct colors for each subject and adds a title (“Student Favorite Subjects Survey”).
-
Export: The chart is exported as a PDF for inclusion in a classroom handout.
Result: A visually engaging chart that students can easily interpret.
Example 3: Marketing Campaign Analysis
Scenario: A marketing team wants to compare the performance of three advertising campaigns.
-
Input: The user describes: “Show a grouped bar chart comparing clicks and conversions for Campaign A (1000 clicks, 50 conversions), Campaign B (800 clicks, 40 conversions), and Campaign C (1200 clicks, 60 conversions).”
-
AI Output: The tool generates a grouped bar chart with campaigns on the x-axis and two bars per campaign (one for clicks, one for conversions).
-
Customization: The team applies their brand’s color palette and adjusts the legend for clarity.
-
Export: The chart is embedded on the company’s website using the provided embed code.
Result: A clear, comparative visualization that highlights campaign performance.
Use Cases
The Visual Paradigm AI Bar Chart Generator is versatile and can be applied across various domains:
-
Business: Visualize financial metrics (e.g., revenue, expenses, profit margins) or operational data (e.g., employee productivity, customer satisfaction).
-
Education: Create charts for classroom activities, student projects, or research papers.
-
Research: Illustrate quantitative findings, such as survey results or experimental data, for academic publications.
-
Marketing: Showcase campaign performance, customer demographics, or market trends.
-
Nonprofits: Present fundraising progress, program impact, or community survey results.
-
Personal Projects: Create charts for budgeting, fitness tracking, or hobby-related data analysis.
Benefits
-
Time-Saving: Automates chart creation, reducing hours of manual work to minutes.
-
Accessibility: No design, coding, or data visualization expertise required.
-
Professional Output: Produces high-quality charts suitable for presentations, reports, or publications.
-
Flexibility: Supports a wide range of data types and chart styles.
-
Cost-Effective: Offers free access to basic features, with premium options for advanced functionality (check Visual Paradigm’s pricing for details).
Limitations
-
Learning Curve for Advanced Features: While basic charts are easy to create, mastering advanced customization may require some practice.
-
Dependency on Internet: As a web-based tool, it requires a stable internet connection.
-
Subscription Costs: Advanced features, such as collaboration or high-volume exports, may require a paid plan.
-
Data Input Limits: Large datasets or highly complex inputs may require preprocessing for optimal results.
Getting Started
To create your first bar chart with the Visual Paradigm AI Bar Chart Generator:
-
Visit the AI Bar Chart Generator page.
-
Input your data (e.g., type a description, enter numbers manually, or upload a CSV file).
-
Review the AI-generated chart and use the editor to customize colors, labels, or orientation.
-
Export the chart in your desired format (PNG, JPG, SVG, or PDF) or share it via a link.
-
For advanced features, consider exploring Visual Paradigm’s subscription plans for additional tools and collaboration options.
Tips for Best Results
-
Be Clear with Inputs: Use concise, specific descriptions for natural language inputs to ensure accurate AI interpretation.
-
Check Data Accuracy: Verify your data before inputting to avoid errors in the chart.
-
Experiment with Customization: Test different color schemes and layouts to find the most visually appealing option.
-
Use for Storytelling: Combine charts with narrative text in reports or presentations to enhance data communication.
Conclusion
The Visual Paradigm AI Bar Chart Generator is a game-changer for anyone looking to create professional, data-driven visualizations without the hassle of traditional charting software. Its AI-driven approach, user-friendly interface, and robust customization options make it a go-to tool for businesses, educators, researchers, and more. By transforming raw data into clear, compelling bar charts, this platform empowers users to tell impactful data stories with ease.
Whether you’re presenting sales figures, analyzing survey results, or teaching students about data visualization, the Visual Paradigm AI Bar Chart Generator is a reliable, efficient, and versatile solution. Visit the official tool page to start creating your own bar charts today.
Citations:
[1] https://ai.visual-paradigm.com/ai-chart-generator/ai-bar-chart-generator