💡 Key Takeaways
- Standardized Notation: UML provides a universal language for visualizing system design, ensuring clear communication across teams.
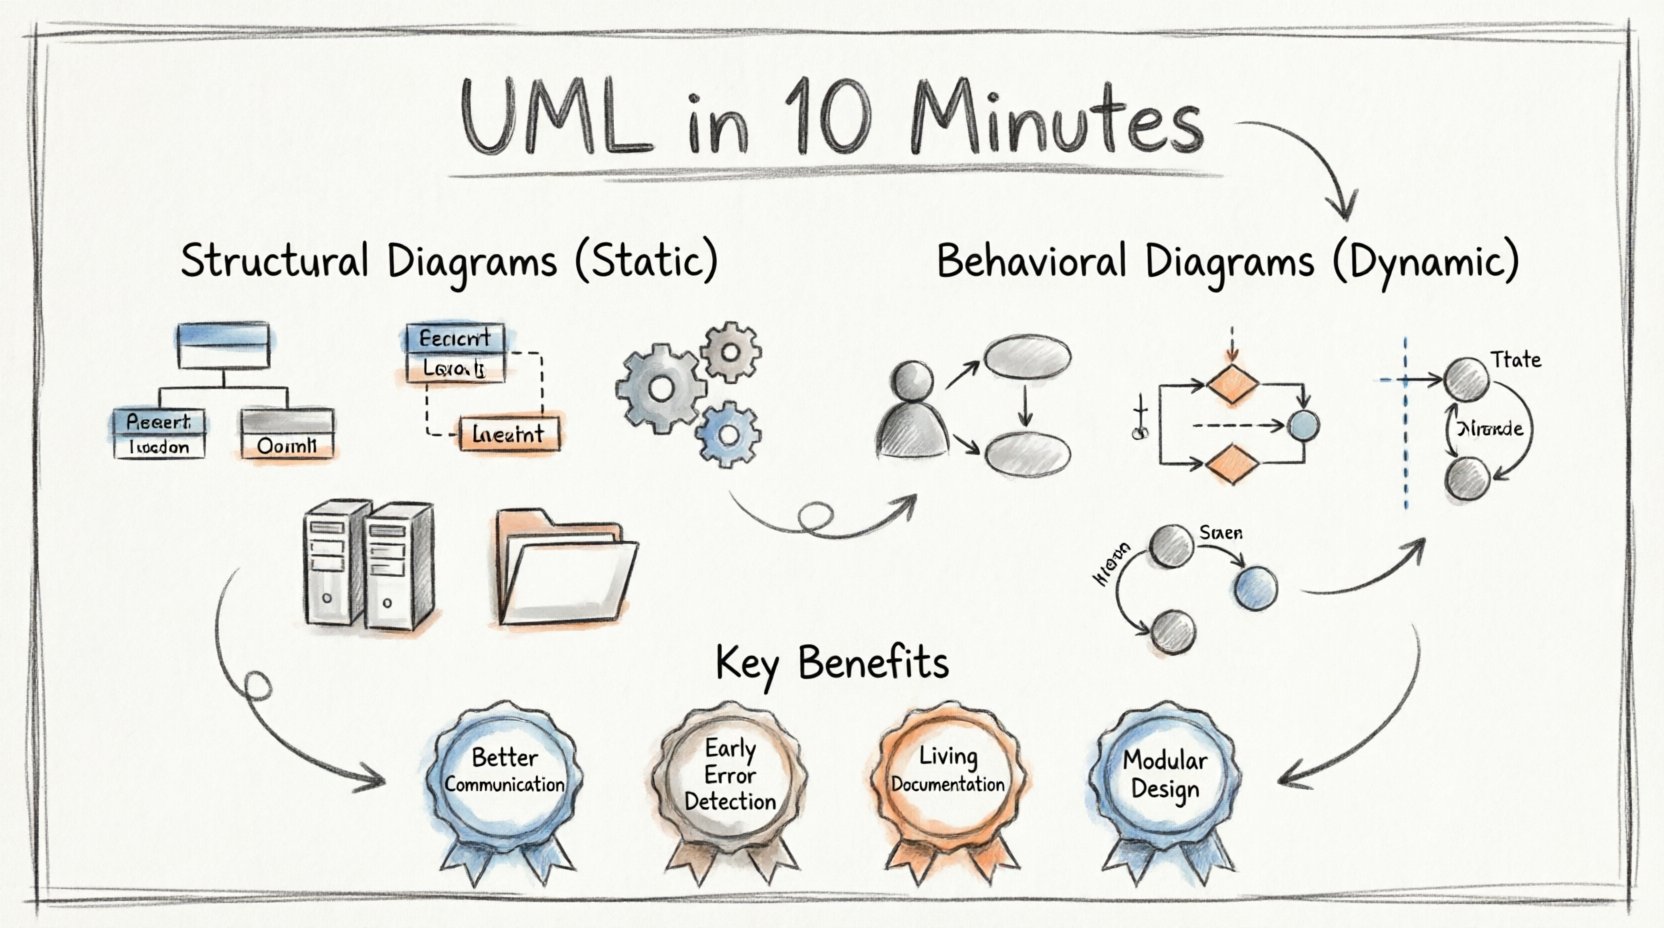
- Two Main Categories: Structural diagrams define static aspects, while behavioral diagrams capture dynamic interactions.
- Industry Standard: Widely adopted in software engineering to model complex systems before coding begins.
- Clarity Over Complexity: The goal is to simplify understanding, not add unnecessary layers to the design process.
In the realm of software engineering and system architecture, clarity is currency. When multiple stakeholders collaborate on a complex project, ambiguity can lead to costly errors. Unified Modeling Language (UML) serves as the blueprint for these systems. It is a standardized visual language used to specify, construct, and document the artifacts of software systems. This guide breaks down the core concepts, diagram types, and practical applications of UML without relying on specific proprietary tools.
What Exactly Is UML? 🤔
Unified Modeling Language is not a programming language. It does not execute code or generate binaries directly. Instead, it is a modeling language. Think of it as a set of symbols and rules that allow architects and developers to communicate the structure and behavior of a system visually. Before writing a single line of code, teams use these diagrams to map out logic, data flows, and interactions.
The standard is maintained by the Object Management Group (OMG). Since its adoption in the late 1990s, it has become the industry norm. Its primary strength lies in abstraction. It allows engineers to zoom in on specific components or zoom out to view the entire system ecosystem.
A Brief History 📜
Before UML, there was a proliferation of competing object-oriented modeling methods. In the early 1990s, three distinct methodologies dominated the market: Grady Booch’s method, the Object Modeling Technique (OMT), and the Object-Oriented Software Engineering (OOSE) method. These approaches had different notations and philosophies, making collaboration difficult.
In 1994, Booch, James Rumbaugh, and Ivar Jacobson came together to unify these methods. Their goal was to create a single, common language that combined the best features of each. By 1997, UML was submitted to the OMG as a standard. This unification allowed for greater interoperability between different development teams and tools.
The Two Pillars of UML 🏗️
UML diagrams are generally categorized into two main groups. Understanding the distinction between these pillars is essential for effective modeling.
- Structural Diagrams: These focus on the static aspects of the system. They describe what the system consists of. This includes classes, objects, components, and their relationships.
- Behavioral Diagrams: These focus on the dynamic aspects. They describe how the system behaves over time. This includes interactions, states, and activities.
Structural Diagrams: The Skeleton 🦴
Structural diagrams provide a snapshot of the system at a specific point in time. They are the foundation upon which the logic is built.
1. Class Diagram 📊
This is the most common diagram used in UML. It represents the static structure of a system by showing its classes, attributes, operations, and the relationships among objects. It is fundamental for object-oriented design.
2. Object Diagram 🗂️
An object diagram shows a complete or partial view of a system’s structure at a specific moment. It represents instances of classes. While a class diagram defines the types, an object diagram shows actual data populated within those types.
3. Component Diagram ⚙️
Component diagrams describe the organization and dependencies between components. A component is a modular part of a system that encapsulates implementation. This is crucial for understanding high-level architecture and how different modules interact.
4. Deployment Diagram 🌐
This diagram illustrates the physical hardware on which the system runs. It shows nodes (computers or devices) and the artifacts deployed on them. It helps in planning infrastructure and understanding runtime environments.
5. Package Diagram 📁
For large systems, organization is key. Package diagrams group elements into packages to reduce complexity. They show the relationships between packages, such as dependencies or imports, helping to manage large codebases.
6. Composite Structure Diagram 🧩
This diagram shows the internal structure of a class. It displays parts, ports, and connectors within a classifier. It is useful for revealing how a complex object is composed of smaller parts.
7. Profile Diagram 🏷️
Profiles allow for the extension of UML. They add domain-specific concepts to the language. This is often used to customize UML for specific industries or technologies.
Behavioral Diagrams: The Movement 🔄
While structural diagrams define the hardware and classes, behavioral diagrams define the logic and flow. They answer the question: “What happens?”
1. Use Case Diagram 🎯
Use case diagrams model the functional requirements of a system. They show actors (users or external systems) and the use cases (actions or services) they can perform. This is often the first diagram created to understand user needs.
2. Activity Diagram 📝
Similar to a flowchart, activity diagrams model the flow of control from activity to activity. They describe the business processes or the workflow within the system. They are excellent for modeling complex logic and parallel processes.
3. Sequence Diagram 💬
Sequence diagrams focus on the interaction between objects over time. They show messages passed between objects in the order they occur. This is vital for understanding the lifecycle of data and the timing of operations.
4. Communication Diagram 📡
Formerly known as Collaboration Diagrams, these focus on the structural organization of objects that send and receive messages. They emphasize the relationships between objects rather than the strict sequence of time.
5. State Machine Diagram 🚦
State diagrams model the life cycle of an object. They show the states an object can be in and the transitions that occur between them based on events. This is critical for systems with complex state logic, such as payment gateways or traffic light controllers.
6. Interaction Overview Diagram 🎞️
This combines activity diagrams with other interaction diagrams. It provides a high-level view of control flow, using nodes that represent interaction diagrams. It is useful for summarizing complex interactions.
Why Use UML? 📈
Adopting a modeling language offers tangible benefits to the development lifecycle. It is not just about drawing pictures; it is about reducing risk and improving quality.
| Benefit | Impact |
|---|---|
| Improved Communication | Provides a common visual language for developers, stakeholders, and clients. |
| Early Error Detection | Identifies logical flaws during the design phase, which is cheaper to fix than in production. |
| Documentation | Diagrams serve as living documentation that evolves with the system. |
| Modularity | Encourages breaking down complex systems into manageable components. |
Best Practices for Modeling 🛠️
To get the most value from UML, teams should adhere to certain principles. Over-modeling can be as detrimental as under-modeling.
- Start Simple: Begin with high-level use cases before diving into class details.
- Iterate: Models should evolve as requirements change. Do not treat them as static documents.
- Keep it Clean: Avoid cluttering diagrams with unnecessary details. Focus on the relevant aspects for the audience.
- Consistency: Ensure notation is consistent across all diagrams in the project.
- Link to Code: Where possible, ensure the design aligns with the actual implementation to maintain fidelity.
Common Misconceptions ❌
There are several myths surrounding this modeling language. Clarifying these helps teams integrate it more effectively.
Myth 1: It is only for software.
While dominant in software, UML is applicable to business processes, enterprise architecture, and system engineering.
Myth 2: You must draw everything.
Not every aspect of a system requires a diagram. Focus on areas of complexity or high risk.
Myth 3: It slows down development.
Proper modeling accelerates development by preventing rework. The time spent designing is recovered in reduced debugging time.
Implementation in Modern Workflows 🚀
Modern development environments often integrate modeling tools directly. These tools allow for round-trip engineering, where changes in code update diagrams and vice versa. This ensures that documentation remains accurate without manual maintenance.
Agile methodologies have also adapted UML. Rather than heavy upfront design, teams may use “just enough” modeling to clarify requirements before a sprint. This keeps the process lightweight while retaining the benefits of visualization.
Final Thoughts on System Design 🎨
Unified Modeling Language remains a cornerstone of system design. It bridges the gap between abstract requirements and concrete implementation. By providing a structured way to visualize systems, it reduces the cognitive load on engineers and stakeholders alike.
Whether you are designing a microservice architecture or a monolithic application, the principles of UML offer a framework for clarity. The diagrams are not the product; they are the map. A good map does not guarantee the destination, but it ensures you do not get lost on the way.
As technology evolves, the need for clear communication does not diminish. UML adapts to new paradigms, continuing to serve as a vital tool for anyone involved in building complex systems.