💡 Key Takeaways
- Visual Clarity: Modeling transforms abstract requirements into concrete visual representations, reducing ambiguity.
- Risk Reduction: Identifying logical flaws early in the design phase prevents costly errors during implementation.
- Communication Bridge: UML diagrams serve as a universal language between stakeholders, analysts, and developers.
- Documentation Standard: Models provide a living reference for system behavior that evolves with the software.
Understanding System Analysis Modeling 🧠
System analysis is the process of studying a business or technical environment to identify objectives and the means to achieve them. Within this discipline, modeling serves as the backbone of understanding complex interactions. It is not merely about drawing pictures; it is about constructing a logical map of how data flows, how components interact, and how the system behaves under various conditions.
When developers and analysts speak of modeling, they often refer to a structured approach using notation systems. The Unified Modeling Language (UML) stands as the industry standard for visualizing system design. It provides a set of graphical notation techniques to create visual models of object-oriented software systems. This standardization allows teams to discuss architecture without getting lost in syntax-specific details.
The primary goal of modeling in this context is abstraction. Real-world systems are incredibly complex. Trying to manage every variable at once leads to confusion. Modeling allows teams to zoom in on specific aspects—such as data structure, process flow, or user interaction—while ignoring irrelevant details for that specific view.
Why Modeling Matters in Analysis 📉
Before writing a single line of code, the system must be understood. Modeling bridges the gap between business requirements and technical implementation. Without this bridge, assumptions often lead to defects that are expensive to fix later.
Here are the core benefits of incorporating modeling early in the analysis phase:
- Early Detection of Errors: Logical inconsistencies become visible in diagrams long before they become bugs in code.
- Shared Understanding: Stakeholders who are not technical can review diagrams to confirm that the system matches their expectations.
- Documentation: Models act as up-to-date documentation. Unlike text, which often becomes outdated, a well-maintained model reflects the current state of the system.
- Complexity Management: Large systems are broken down into smaller, manageable subsystems through modeling.
Core UML Diagrams for System Analysis 📐
UML defines several types of diagrams, each serving a different purpose in the analysis process. Selecting the right diagram type is crucial for effective communication.
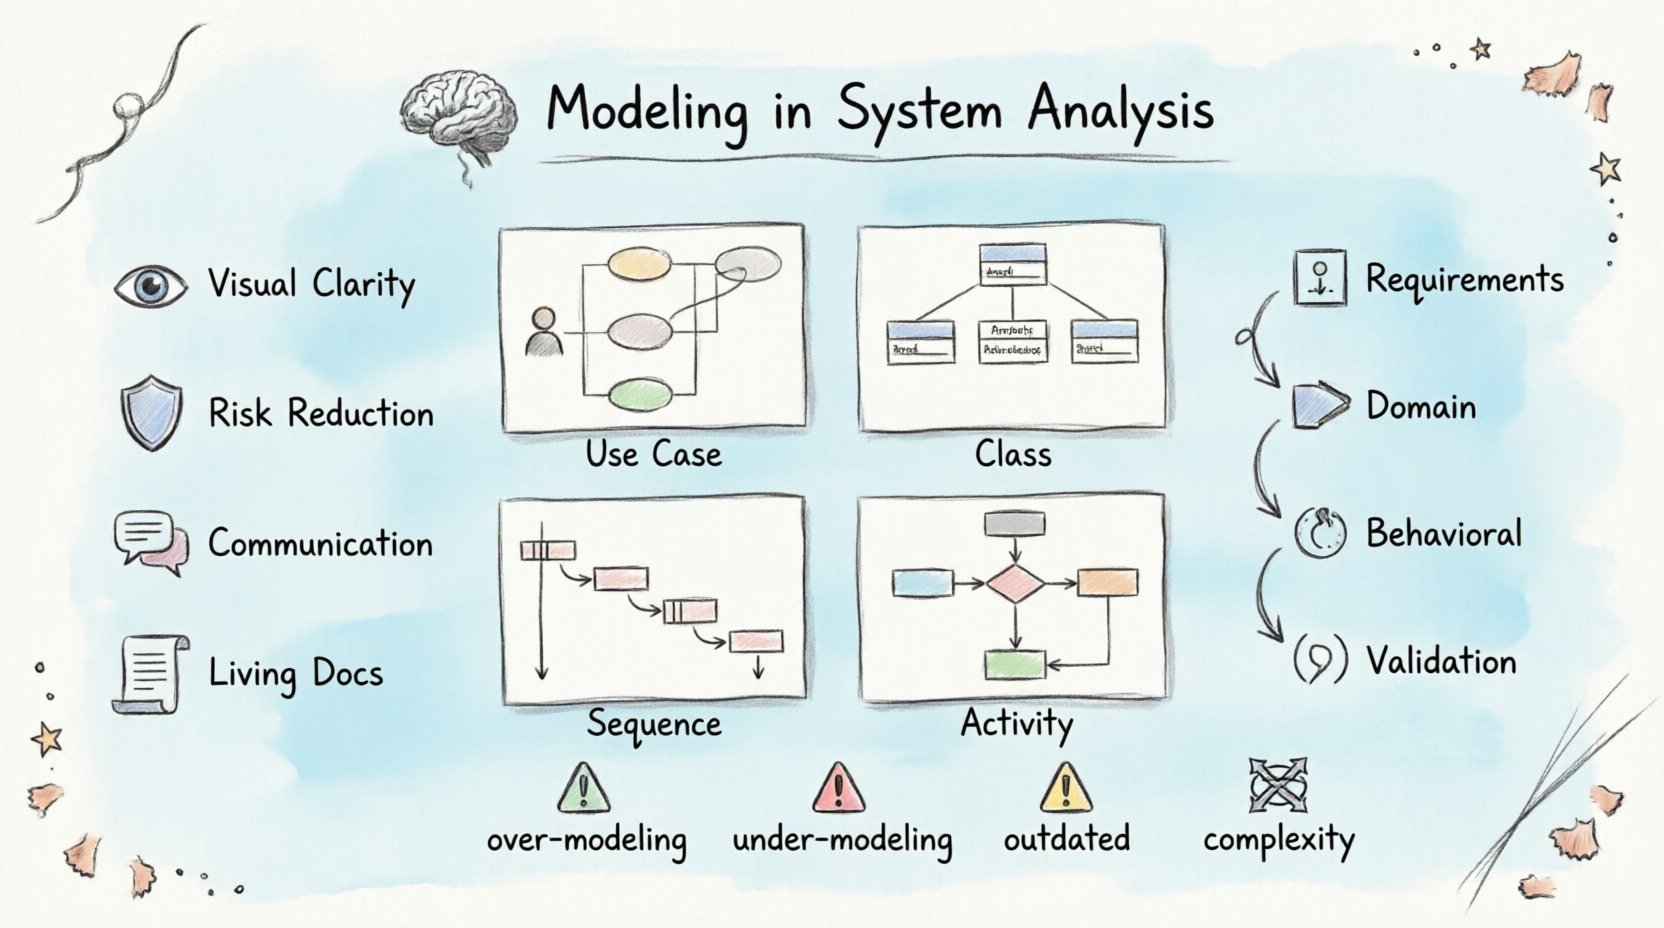
1. Use Case Diagrams 👤
Use case diagrams capture the functional requirements of a system. They depict the interactions between actors (users or external systems) and use cases (specific goals or functions). This is often the first diagram created during analysis to ensure the scope is correct.
It answers questions like: Who is using the system? What are they trying to achieve? This diagram does not show how the system works internally, only what it does from an external perspective.
2. Class Diagrams 📂
Class diagrams are the backbone of the static structure. They show the system’s classes, attributes, operations, and the relationships between objects. In analysis, this helps define the data model and the entities involved.
Key elements include:
- Classes: Blueprints for objects.
- Attributes: Data stored within the class.
- Operations: Methods or functions available.
- Relationships: Associations, aggregations, compositions, and inheritance.
3. Sequence Diagrams 🔄
Sequence diagrams illustrate how objects interact over time. They are essential for understanding the dynamic behavior of a system. By ordering messages between objects, analysts can trace the lifecycle of a specific request.
For example, when a user submits a form, a sequence diagram shows the flow from the interface to the controller, then to the service layer, and finally to the database. This helps identify bottlenecks or missing validation steps.
4. Activity Diagrams ⚙️
Activity diagrams are similar to flowcharts. They model the flow of control from activity to activity. They are useful for describing business processes or algorithms. They can show parallel processes, decision points, and loops.
This is particularly helpful for complex workflows where multiple paths are possible depending on user input or system state.
The Modeling Process in Analysis 🛠️
Modeling is not a one-time event. It is an iterative process that evolves as understanding deepens. The typical workflow involves several stages.
Requirement Gathering
The analysis begins with collecting requirements. Interviews, surveys, and document reviews provide the raw material. At this stage, high-level use case diagrams are drafted to map out user goals.
Domain Modeling
Next, the domain is analyzed to identify key concepts and entities. Class diagrams are created to represent the core business objects. This ensures that the technical model aligns with the business vocabulary.
Behavioral Modeling
Once the structure is defined, behavior is added. Sequence and activity diagrams describe how the system reacts to events. This step often reveals gaps in the logic or missing error handling paths.
Validation and Refinement
Models are reviewed by stakeholders and technical leads. Feedback is incorporated, and diagrams are refined. This cycle continues until the model accurately reflects the intended system.
Common Pitfalls to Avoid ⚠️
While modeling is powerful, it can be misused. Teams should be aware of common mistakes that reduce the value of the effort.
| Pitfall | Consequence | Mitigation |
|---|---|---|
| Over-Modeling | Creating too many diagrams for simple systems wastes time. | Focus on diagrams that add value. Skip what is obvious. |
| Under-Modeling | Missing critical details leads to rework later. | Ensure all major flows and entities are represented. |
| Outdated Models | Models that do not match the code cause confusion. | Keep models synchronized with code changes or treat them as living documents. |
| Complexity Without Purpose | Diagrams become unreadable and unusable. | Use layers. Show high-level views first, details later. |
Communication and Collaboration 🤝
One of the most significant advantages of modeling is its role in communication. In many projects, business analysts, developers, and testers speak different languages. UML provides a neutral ground.
When a developer sees a sequence diagram, they understand the expected message flow. When a tester sees a state diagram, they understand the valid transitions. This shared visual language reduces the need for lengthy textual explanations and minimizes misinterpretation.
Furthermore, models facilitate remote collaboration. Instead of describing a complex interaction over a phone call, a team can share a diagram and discuss it asynchronously. This is particularly useful in distributed teams where time zones differ.
Integrating Modeling with Agile Practices 🚀
Some teams worry that modeling conflicts with agile methodologies, which favor working software over comprehensive documentation. However, modeling can be adapted to fit agile workflows.
In agile, modeling is often done just-in-time. Instead of creating a massive architecture document before coding starts, models are created for the specific user story being worked on. This “sketching” approach keeps the overhead low while retaining the clarity benefits.
Lightweight models, such as whiteboard sketches or digital sticky notes, can serve the same purpose as formal UML diagrams. The key is to ensure the model serves the team’s understanding, not just the requirement of having a document.
Conclusion 📝
Modeling in system analysis is an indispensable practice for building reliable software. It transforms vague ideas into structured blueprints, allowing teams to identify issues before they become problems. By leveraging UML, organizations can improve communication, reduce risk, and ensure that the final product aligns with business goals.
While the tools and techniques may evolve, the fundamental need to visualize and understand system complexity remains constant. Effective modeling is not about creating perfect diagrams; it is about achieving clarity.