Now Reading: The Complete Guide to the C4 Model: Visualizing Software Architecture with Clarity and Purpose
-
01
The Complete Guide to the C4 Model: Visualizing Software Architecture with Clarity and Purpose


The Complete Guide to the C4 Model: Visualizing Software Architecture with Clarity and Purpose
“A picture is worth a thousand words — but only if it’s the right picture.”
— Adapted from the spirit of the C4 Model
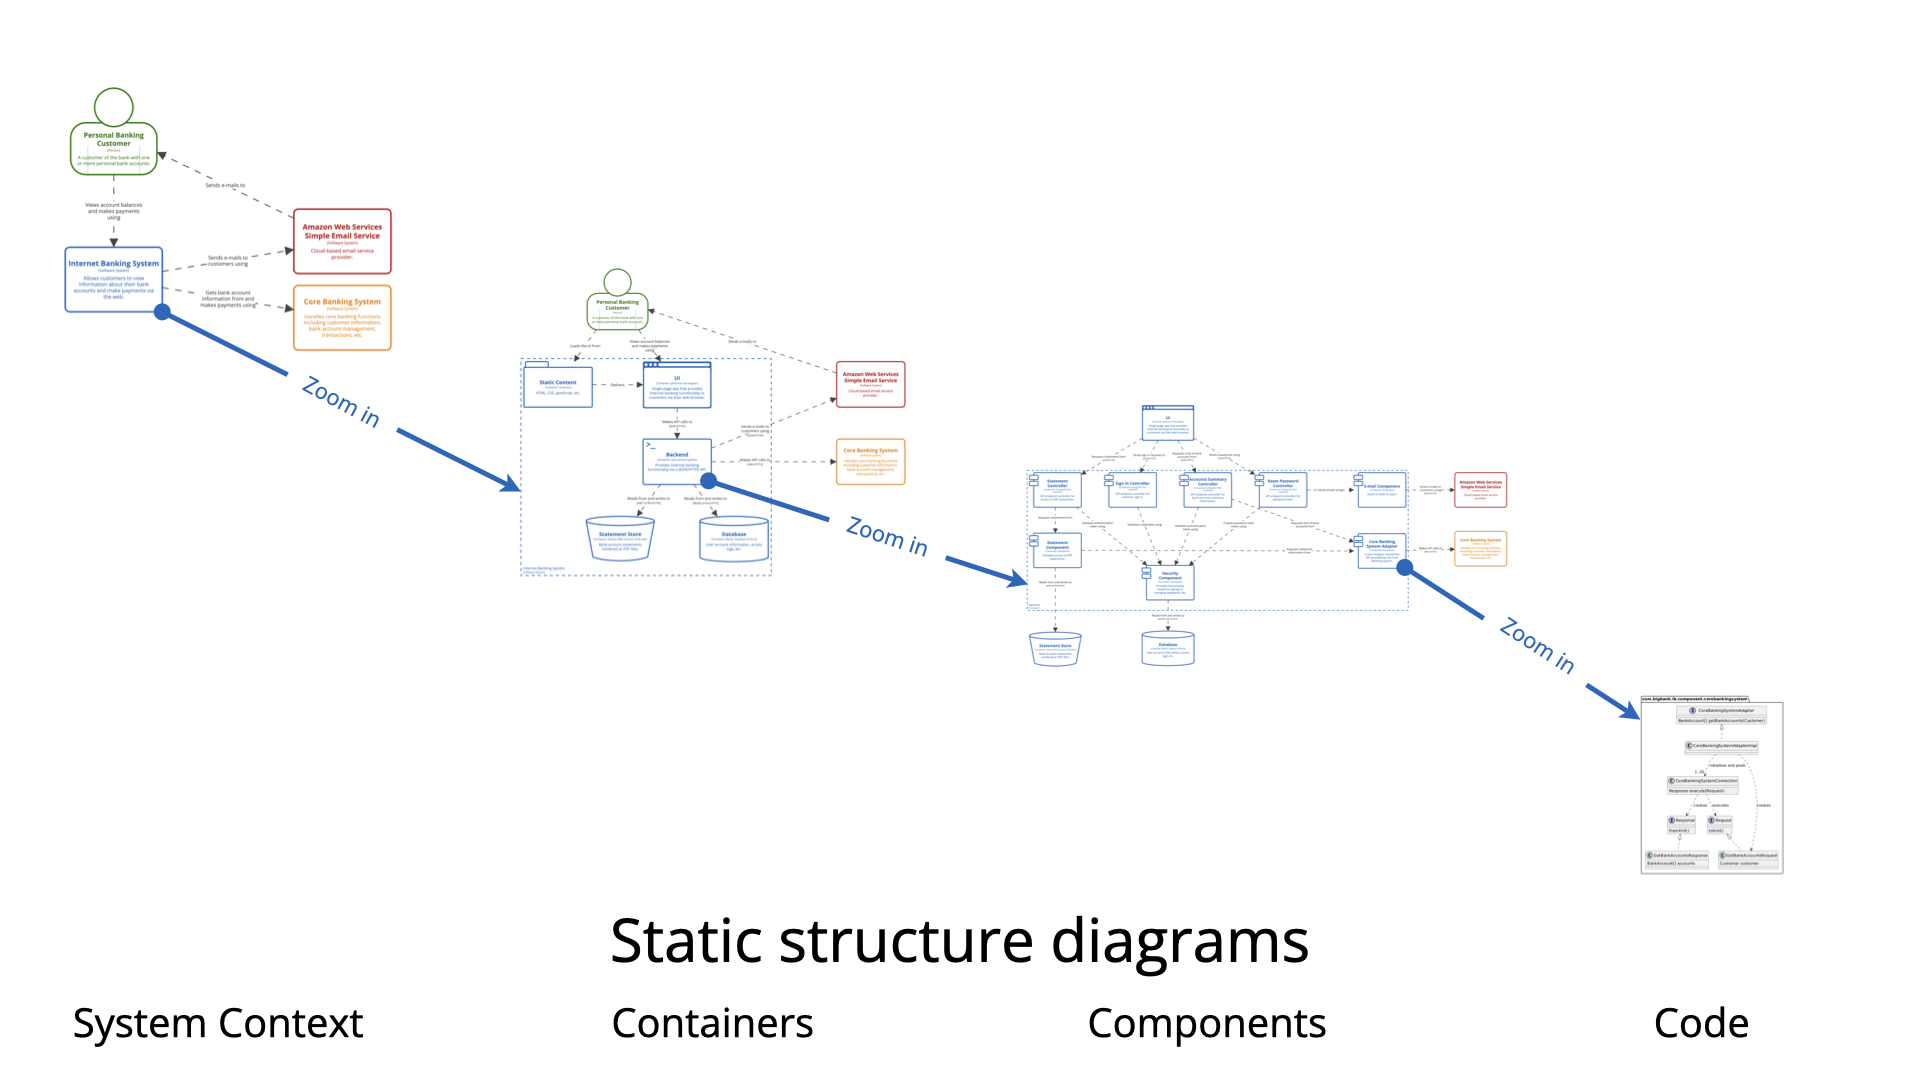
The C4 Model (Context, Containers, Components, Code) is a powerful, lightweight, and hierarchical approach to documenting software architecture. Created by Simon Brown, it’s designed to make complex systems understandable across teams and stakeholders — from CEOs to junior developers.
This guide walks you through every level of the model, explains best practices, shows real-world examples, and gives you tools to apply C4 in your own projects.
🔍 Why Use the C4 Model?
Before diving in, let’s answer the big question:
❓ Why not just use UML or draw random diagrams?
Problems with Traditional Diagrams:
-
Too many details (e.g., UML class diagrams with every method and interface).
-
No standardization — everyone draws differently.
-
Hard to maintain — diagrams become outdated quickly.
-
Not for all audiences — engineers understand them; executives don’t.
✅ The C4 Solution:
-
Hierarchical → Zoom in/out like Google Maps.
-
Audience-focused → Show only what matters to each group.
-
Simple & consistent → Use standard shapes and labels.
-
Maintainable → Easy to update and version control.
🎯 Goal: Communicate what the system does, how it’s built, and why it’s structured that way — without drowning in technical noise.
📊 The Four Levels of the C4 Model
Let’s explore each level in detail, including purpose, when to use it, how to draw it, and what to avoid.
🟦 Level 1: System Context
“Where does the system sit in the world?”
🎯 Purpose
-
Show the big picture.
-
Identify who uses the system and what other systems it interacts with.
-
Answer: “What problem are we solving, and who is involved?”
🧩 What to Include
-
Your system (boxed with a label like “Banking System”).
-
External actors: Users, customers, other systems (e.g., “Customer”, “Payment Gateway”, “Email Service”).
-
Interactions: Arrows showing data flow (e.g., “Customer → Login → Banking System”).
✏️ How to Draw It
-
Use simple boxes and arrows.
-
No internal details — this is not about your app’s code.
-
Use descriptive names (e.g., “Customer Portal” instead of “Frontend App”).
📌 Example: E-Commerce Platform
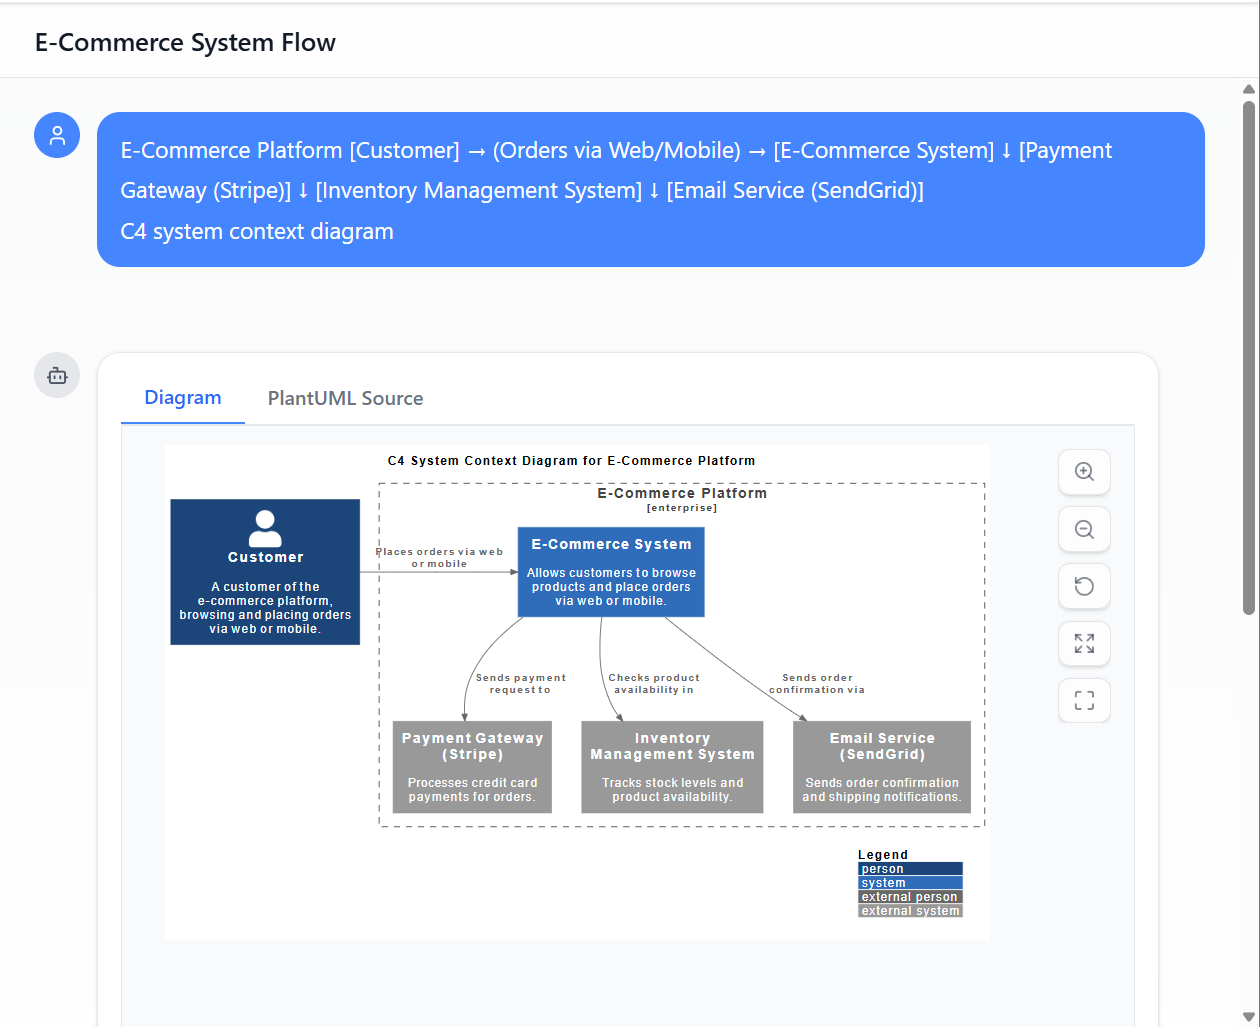
* Generated by Visual Paradigm AI Chatbot
[Customer] → (Orders via Web/Mobile) → [E-Commerce System]
                              ↓
                      [Payment Gateway (Stripe)]
                              ↓
                      [Inventory Management System]
                              ↓
                      [Email Service (SendGrid)]
✅ Best for: Product owners, executives, stakeholders, onboarding new team members.
⚠️ Avoid
-
Including internal components.
-
Using vague labels like “User” — specify “Online Customer” or “Admin User”.
🟨 Level 2: Containers
“What are the high-level technical building blocks?”
🎯 Purpose
-
Break down the system into major logical components.
-
Show how containers communicate and what technologies they use.
-
Answer: “How is the system built, and what tech powers each part?”
🧩 What to Include
-
Containers: Apps, databases, APIs, microservices, file storage, etc.
-
Technologies: (Optional but helpful) e.g., “React Web App”, “Node.js API”, “PostgreSQL DB”.
-
Communication: Arrows showing data flow (e.g., HTTP, REST, gRPC, message queues).
✏️ How to Draw It
-
Use rectangles with rounded corners (or simple boxes).
-
Label each container clearly.
-
Use arrows with labels to show interaction (e.g., “HTTP POST /login”).
-
Color-code if needed (e.g., blue for web apps, green for databases).
📌 Example: Banking System (L2)
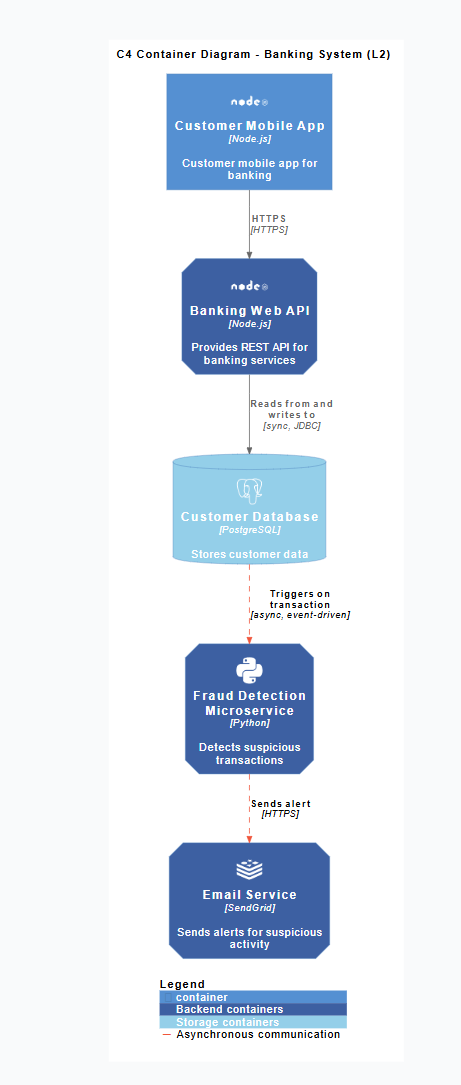
* Generated by Visual Paradigm AI Chatbot
[Customer Mobile App] → (HTTPS) → [Banking Web API (Node.js)]
                              ↓
                      [Customer Database (PostgreSQL)]
                              ↓
                      [Fraud Detection Microservice (Python)]
                              ↓
                      [Email Service (SendGrid)]
✅ Best for: Architects, backend engineers, DevOps teams, technical leads.
⚠️ Avoid
-
Breaking containers too far (e.g., splitting “Web App” into 10 parts).
-
Overloading with tech stack details (save that for L3/L4).
🟥 Level 3: Components
“What’s inside a container?”
🎯 Purpose
-
Dive into one container (e.g., the Web App) and show its internal logical structure.
-
Answer: “How does this app actually work inside?”
🧩 What to Include
-
Components: Logical modules (e.g., “Authentication Service”, “Order Processing”, “Email Sender”).
-
Dependencies: Arrows showing how components interact.
-
Technology hints: (Optional) e.g., “Uses JWT”, “Calls Redis”.
💡 Note: Components are logical, not physical. They don’t have to map to files or classes.
✏️ How to Draw It
-
Use simple boxes (no complex UML).
-
Label clearly: “User Authentication Component”.
-
Use arrows to show dependencies (e.g., “User Service → Database”).
-
Avoid showing classes, methods, or data structures (that’s L4).
📌 Example: Web App Components

[User Authentication Component]
         ↓
[User Profile Service]
         ↓
[Order Processing Component]
         ↓
[Email Notification Component]
         ↓
[Payment Gateway Integration]
✅ Best for: Developers, backend engineers, team leads, code reviews.
⚠️ Avoid
-
Drawing every class or function.
-
Using UML notation unless necessary (e.g., for complex state machines).
-
Making it too detailed — this is not a class diagram.
🟩 Level 4: Code (Optional)
“What does the actual code look like?”
🎯 Purpose
-
Show the actual code structure — typically for complex or critical components.
-
Answer: “How is this component implemented?”
🧩 What to Include
-
Classes, interfaces, functions.
-
Relationships: Inheritance, composition, dependency injection.
-
Packages/modules.
✏️ How to Draw It
-
Use UML Class Diagrams, Package Diagrams, or Sequence Diagrams.
-
Keep it focused — only show one component.
-
Use tools like PlantUML, Draw.io, or Visual Studio Code plugins.
📌 Example: User Service (L4)
@startuml
class UserService {
  + createUser()
  + getUserById()
  + validateUser()
}

class UserRepository {
  + save(user)
  + findById(id)
}

UserService "1" -- "1" UserRepository : uses
@enduml
✅ Best for: Senior developers, code reviewers, onboarding new hires to complex logic.
⚠️ Avoid
-
Drawing every file in the project.
-
Making it too large or complex.
-
Using L4 for every component — only use it when needed.
🔑 Rule of Thumb: Use L4 only for complex, critical, or misunderstood components.
🔄 How to Use C4 in Practice
Step-by-Step Workflow:
-
Start with L1: System Context
-
Define your system and its environment.
-
Identify key users and external systems.
-
-
Move to L2: Containers
-
Break the system into high-level components.
-
Use technology labels to clarify.
-
-
Pick a container and drill into L3: Components
-
Focus on one key area (e.g., authentication, payments).
-
Show logical structure — not code.
-
-
Go to L4 only if necessary
-
Use for complex logic or when explaining design decisions.
-
-
Document and version control
-
Store diagrams in Markdown, PlantUML, or Draw.io.
-
Use version control (Git) to track changes.
-
-
Review with stakeholders
-
Show L1 to execs, L3 to devs, L2 to architects.
-
🛠️ Tools to Create C4 Diagrams
| Tool | Best For | Notes |
|---|---|---|
| PlantUML | Code-based diagrams (great for automation) | Use @startuml with C4 syntax |
| Draw.io (diagrams.net) | Manual, visual editing | Free, supports C4 shapes |
| Lucidchart | Team collaboration | Good for non-technical users |
| Excalidraw | Hand-drawn style, fun & fast | Great for whiteboarding |
| C4-Model Plugin (VS Code) | Developer workflow | Auto-generates diagrams from code |
💡 Pro Tip: Use PlantUML with Markdown (e.g., in GitHub READMEs) to keep diagrams version-controlled and searchable.
🎨 C4 Diagram Conventions (Best Practices)
| Rule | Why It Matters |
|---|---|
| ✅ Use boxes for systems, containers, components | Simple, readable, scalable |
| ✅ Use arrows for communication | Shows data flow, not just connections |
| ✅ Label everything clearly | No ambiguity |
| ✅ Use consistent colors (optional) | E.g., blue = web, green = DB, red = external |
| ✅ Keep diagrams small and focused | Avoid clutter |
| ✅ Use descriptive names | “Customer Service” > “Service1” |
| ✅ Avoid UML unless at L4 | Keep L1–L3 simple |
📌 Golden Rule: A C4 diagram should be understood in under 30 seconds by someone unfamiliar with the system.
🔄 C4 vs. UML: A Clear Comparison
| Feature | C4 Model | UML |
|---|---|---|
| Purpose | Communication & clarity | Comprehensive modeling |
| Level of Detail | Hierarchical (zoom in/out) | Can be extremely detailed |
| Audience | All stakeholders | Primarily developers & architects |
| Complexity | Simple, lightweight | High (can be overwhelming) |
| Maintenance | Easy | Often neglected |
| Use Case | Architecture documentation | Design, documentation, analysis |
✅ Use C4 for architecture communication
✅ Use UML for deep design (e.g., state machines, sequence flows) — but only within C4 diagrams at L4
🌟 Real-World Use Cases
🏦 Banking App
-
L1: Customer → Banking System → Payment Gateway
-
L2: Web App, Mobile App, DB, Fraud Detection Microservice
-
L3: Auth Component, Transaction Processor, Alert Service
-
L4:
TransactionService.javawithvalidate()andprocess()methods
🛒 E-Commerce Platform
-
L1: Customer → E-Commerce System → Payment Gateway → Inventory System
-
L2: Frontend, API Gateway, Order Service, Inventory DB
-
L3: Cart Service, Checkout Component, Email Service
-
L4:
CheckoutServicewithapplyPromo()andsendReceipt()
🧠 AI Chatbot Platform
-
L1: User → Chatbot → NLP Engine → Database
-
L2: Web Frontend, Bot API, NLP Microservice, Redis Cache
-
L3: Message Handler, Intent Classifier, Response Generator
-
L4:
IntentClassifierclass withpredict()method
📚 Further Learning Resources
- C4 Model – A Beginner’s Guide to Software Architecture Diagrams: A comprehensive introduction to the C4 model, explaining its four levels—Context, Containers, Components, and Code—and how it simplifies the visualization of software architecture for better communication among teams.
- What Is the C4 Model?: An overview of the C4 model, detailing its purpose in structuring software architecture diagrams to improve clarity, collaboration, and documentation across development and stakeholder teams.
- The Ultimate Guide to C4 Model Visualization with Visual Paradigm’s AI Tools: A detailed guide on leveraging AI-powered tools within Visual Paradigm to create and refine C4 model diagrams, enabling faster, more accurate architectural documentation.
- The C4 Model: A Comprehensive Guide to Visualizing Software Architecture with AI-Powered Tools: A thorough exploration of the C4 model’s application in modern software design, with a focus on how AI-enhanced tools streamline the creation and maintenance of architecture diagrams.
- A Quick Guide to Choosing Machine Vision for Collaborative Applications: A practical guide on selecting machine vision systems for collaborative robotics and industrial automation, emphasizing performance, integration, and advanced 3D vision capabilities.
- TOGAF and ArchiMate: An Integrated Approach: A deep dive into combining TOGAF and ArchiMate frameworks within Visual Paradigm, highlighting how compliance checking and modeling consistency ensure enterprise architecture alignment with standards and requirements.
- C4 Model Tool – Visual Paradigm Online: An overview of the C4 model tool available in Visual Paradigm Online, showcasing features such as diagram creation, template support, and collaboration tools for distributed teams.
- Full C4 Model Support in Visual Paradigm: A release note detailing the comprehensive support for the C4 model in Visual Paradigm, including enhanced diagramming capabilities, templates, and integration with other architecture modeling features.
- C4 Diagram Tool – Visual Paradigm: A feature page outlining the capabilities of Visual Paradigm’s C4 diagram tool, including support for all four levels of the C4 model, real-time collaboration, and export options for documentation.
- Unveiling the Power of the C4 Model: Simplifying Software Architecture Diagrams: A discussion on how the C4 model reduces complexity in software architecture communication, making it easier for developers, architects, and non-technical stakeholders to understand system design.
- AI Diagram Generator: Complete C4 Model Support: A release update announcing the integration of an AI-powered diagram generator that automates the creation of C4 model diagrams from natural language input, significantly speeding up architectural documentation.
- AI-Powered C4 PlantUML & Markdown Editor: A feature highlight on the AI-enhanced editor that supports C4 diagrams via PlantUML and Markdown, enabling developers to generate diagrams from code-like syntax with intelligent suggestions and auto-completion.
- C4 PlantUML Studio – Visual Paradigm: A feature description of the C4 PlantUML Studio, which allows users to write C4 diagrams using PlantUML syntax while benefiting from real-time visualization, syntax validation, and AI-driven assistance.
- Leveraging Visual Paradigm’s AI C4 Studio: A Comprehensive Guide to Streamlined Architectural Documentation: A guide explaining how Visual Paradigm’s AI C4 Studio accelerates the creation of architecture diagrams, improves consistency, and integrates seamlessly into development workflows.
- Visual Paradigm’s AI Chatbot – Features and Use Cases: An overview of the AI chatbot feature in Visual Paradigm, designed to assist users in generating diagrams, writing descriptions, and navigating architecture modeling tasks through natural language interaction.
- C4 Model in Practice – Video Tutorial: A step-by-step video tutorial demonstrating how to create and manage C4 model diagrams using Visual Paradigm, including best practices for organizing architecture views and sharing them with stakeholders.
✅ Final Checklist: Are You Using C4 Right?
-
Diagrams are hierarchical (L1 → L4).
-
Each level shows only what’s needed for the audience.
-
No UML at L1–L3 (unless for clarity).
-
Diagrams are easy to understand in <30 seconds.
-
You use consistent naming and shapes.
-
Diagrams are version-controlled (e.g., in Git).
-
You review them with stakeholders.
🎯 Summary: The Power of C4
| Level | Focus | Audience |
|---|---|---|
| L1: System Context | Big picture | Executives, product managers |
| L2: Containers | Tech building blocks | Architects, DevOps |
| L3: Components | Internal logic | Developers |
| L4: Code | Actual implementation | Senior devs, reviewers |
✅ C4 is not just a diagramming tool — it’s a communication strategy.
It turns abstract systems into shared understanding, reduces miscommunication, and helps teams build better software — faster.
📣 Ready to Visualize Your Project?
👉 Tell me your project, and I’ll generate:
-
A System Context (L1) diagram
-
A Containers (L2) diagram
-
A Components (L3) diagram (for one key container)
-
Optional: Code (L4) snippet
Just say:
“Help me create a C4 model for my [Project Name]!”
Let’s build clarity — one diagram at a time. 🎨✨