Now Reading: The C4 Model: Visualizing Software Architecture Like “Google Maps for Code”
-
01
The C4 Model: Visualizing Software Architecture Like “Google Maps for Code”


The C4 Model: Visualizing Software Architecture Like “Google Maps for Code”
“The C4 Model helps teams communicate software architecture clearly, consistently, and at the right level of detail.”
— Simon Brown
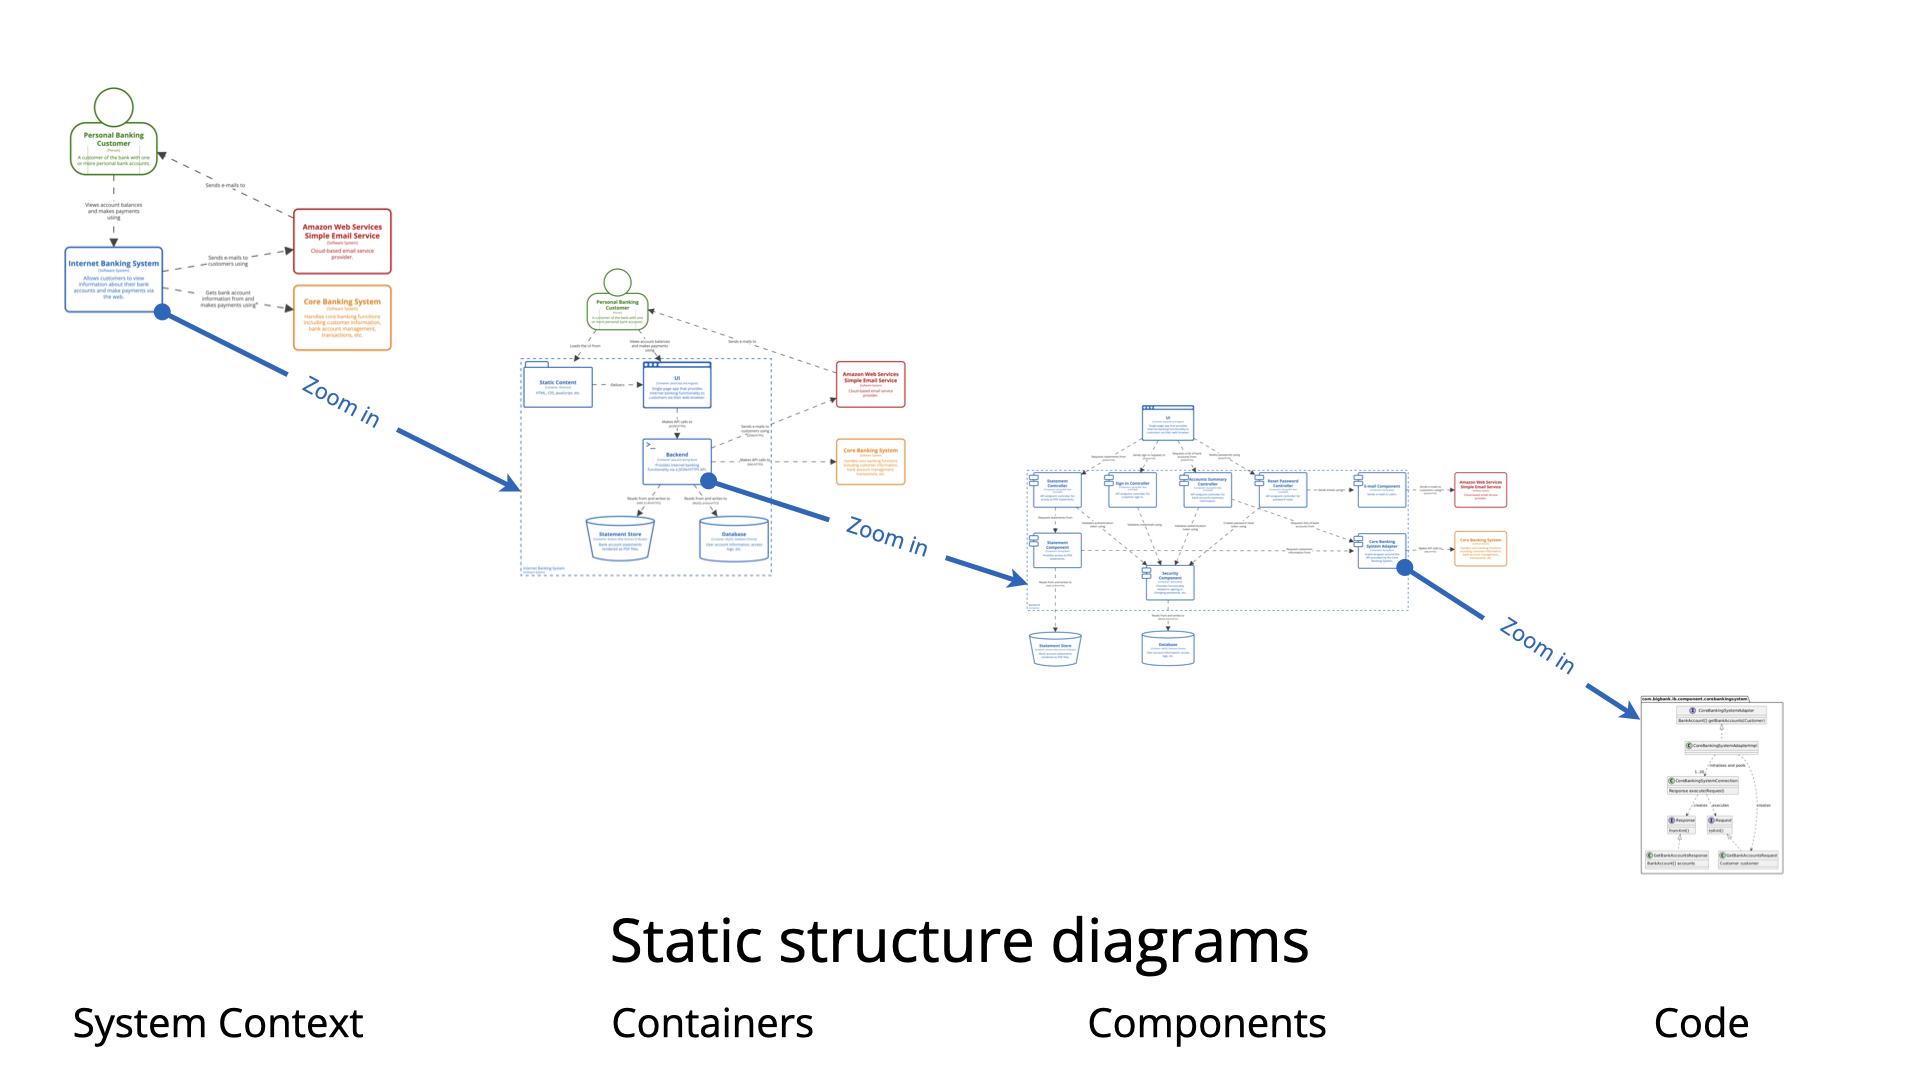
The C4 Model (Context, Containers, Components, Code) is a hierarchical, zoomable framework for documenting software architecture. It’s designed to be developer-friendly, Agile-compliant, and readable — moving beyond cluttered, static “boxes and lines” diagrams.
It enables teams to:
-
Communicate architecture effectively across technical and non-technical stakeholders.
-
Maintain consistent, version-controlled documentation.
-
Focus on what matters at each level of abstraction.
🔍 Core Abstractions of the C4 Model
| Level | Concept | Purpose |
|---|---|---|
| Level 1: Context | System & People | Who uses the system? How does it interact with its environment? |
| Level 2: Containers | Deployable units | What are the high-level technical components (apps, databases, APIs)? |
| Level 3: Components | Logical groupings | How is functionality structured inside a container? |
| Level 4: Code (Optional) | Classes, interfaces, methods | Implementation details — typically generated by IDEs. |
✅ Key Principle: Zoom in only when needed. Start broad, then drill down.
🧩 Key Elements & Relationships
| Element | Description | Example |
|---|---|---|
| Person | Human actor or user | Customer, Admin, Third-party API |
| Software System | A system delivering value | Internet Banking System |
| Container | Deployable unit (runtime or deployable) | Web App, Microservice, Database, Serverless Function |
| Component | Logical group of related functionality | Auth Module, Payment Processor, Mainframe Facade |
| Relationships | Plain-language connections between elements | "Uses", "Calls", "Reads/Writes", "Depends on" |
💬 Use natural language for relationships. Avoid vague terms like “connects to”.
📊 C4 Model Levels with PlantUML Examples
📌 All examples use the C4-PlantUML library for consistency and automation.
1. System Context Diagram (Level 1)
Who uses the system? What external systems does it interact with?
🎯 Audience: Non-technical stakeholders, product owners, executives.
@startuml
!include https://static.visual-paradigm.com/plantuml-stdlib/C4-PlantUML/master/C4_Context.puml
LAYOUT_WITH_LEGEND()
title System Context Diagram for Internet Banking

Person(customer, "Customer", "A personal banking customer")
System(banking_system, "Internet Banking System", "Allows customers to view accounts and make payments")
System_Ext(mainframe, "Mainframe Banking System", "Stores all core banking data")

Rel(customer, banking_system, "Uses")
Rel_R(banking_system, mainframe, "Gets account info from")
@enduml
✅ Focus: Scope and boundaries of the system.
2. Container Diagram (Level 2)
What are the major technical components and their technologies?
🎯 Audience: Architects, developers, DevOps engineers.
@startuml
!include https://raw.githubusercontent.com/plantuml-stdlib/C4-PlantUML/master/C4_Container.puml

Person(customer, "Customer", "A personal banking customer")
System_Boundary(c1, "Internet Banking System") {
    Container(web_app, "Web Application", "Java, Spring MVC", "Delivers content to user")
    Container(api_app, "API Application", "Java, Spring Boot", "Provides functionality via JSON/HTTPS")
    ContainerDb(db, "Database", "Relational Database", "Stores user data")
}

System_Ext(mainframe, "Mainframe Banking System", "Stores all core banking data")

Rel(customer, web_app, "Uses", "HTTPS")
Rel(web_app, api_app, "Calls", "JSON/HTTPS")
Rel(api_app, db, "Reads/Writes", "JDBC")
Rel(api_app, mainframe, "Uses", "XML/HTTPS")
@enduml
✅ Focus: Technology choices, deployment boundaries, data flows.
3. Component Diagram (Level 3)
How is the API Application structured internally?
🎯 Audience: Developers, technical leads, team leads.
@startuml
!include https://static.visual-paradigm.com/plantuml-stdlib/C4-PlantUML/master/C4_Component.puml
LAYOUT_WITH_LEGEND()
title Component Diagram for API Application in Internet Banking

Container(api_app, "API Application", "Java, Spring Boot")
ContainerDb(db, "Database", "Relational Database")
System_Ext(mainframe, "Mainframe Banking System")

Container_Boundary(api_boundary, "API Application") {
    Component(sign_in, "Sign In Controller", "MVC Controller", "Allows users to sign in")
    Component(security, "Security Component", "Spring Security", "Handles authentication")
    Component(mainframe_facade, "Mainframe Facade", "DAO", "Communicates with Mainframe")

    Rel(sign_in, security, "Uses")
    Rel(security, db, "Reads/Writes")
    Rel(sign_in, mainframe_facade, "Uses")
    Rel(mainframe_facade, mainframe, "Uses")
}
@enduml
✅ Focus: Internal structure, responsibilities, dependencies.
4. Code Diagram (Level 4 – Optional)
Implementation details: classes, interfaces, methods.
🎯 Audience: Developers, code reviewers.
⚠️ Not recommended to draw manually — best generated via IDEs (e.g., IntelliJ, VS Code) using auto-diagramming tools.
Example (simplified):
@startuml
class SignInController {
  +signIn()
  +validateCredentials()
}

class SecurityComponent {
  +authenticate()
  +generateToken()
}

class MainframeFacade {
  +fetchAccountData()
  +sendTransaction()
}

SignInController --> SecurityComponent : Uses
SecurityComponent --> Database : Reads/Writes
MainframeFacade --> MainframeAPI : Uses
@enduml
✅ Best practice: Automate this level using tools like PlantUML + IDE plugins.
✅ Best Practices & Key Principles
| Principle | Why It Matters |
|---|---|
| Iterative Refinement | Start with context → add detail only when needed. Avoid over-documenting. |
| Diagrams as Code | Store .puml files in Git. Enables versioning, CI/CD, collaboration, and diffs. |
| Include a Legend | Always explain symbols, colors, and conventions (e.g., Red = External, Blue = Internal). |
| Focus on Communication | Diagrams should inform, not impress. Simplicity > completeness. |
| Use “System Landscape” Diagrams | Show how multiple systems interact across an organization. |
| Use “Dynamic” Diagrams | Add sequence diagrams to show runtime behavior (e.g., login flow). |
| Scope Responsibly | A Component diagram must be scoped within a single container. Don’t mix containers! |
🛠 Tools & Ecosystem
-
PlantUML + C4-PlantUML Library – Free, text-based, version-controlled.
-
Visual Paradigm, Lucidchart, Draw.io – Support C4 via templates.
-
IDE Plugins – Auto-generate C4 diagrams from code (e.g., IntelliJ + PlantUML plugin).
-
CI/CD Integration – Generate diagrams as part of build pipelines.
📚 References & Further Reading
- C4 Model Official Site – Simon Brown’s definitive guide
- C4 Model Support in Visual Paradigm: A beginner-friendly guide that introduces the C4 model and demonstrates how Visual Paradigm supports its visualization with intuitive tools and AI-powered features.
- What is the C4 Model?: A comprehensive overview of the C4 model, explaining its four-level hierarchy—Context, Containers, Components, and Code—and how it enables clear, scalable software architecture communication.
- The Ultimate Guide to C4 Model Visualization with Visual Paradigm’s AI Tools: A detailed exploration of how Visual Paradigm’s AI capabilities streamline the creation and refinement of C4 models, reducing manual effort and improving accuracy.
- The C4 Model: A Comprehensive Guide to Visualizing Software Architecture with AI-Powered Tools: A thorough reference on applying the C4 model in real-world software architecture, with a focus on AI-driven modeling and automation.
- Native C4 Diagram Suite & Standards Compliance: Highlights Visual Paradigm’s commitment to standards compliance, including C4 diagram rules and parent-child relationships across abstraction levels.
- C4 Model Tool Features – Real-Time Collaboration and Export: Describes the full feature set of the C4 model tool, including real-time collaboration, version control, and the ability to export models as interactive HTML or professional reports.
- Visual Paradigm Full C4 Model Support Release: Official release announcement detailing the full integration of C4 model types—including System Landscape, System Context, Container, Component, Dynamic, and Deployment—into Visual Paradigm’s modeling suite.
- C4 Diagram Tool – Key Features and Benefits: An in-depth look at the core capabilities of the C4 diagram tool, emphasizing precision, hierarchy, and visual clarity in software architecture representation.
- Unveiling the Power of C4 Model – Simplifying Software Architecture Diagrams: Explores the benefits of using the C4 model to simplify complex software architecture, making it accessible to both technical and non-technical stakeholders.
- AI Diagram Generator for Complete C4 Model: Details the AI-powered C4 diagram generator that converts natural language descriptions into fully structured, compliant C4 diagrams at the correct level of abstraction.
- Visual Paradigm AI Chatbot – Conversational Diagram Refinement: Introduces the AI chatbot functionality that enables users to modify diagrams using natural language commands, such as adding or renaming elements.
- AI-Powered C4 PlantUML Editor – Natural Language to Code: Describes the AI-powered PlantUML studio that translates plain-English descriptions into valid PlantUML code, with real-time rendering and editing support.
- Leveraging Visual Paradigm’s AI C4 Studio for Streamlined Documentation: A case study on how teams use AI-powered C4 tools to generate accurate, maintainable, and scalable architectural documentation.
- AI-Powered C4 PlantUML Studio – Side-by-Side Editor: Shows how the C4 PlantUML Studio enables users to write and refine diagrams in plain English, with immediate visual feedback and code generation.
- Visual Paradigm AI C4 Studio Demo Video: A hands-on demonstration of the AI-powered C4 model workflow, showing how a natural language description can be transformed into a complete, structured C4 diagram in seconds.
🎯 Final Thought
The C4 Model isn’t about creating perfect diagrams — it’s about telling the right story at the right level of detail.
Use it to:
-
Onboard new developers faster.
-
Align teams on system boundaries.
-
Communicate with stakeholders without jargon.
-
Evolve architecture documentation alongside the code.
✅ Pro Tip: Start with a System Context diagram. Then, grow the model as your team’s needs evolve — like building a map one street at a time.
Let me know if you’d like:
-
A downloadable PDF version of this guide
-
A template repository with C4 diagrams in Git
-
Automation scripts for generating C4 diagrams from code
-
A comparison with other models (e.g., 4+1 View, Zachman)
Happy diagramming! 🖥️📘