💡 Key Takeaways
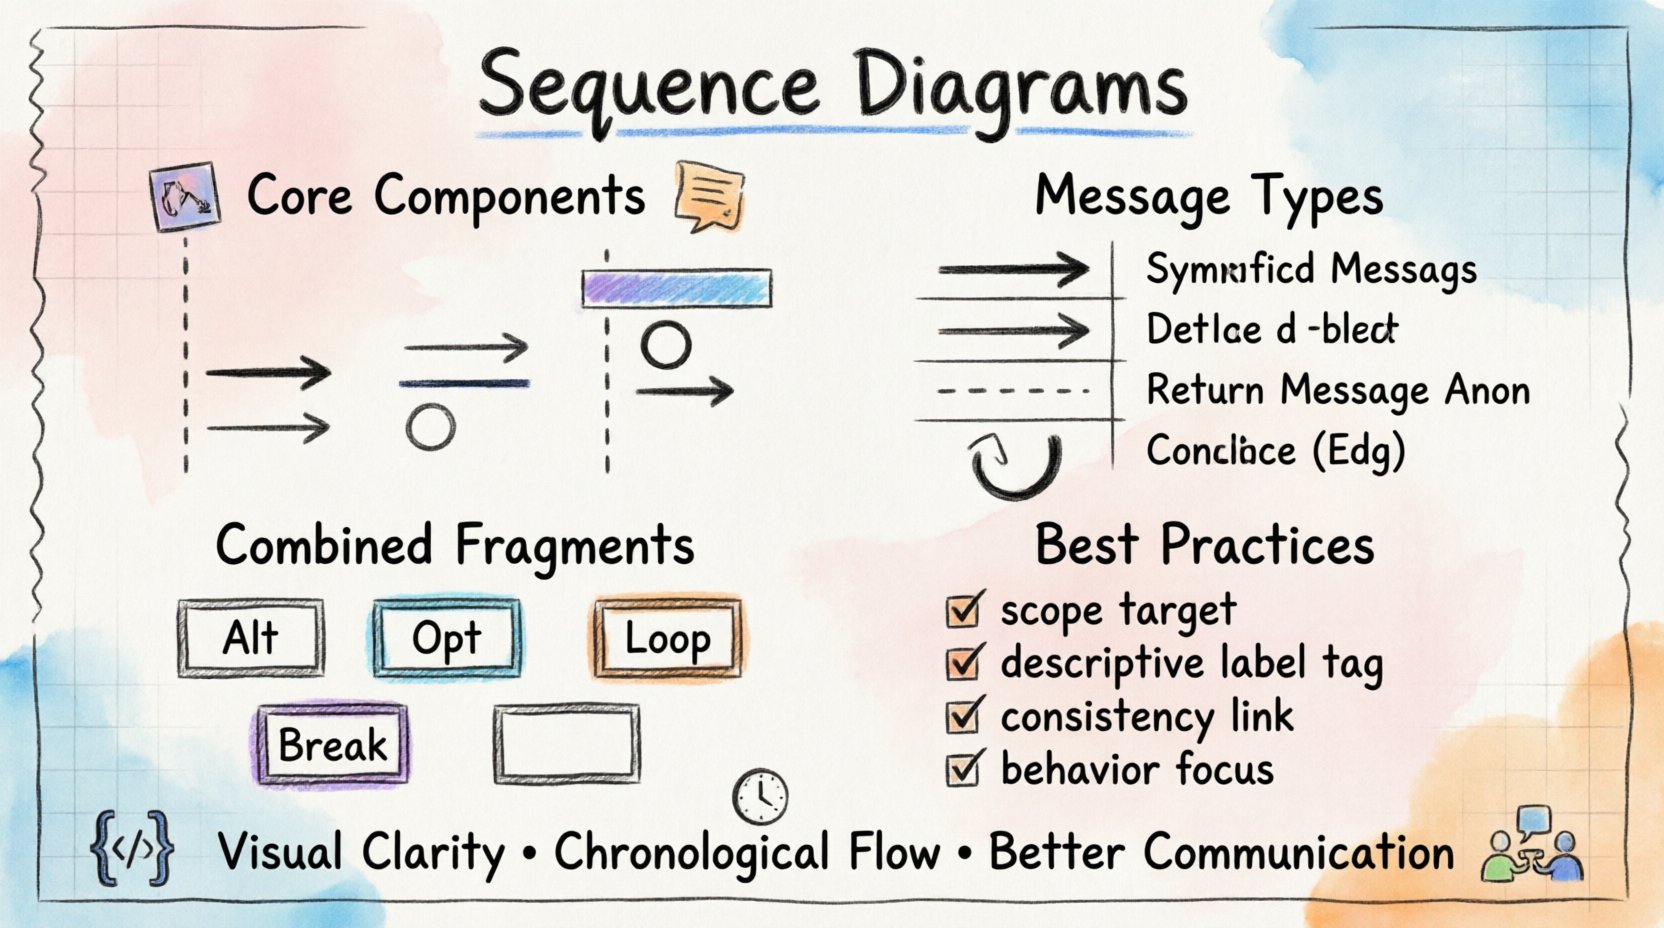
Visual Clarity: Sequence diagrams map the flow of data between objects over time, clarifying complex logic.
Lifelines Matter: Each vertical line represents an object’s existence and participation in the interaction.
Message Types: Distinguish between synchronous calls, asynchronous events, and return signals to model timing accurately.
Combined Fragments: Use Alt, Opt, and Loop frames to handle conditional logic and iterations within the interaction.
In the realm of software architecture, clarity is currency. When systems grow in complexity, the relationships between components can become opaque. Sequence diagrams serve as a critical tool for making these interactions visible. They provide a dynamic view of a system, focusing on the chronological order of message exchanges between objects. This visual language allows teams to reason about behavior before a single line of code is written.
Understanding the Core Components 🧩
A sequence diagram is built upon specific notations that convey meaning. Each element plays a role in defining how a system behaves during a specific scenario. To interpret these diagrams effectively, one must understand the fundamental building blocks.
1. Lifelines 📉
Lifelines represent the participants in the interaction. These can be objects, actors, or subsystems. Visually, they are depicted as vertical dashed lines extending from the top of the diagram to the bottom. The top of the lifeline marks the creation of the participant, and the bottom indicates when the participant is no longer needed.
Actor: A human or external system initiating the interaction.
Object: An instance of a class within the application.
Subsystem: A logical grouping of objects functioning as a unit.
2. Messages 💬
Messages represent the communication between participants. They are drawn as horizontal arrows pointing from the source lifeline to the destination lifeline. The direction indicates the flow of control or data.
Message Type | Visual Representation | Behavior |
|---|---|---|
Synchronous Call | Filled Arrowhead | Caller waits for the receiver to complete the task. |
Asynchronous Message | Open Arrowhead | Caller sends the message and continues immediately. |
Return Message | Dashed Line | Response sent back from receiver to caller. |
Self-Call | Curved Arrow | Object calls a method on itself. |
3. Activation Bars 📊
Activation bars (or execution occurrences) are thin rectangles placed on top of a lifeline. They indicate the period during which an object is performing an action. This is crucial for understanding concurrency. If an activation bar extends vertically, it means the object is busy. If multiple bars overlap, it suggests potential parallel processing or nested calls.
Structuring Interactions with Time ⏱️
The vertical axis of a sequence diagram represents time. Events at the top occur before events lower down. This temporal ordering is essential for debugging and understanding state changes.
Ordering of Events
When reading a diagram, trace the path from the top left. The first message originates from the initiator. As the message flows down, it triggers actions on other lifelines. The diagram captures the exact sequence of these events. If event A must happen before event B, A will appear higher on the page than B.
Advanced Constructs: Combined Fragments 🧱
Real-world interactions rarely follow a single linear path. Systems handle conditions, loops, and alternative flows. UML defines combined fragments to model these complexities within a single frame.
Alternative and Optional Paths
Alt (Alternative): Used to show branching logic. Similar to an
if-elsestatement. Only one operand is executed based on a condition.Opt (Optional): Represents an optional interaction. The message may or may not occur based on a condition.
Loops and Breaks
Loop: Indicates repeated interaction. Useful for modeling iterations over a collection of data.
Break: Represents a scenario where the normal flow is interrupted. For example, an error condition that aborts the operation.
Each fragment is labeled with the frame name and a condition in the top-left corner of the box. This notation allows developers to encapsulate complex logic without cluttering the main flow.
Best Practices for Effective Modeling 🛠️
Creating a sequence diagram is not merely about drawing lines and arrows. It requires a disciplined approach to ensure the diagram remains a useful asset throughout the development lifecycle.
1. Define the Scope Clearly
Every diagram should have a specific goal. Are you modeling a user login? A payment processing flow? A data retrieval operation? Keeping the scope narrow prevents the diagram from becoming unreadable. If a scenario is too complex, consider breaking it into multiple diagrams.
2. Use Descriptive Naming
Labels on messages and objects should be meaningful. Avoid generic names like func1 or objA. Use domain-specific language. For instance, instead of sendData, use submitOrder. This makes the diagram accessible to stakeholders who are not technical.
3. Maintain Consistency
Ensure that the terminology used in the diagram matches the codebase. If a class is named Customer in the code, it should be Customer in the diagram. Consistency reduces cognitive load when mapping the design to implementation.
4. Focus on Behavior, Not State
While state is important, sequence diagrams focus on interactions. Avoid cluttering the diagram with internal state changes unless they trigger a message. If you need to show state transitions, consider using a State Machine Diagram instead.
Common Pitfalls to Avoid 🚫
Even experienced practitioners can fall into traps when creating these diagrams. Awareness of common mistakes helps maintain quality.
Overloading Messages: Do not pack too much logic into a single message. If a message triggers a sub-process, consider expanding it into a nested sequence diagram.
Ignoring Timing: While sequence diagrams are not timing diagrams, they do imply order. Ensure the order of messages reflects the actual execution logic.
Too Many Participants: If a diagram has more than five or six lifelines, it may be too complex. Refactor the design to group related objects.
Neglecting Return Messages: In synchronous calls, omitting the return message can make the flow appear incomplete. Always indicate when data is returned to the caller.
The Value of Visualization 🎨
Sequence diagrams bridge the gap between abstract requirements and concrete implementation. They facilitate communication between architects, developers, and testers. By visualizing the flow, teams can identify potential bottlenecks, race conditions, or missing error handling early in the process.
When a system is well-modeled, the transition to code is smoother. The diagram acts as a contract of behavior. If the code deviates from the diagram, it signals a need for refactoring. This alignment ensures that the system behaves as intended, reducing technical debt over time.
Conclusion
Sequence diagrams are more than just diagrams; they are a method of thinking. They force the designer to consider the order of operations and the dependencies between components. By adhering to the standards of notation and focusing on clear communication, teams can build systems that are robust, maintainable, and understandable.
Investing time in creating accurate sequence diagrams pays dividends in reduced debugging time and clearer architectural decisions. As systems evolve, these diagrams remain a vital reference point, guiding the development journey from concept to reality.