In modern software development, information is often trapped within individual teams or specific groups of engineers. These knowledge silos create friction, slow down decision-making, and increase the risk of errors when changes are made to complex systems. When documentation exists only in the mind of a single architect or is scattered across disparate wikis, the organization suffers from a fragmented understanding of its own infrastructure.
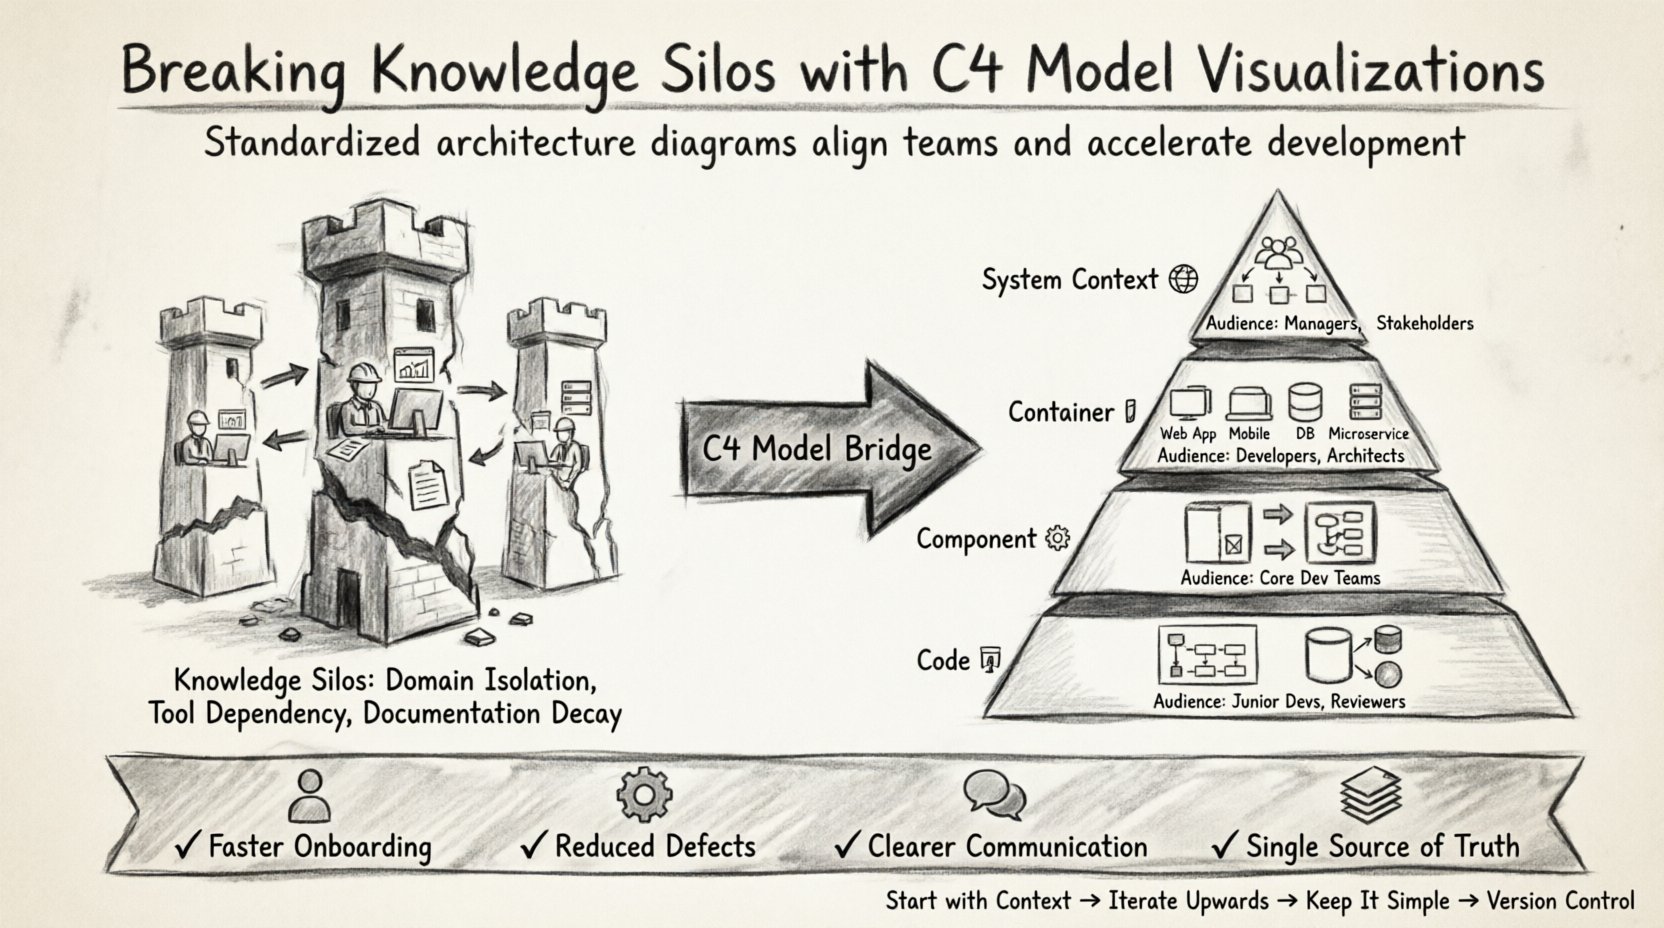
This guide explores how standardized architecture visualizations, specifically using the C4 Model, can bridge these gaps. By adopting a shared language for system design, teams can align their mental models, streamline onboarding, and maintain a single source of truth without relying on specific proprietary tools.
🧩 Understanding Knowledge Silos in Engineering
Knowledge silos occur when information is compartmentalized and not accessible to other parts of the organization. In technical contexts, this often manifests as:
- Domain Isolation: Backend developers do not understand the data flows required by the frontend team.
- Tool Dependency: Only one person knows how to configure the deployment pipeline.
- Documentation Decay: Diagrams exist but have not been updated since a major refactoring occurred months ago.
- Communication Gaps: Requirements are interpreted differently by different squads.
The cost of these silos is tangible. It manifests as:
- Increased onboarding time for new engineers.
- Higher defect rates due to misunderstood dependencies.
- Slower incident response times because the system owner is unknown.
- Redundant work where multiple teams build similar services.
To combat this, organizations need a visualization framework that is simple enough to be understood by everyone but detailed enough to be technically accurate.
📐 The C4 Model: A Standard for Visualization
The C4 model provides a structured approach to documenting software architecture. It focuses on four distinct levels of abstraction, allowing different audiences to see what they need without being overwhelmed by irrelevant details.
1. System Context 🌍
This is the highest level of abstraction. It shows the software system as a single block and its interactions with users and other systems.
- Audience: Managers, stakeholders, new hires.
- Focus: Business value and external dependencies.
- Details: People, software systems, and relationships.
2. Container 📦
Containers represent distinct deployable units of software, such as a web application, a mobile app, a database, or a microservice.
- Audience: Developers, architects.
- Focus: Technology stack and high-level data flow.
- Details: Application types, protocols, and data stores.
3. Component ⚙️
Components are major building blocks within a container. They group related functionality together.
- Audience: Core development teams.
- Focus: Internal logic and responsibilities.
- Details: Classes, functions, and data models.
4. Code 💻
This level dives into the implementation details, such as class diagrams or database schema.
- Audience: Junior developers, code reviewers.
- Focus: Specific implementation logic.
- Details: Classes, interfaces, and relationships.
Using this hierarchy ensures that a manager sees the big picture while a developer sees the specific code structure, all within the same documentation ecosystem.
📊 Comparing Visualization Approaches
Not all diagrams serve the same purpose. The following table outlines the differences between ad-hoc sketching and structured modeling.
| Approach | Clarity | Maintainability | Adoption Rate |
|---|---|---|---|
| Ad-hoc Sketching | Low | Low (Hard to update) | High (Tactical) |
| Structured C4 Model | High | High (Standardized) | Moderate (Requires training) |
| Code-Generated Diagrams | Medium | Very High | Low (Technical) |
🛠️ Implementing Shared Visualizations
Implementing a shared visualization strategy requires a shift in process and culture. It is not just about drawing pictures; it is about agreeing on how to describe the system.
Establishing Standards 📝
Before creating any diagrams, teams must agree on notation rules. This includes:
- Naming Conventions: How containers and components are named to reflect their function.
- Color Coding: Using consistent colors for similar technologies (e.g., databases, user interfaces).
- Linking: Defining how diagrams reference each other to maintain context.
Standardization reduces cognitive load. When a team member sees a specific shape or color, they immediately understand its meaning without needing to ask.
Creating the Diagrams 🖌️
When creating visualizations, follow these principles:
- Start with Context: Define the boundaries of the system first.
- Iterate Upwards: Do not start with code details. Start with the business problem.
- Keep it Simple: If a diagram is too complex, split it into multiple views.
- Focus on Data Flow: Arrows should clearly indicate direction and protocol.
Digital Repositories 📂
Store diagrams alongside code repositories. This ensures that diagrams are versioned and reviewed in the same pull request process as the code changes.
- Version Control: Changes to architecture should be tracked.
- Accessibility: Ensure all teams have read access to the diagrams.
- Searchability: Use metadata to make diagrams easy to find.
🔄 Maintenance and Governance
The biggest challenge with architecture documentation is keeping it current. If diagrams drift from reality, they become noise rather than signal.
Integration with CI/CD 🔗
Automate the generation of diagrams where possible. Tools can extract metadata from code to update the C4 structure automatically. This reduces the manual effort required to keep documentation fresh.
- Automated Checks: Verify that new services are documented before deployment.
- Alerts: Notify architects if a service changes significantly.
Review Cycles 🕒
Establish regular review sessions. Architecture is not static; it evolves as business needs change.
- Quarterly Reviews: High-level context diagrams should be reviewed quarterly.
- Feature Updates: Component diagrams should be updated when a feature scope changes.
- Incident Reviews: Post-mortems often reveal gaps in understanding that should be documented.
🤝 Communication Strategies
Visualizations are useless if they are not communicated effectively. Here is how to leverage diagrams in team interactions.
Onboarding New Engineers 👋
Use the System Context diagram as the first resource for new hires. It provides immediate clarity on where their work fits.
- Day One: Provide access to the context diagram.
- Week One: Assign a container diagram relevant to their module.
- Month One: Review the component diagrams for their specific service.
Stakeholder Presentations 📢
When presenting to non-technical stakeholders, stick to the System Context level. Avoid showing technical implementation details like database schemas or API endpoints.
- Focus on Flow: Show how data moves from the user to the service.
- Highlight Dependencies: Show external systems that affect performance.
- Minimize Jargon: Use plain language alongside the diagrams.
Incident Response 🚨
During outages, teams often panic and lose track of system boundaries. Having up-to-date diagrams helps identify the source of failure quickly.
- Reference Diagrams: Open the relevant container diagram on the main screen.
- Trace Data: Follow the arrows to see where the request failed.
- Update Post-Incident: If a diagram was missing critical info, update it immediately.
🚧 Common Pitfalls to Avoid
Even with a solid framework, teams often stumble. Be aware of these common traps.
Over-Engineering Documentation 🏗️
Do not create diagrams for every single function. Focus on the architecture. If a diagram has more than 20 boxes, it is likely too detailed for its intended audience.
- Group Similar Elements: Combine small services into logical containers.
- Hide Internal Logic: Do not show every class in a component diagram.
Ignoring the Human Element 🧑💻
Diagrams are technical artifacts, but they serve human needs. Ensure the diagrams are readable and not just machine-generated outputs that look like spaghetti.
- Readability: Use clear fonts and sufficient spacing.
- Annotations: Add notes to explain complex interactions.
Tool Selection Bias 🛠️
Do not let the capabilities of a specific tool dictate the architecture. The C4 model should be the standard, regardless of the software used to draw it.
- Focus on Content: Ensure the diagram conveys the right information.
- Exportability: Ensure diagrams can be exported to common formats like PNG or SVG.
📈 Measuring Success
How do you know if reducing silos is working? Track these metrics over time.
- Onboarding Duration: Measure the time it takes for new hires to become productive.
- Defect Rates: Track the number of bugs caused by integration errors.
- Documentation Freshness: Measure the age of the last update on key diagrams.
- Query Volume: Track how often teams reference documentation versus asking colleagues.
A decrease in internal questions and an increase in independent problem-solving indicate that the knowledge is successfully being shared.
🌱 Moving Forward
Reducing knowledge silos is an ongoing process, not a one-time project. It requires commitment from leadership and participation from every team member.
By adopting the C4 Model, organizations create a shared language that transcends team boundaries. This shared language reduces ambiguity, accelerates development, and ensures that the architecture remains a living document rather than a static artifact.
Start small. Pick one service, document its context and containers, and share it. Then expand from there. The goal is clarity, not perfection.
📚 Key Takeaways
- Knowledge Silos Hurt Velocity: Isolated information leads to rework and delays.
- Standardize with C4: Use the four levels (Context, Container, Component, Code) to tailor information.
- Version Control Diagrams: Treat architecture documentation like code.
- Maintain Regularly: Schedule reviews to keep diagrams accurate.
- Focus on Communication: Use diagrams to facilitate discussions, not replace them.
Implementing these practices builds a resilient engineering culture where information flows freely, and the system architecture is understood by all.