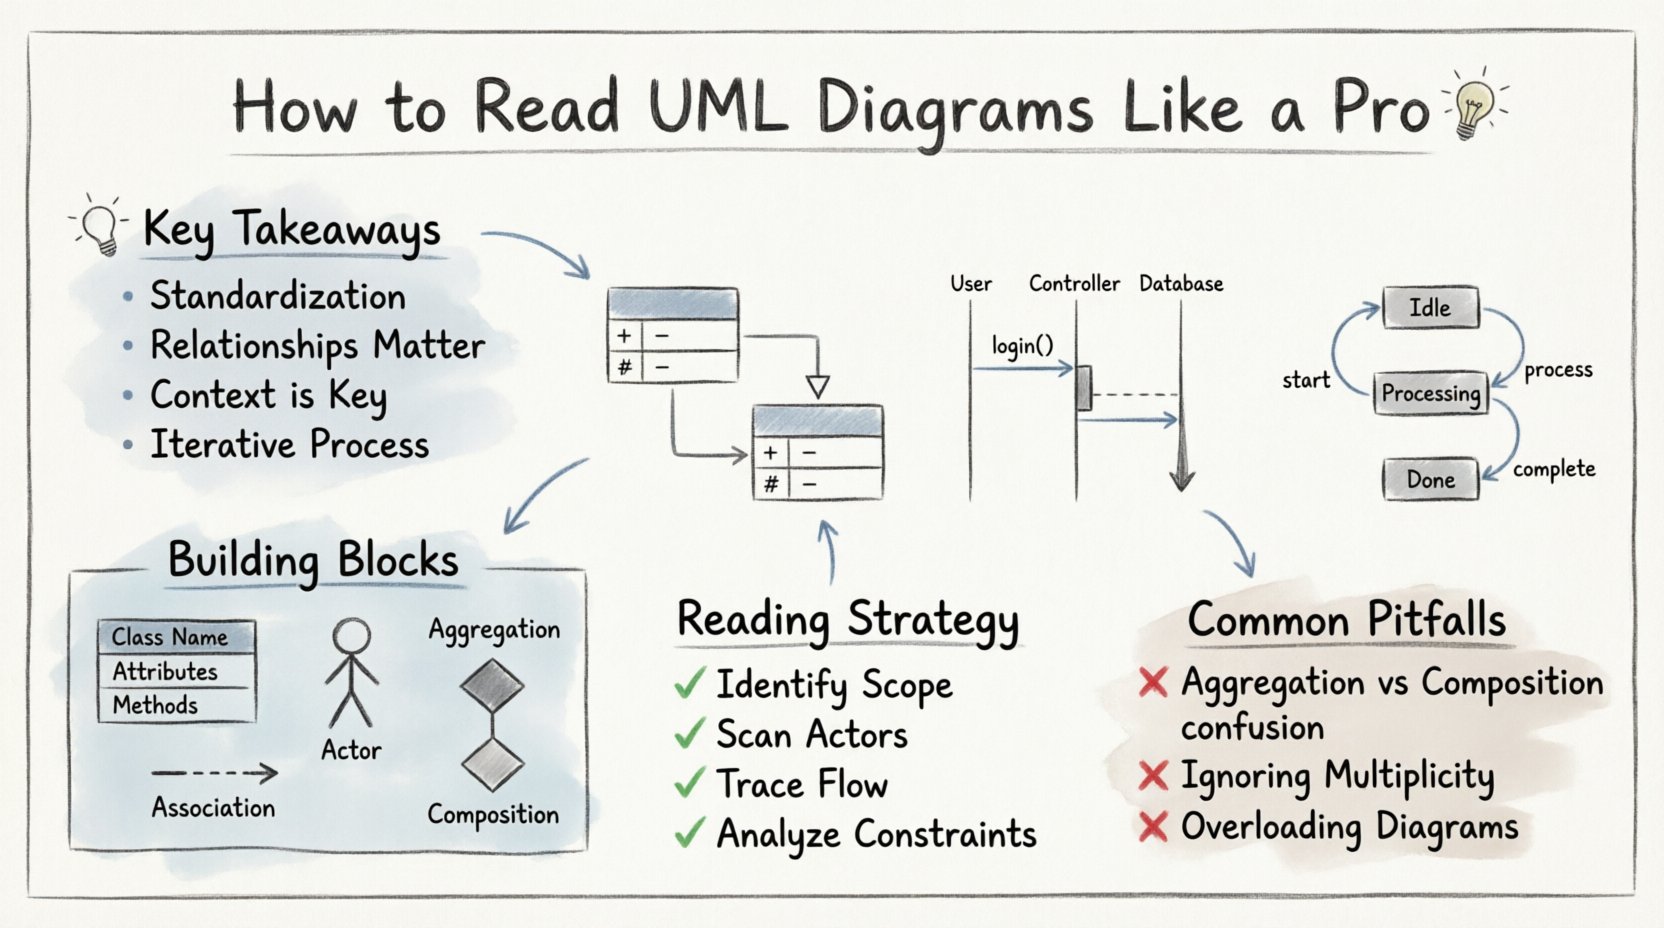
💡 Key Takeaways
Standardization: Unified Modeling Language provides a common visual language for architects and developers.
Relationships Matter: Understanding lines and arrows is more critical than knowing individual shapes.
Context is Key: Always identify the diagram type before analyzing the details within it.
Iterative Process: Diagrams represent design intent and evolve alongside the code implementation.
Software architecture relies heavily on visualization. When teams collaborate on complex systems, text descriptions often fail to capture the dynamic relationships between components. Unified Modeling Language (UML) fills this gap. It is a standardized visual language used to specify, construct, and document the artifacts of software systems. Reading these diagrams is not merely about recognizing shapes; it is about understanding the logic, flow, and constraints embedded within the design.
Whether you are a developer, a product manager, or a system analyst, the ability to interpret these diagrams accurately reduces ambiguity. It allows you to trace data flow, identify potential bottlenecks, and understand inheritance structures without diving immediately into source code. This guide provides a structured approach to decoding these diagrams with authority and precision.
Understanding the Building Blocks 🧱
Before analyzing complex diagrams, one must master the notation. UML relies on a consistent set of symbols to represent objects, processes, and connections. Misinterpreting a line style can lead to a fundamental misunderstanding of system behavior.
Consider the following table as a reference for the most common elements found across various diagram types:
Element | Visual Representation | Meaning |
|---|---|---|
Class | Rectangle divided into three sections | An object with attributes and methods |
Actor | Stick figure icon | A user or external system interacting with the software |
Solid Line | Straight line connecting boxes | Association or dependency |
Dashed Line | Dotted or dashed line | Dependency or implementation |
Open Arrowhead | Triangle pointing to a box | Dependency (A uses B) |
Filled Diamond | Black diamond shape | Composition (Strong ownership) |
Class Diagrams: The Backbone of Structure 🏗️
Class diagrams are the most prevalent type of static diagram. They describe the static structure of a system by showing its classes, attributes, operations, and the relationships among objects. When reading a class diagram, start by identifying the central entities.
Attributes and Visibility
Attributes represent the data stored within a class. They are often preceded by symbols indicating visibility:
+ (Plus sign): Public. Accessible from any other class.
– (Minus sign): Private. Accessible only within the class itself.
# (Hash sign): Protected. Accessible by the class and its subclasses.
Relationships and Multiplicity
The lines connecting classes define how they interact. The most critical aspect is multiplicity, often denoted by numbers near the ends of lines.
1: Exactly one instance.
0..1: Zero or one instance.
1..* or *: One or more instances.
For example, a Customer class might have a relationship with an Order class. If the notation shows 1 on the Customer side and 0..* on the Order side, it implies one customer can place many orders, but an order belongs to exactly one customer. This logic dictates database schema design and API relationships.
Inheritance vs. Association
Distinguishing between inheritance and association is vital. Inheritance (Generalization) is shown by a solid line with a hollow triangle pointing to the parent class. This means “Is-a”. A Car is a Vehicle. Association is a structural relationship, often represented by a simple line. A Driver drives a Car, but a driver is not a type of car.
Sequence Diagrams: Visualizing Time ⏱️
While class diagrams show structure, sequence diagrams show behavior over time. They depict interactions between objects in a specific order. Reading these requires a top-down approach, following the vertical timeline of messages.
Key Elements
Objects are represented as vertical rectangles at the top, called lifelines. Messages are horizontal arrows pointing from one lifeline to another. The direction of the arrow indicates the sender and receiver.
Synchronous Call: Solid line with a solid arrowhead. The sender waits for the receiver to complete the action before continuing.
Asynchronous Call: Solid line with a hollow arrowhead. The sender continues without waiting.
Return Message: Dashed line with a hollow arrowhead. Indicates a response from the receiver.
Activation Bars
Thin rectangles on the lifeline indicate when an object is actively performing an operation. This visual cue helps identify bottlenecks. If an activation bar extends for a long time, it suggests a computationally expensive task or a potential blocking operation.
State Machine Diagrams: Tracking Conditions 🔄
State machine diagrams focus on the lifecycle of a single object. They are essential for understanding complex workflows where an object transitions between different states based on events.
Start with the initial state, usually a solid black circle. Follow the arrows to the next state, represented by a rounded rectangle. The label on the arrow indicates the event triggering the transition. If you see a slash followed by text (e.g., /sendNotification), it represents an action performed during the transition.
Understanding these diagrams helps in debugging. If a system enters an unexpected state, the diagram provides the expected path, making it easier to trace where the logic diverged.
Reading Strategy and Methodology 🧠
To read these diagrams effectively, adopt a systematic approach. Do not attempt to absorb the entire diagram at once. Break it down into manageable chunks.
Identify the Scope: Determine what the diagram is trying to explain. Is it a high-level overview or a detailed implementation detail?
Scan for Actors: In use case diagrams, identify the external entities interacting with the system. This sets the boundary of the design.
Trace the Flow: In sequence or activity diagrams, trace the path from start to finish. Look for loops and branching paths.
Analyze Constraints: Check for notes or constraints attached to relationships. These often contain critical business rules.
Common Pitfalls to Avoid 🚫
Even experienced practitioners can misinterpret diagrams. Being aware of common errors prevents costly misunderstandings.
Confusing Aggregation and Composition: Both are types of association with diamonds. Aggregation (hollow diamond) implies a “has-a” relationship where parts can exist independently. Composition (filled diamond) implies the parts cannot exist without the whole. This distinction impacts data lifecycle management.
Ignoring Multiplicity: Focusing only on the shapes and ignoring the numbers can lead to incorrect assumptions about data volume and relationships.
Overloading Diagrams: A diagram trying to explain everything is often useless. Look for separate diagrams for different concerns, such as separating business logic from data storage.
Conclusion on Diagram Literacy 📚
Mastering the visual language of software design is a continuous process. It requires practice and a willingness to question the intent behind every line and shape. By focusing on relationships, constraints, and flow, you can derive significant insights from these diagrams. This capability enhances communication across teams and ensures that the final implementation aligns with the architectural vision.
Start by reviewing a few diagrams today. Try to map the visual elements to the code you are currently working with. Over time, the symbols will become intuitive, allowing you to navigate complex systems with confidence and clarity.