In the realm of system architecture, visualizing the physical reality of software is as critical as defining its logical structure. A deployment diagram provides this physical view, mapping the hardware topology where software artifacts reside. This document outlines the authoritative approach to planning infrastructure layouts using this modeling technique, ensuring alignment between code and compute resources.
💡 Key Takeaways
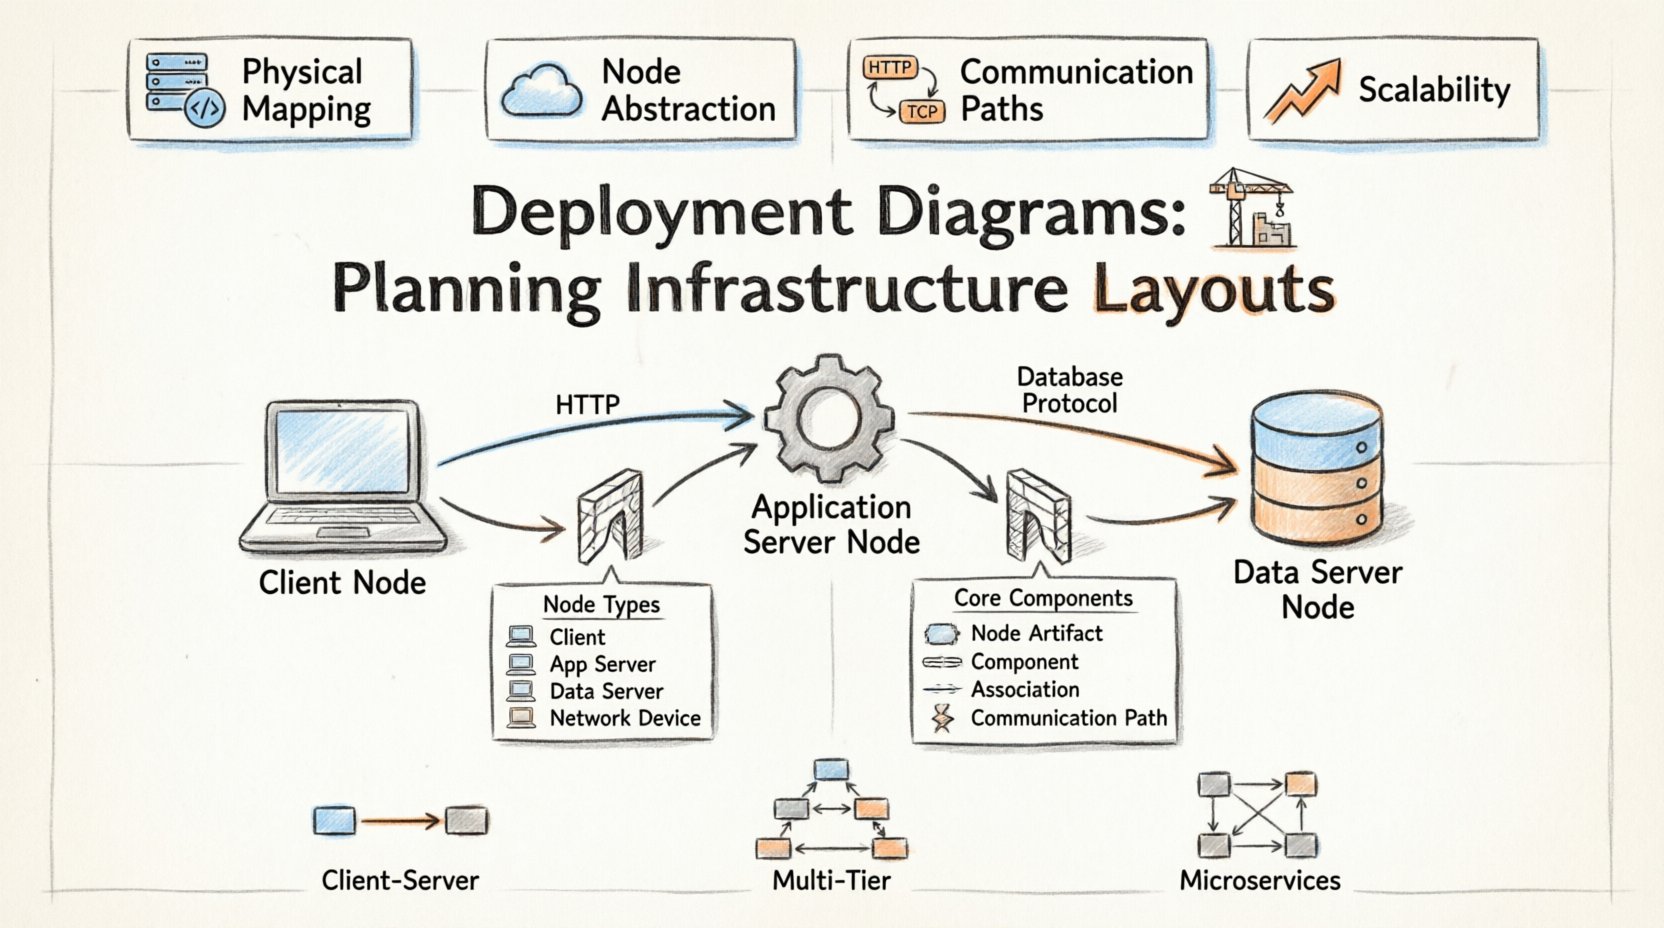
- Physical Mapping: Deployment diagrams bridge the gap between software components and the hardware that executes them.
- Node Abstraction: Use nodes to represent processing resources, distinct from the artifacts running on them.
- Communication Paths: Explicitly define protocols and interfaces connecting distributed systems.
- Scalability: Design layouts that accommodate future growth without requiring complete structural overhauls.
Understanding the Deployment Layer 📍
A deployment diagram is a specialized form of UML diagram that depicts the physical architecture of a system. Unlike class diagrams that focus on static structure or sequence diagrams that focus on behavior, deployment diagrams focus on topology. They answer the question: Where does the software live, and how does it talk to other instances of itself?
This planning phase is vital for DevOps teams, system architects, and infrastructure engineers. It serves as a blueprint for provisioning environments, configuring network security, and establishing monitoring protocols. By defining the hardware nodes and the software artifacts they host, teams gain clarity on dependencies and resource allocation.
Core Components 🧱
To construct a meaningful infrastructure layout, one must understand the fundamental building blocks. These elements form the vocabulary of the deployment model.
| Element | Description |
|---|---|
| Node | A physical or virtual computing resource. Examples include servers, workstations, routers, or cloud containers. |
| Artifact | A physical representation of software. Examples include executable files, libraries, configuration scripts, or database schemas. |
| Component | A logical grouping of functionality that is deployed to a node. |
| Association | A relationship connecting nodes to artifacts or nodes to other nodes. |
| Communication Path | A network connection between nodes, often specifying protocols like HTTP or TCP/IP. |
Mapping the Physical Architecture 🔗
When planning an infrastructure layout, the first step is identifying the nodes. Nodes represent the computational power available. In modern contexts, these are rarely physical metal boxes. They are virtual machines, Kubernetes pods, or serverless functions. Despite the abstraction, the deployment diagram must treat them as discrete entities capable of hosting artifacts.
Each node should be labeled with its type and capacity. For instance, a web server node might differ from a database node. This distinction helps in understanding resource bottlenecks. A web server requires high I/O for requests, while a database node requires high disk throughput and memory stability. Grouping similar nodes allows for easier scaling strategies.
Node Types and Roles
- Client Node: The entry point for user interaction. This could be a browser, a mobile device, or a thick client application.
- Application Server: Hosts the business logic. It processes requests from clients and interacts with data sources.
- Data Server: Dedicated to persistence. It manages the storage and retrieval of information.
- Network Device: Routers, firewalls, and load balancers that direct traffic between nodes.
Strategic Planning Steps 📝
Creating a deployment diagram is not merely about drawing boxes; it is about planning the lifecycle of the system.
- Inventory Assessment: List all hardware and software resources currently available. Identify constraints such as bandwidth limits or storage quotas.
- Artifacts Definition: Determine what needs to be deployed. Is it a compiled binary, a container image, or a configuration file?
- Topology Design: Arrange nodes to minimize latency. Place data servers close to application servers if performance is critical.
- Security Zoning: Define network boundaries. Separate public-facing nodes from internal data nodes using firewalls.
- Redundancy Planning: Decide where failover nodes exist. If one server goes down, where does the traffic shift?
Common Patterns & Considerations 🛡️
Certain architectural patterns emerge frequently when planning infrastructure. Recognizing them helps in applying standard solutions.
Client-Server Architecture
This is the most common pattern. The client initiates requests, and the server processes them. In a deployment diagram, this is shown as a node on one side connected to a node on the other. Security considerations here involve protecting the server node from unauthorized access via the communication path.
Multi-Tier Architecture
Here, logic is separated into distinct layers. A presentation layer, an application layer, and a data layer. Each layer resides on different nodes. This separation allows teams to scale specific layers independently. For example, if the application layer is under heavy load, add more nodes there without touching the database layer.
Microservices Architecture
In distributed systems, services are deployed across many nodes. The deployment diagram becomes complex quickly. Use aggregation to group related services. Show the service mesh or load balancer that routes traffic between these microservices.
Communication Paths 🔌
Nodes do not exist in isolation. They communicate. The lines connecting them in a deployment diagram represent these pathways. It is crucial to specify the protocol used. A line labeled “HTTP” implies web traffic, while “Database Protocol” implies direct data access.
Security is inherent in these paths. A path crossing a firewall boundary should be noted. Encryption standards like TLS should be considered for sensitive data transmission. If the diagram shows a direct connection between a public node and a private database node, it indicates a security risk that must be addressed in the infrastructure plan.
Maintaining the Diagram 🔄
Infrastructure changes. Servers are replaced, IPs shift, and cloud regions expand. A deployment diagram is a living document. It requires maintenance to remain useful.
- Version Control: Store diagram files alongside the source code or infrastructure-as-code scripts.
- Review Cycles: Update the diagram during every major release or architectural review.
- Automation: Where possible, generate diagrams from infrastructure configurations to ensure accuracy.
By treating the deployment diagram as a dynamic asset, teams ensure that their documentation reflects reality. This reduces the cognitive load on engineers when troubleshooting or onboarding new staff.
Integrating with Logical Models 🧩
Deployment diagrams should not stand alone. They complement logical models like class diagrams or component diagrams. While the logical model defines what the system does, the deployment model defines where it runs. Mapping components from the logical model to nodes in the deployment model creates a complete picture of the system.
For example, a specific class representing a payment processor might be deployed to a secure node behind a firewall. This linkage ensures that security requirements are met in the physical layout. It also helps in capacity planning. If a component is critical, ensure it is deployed on a high-availability node.
Final Considerations 🚀
Effective infrastructure planning relies on clear communication and precise documentation. Deployment diagrams serve as the visual language for this purpose. They translate abstract requirements into concrete hardware and network configurations.
By focusing on nodes, artifacts, and connections, architects can build systems that are robust, scalable, and secure. The goal is not just to describe the current state, but to validate the future state. A well-crafted diagram anticipates growth and failure modes, guiding the team toward a resilient design.