System analysis and design rely heavily on visual representations to communicate complex information. Among the various modeling techniques available, the Data Flow Diagram (DFD) stands out as a fundamental tool for understanding how information moves through a system. This guide explores the theoretical foundations and practical applications of DFDs without relying on specific software tools. By focusing on the core principles, practitioners can design robust systems that accurately reflect data requirements and processing logic.
Understanding the Data Flow Diagram 🧐
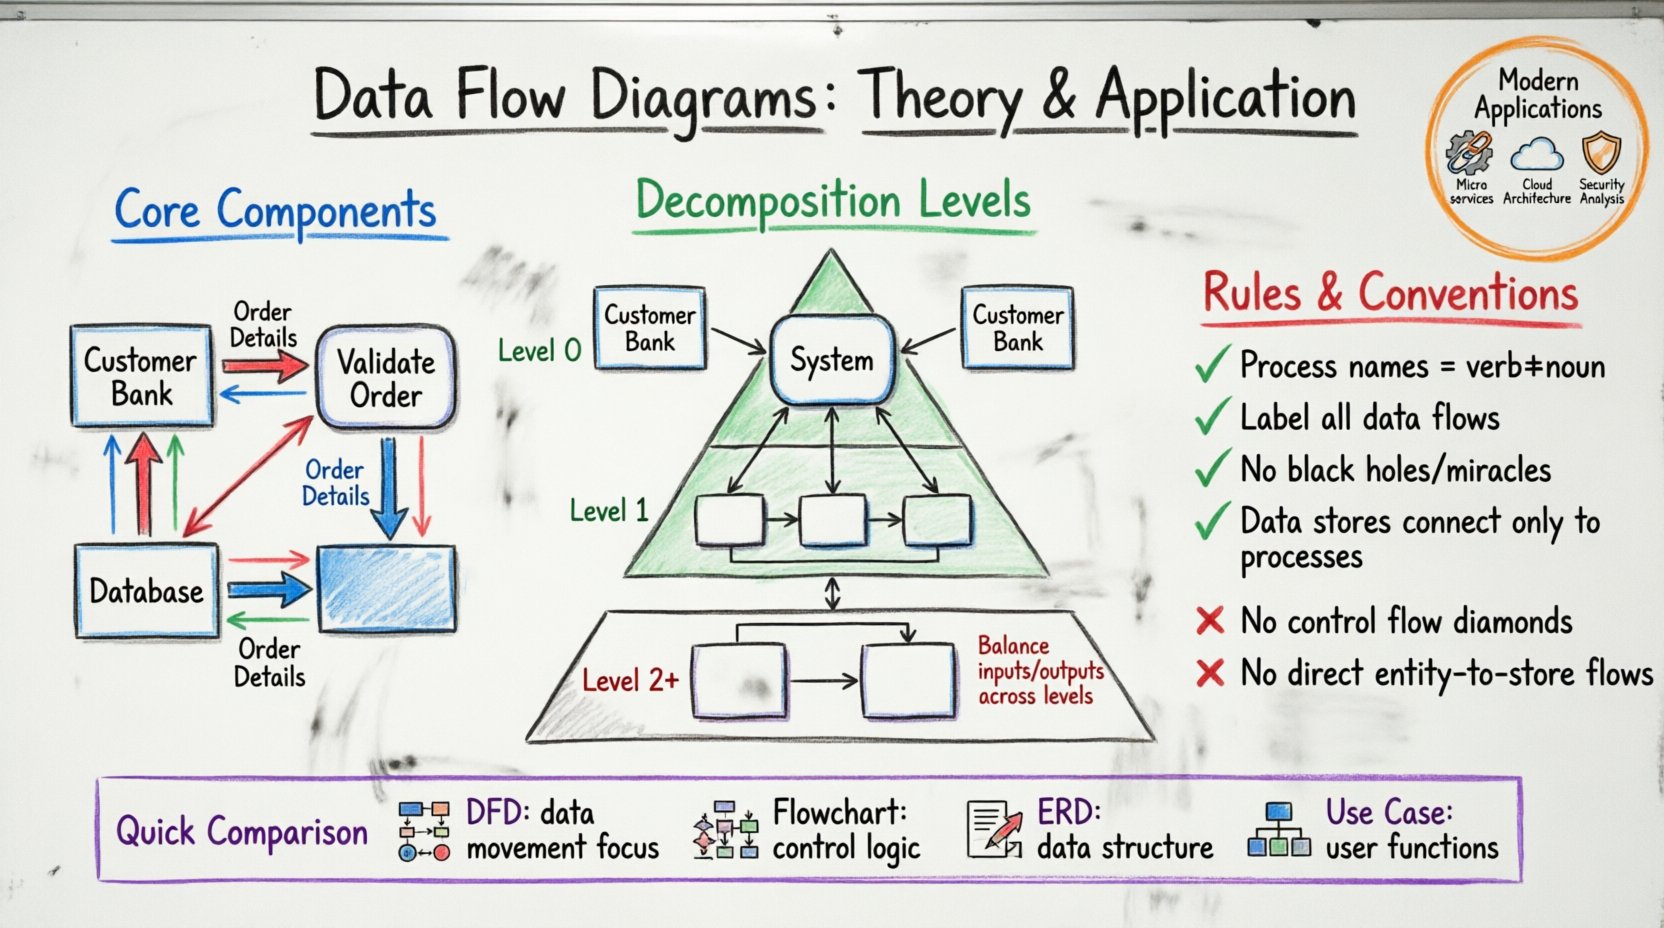
A Data Flow Diagram is a graphical representation of the flow of data through an information system. Unlike a flowchart, which focuses on the control logic and sequence of operations, a DFD emphasizes the movement of data between processes, data stores, and external entities. It serves as a blueprint for system architects and analysts to visualize inputs, outputs, and transformations.
The primary goal of a DFD is to describe what the system does, rather than how it does it. This distinction is crucial during the requirements gathering phase. It allows stakeholders to validate the logic of the system before any code is written. The methodology originated from structured analysis techniques developed in the 1970s, notably by Edward Yourdon and Larry Constantine, and remains relevant in modern software engineering.
Core Components of a DFD 🧱
To construct a valid diagram, one must understand the four fundamental symbols used to represent system elements. Each symbol has a specific meaning and function within the diagrammatic structure.
- External Entities: Also known as terminators, sources, or sinks, these represent people, organizations, or other systems that interact with the system being modeled. They are the source of input data or the destination for output data. They are typically drawn as rectangles.
- Processes: These represent actions or transformations performed on the data. A process takes input data flows, manipulates them, and produces output data flows. In DFD notation, processes are often depicted as rounded rectangles or circles.
- Data Stores: These represent places where data is held for future use. They can be physical databases, files, or even manual filing systems. Data stores are usually drawn as open-ended rectangles or parallel lines.
- Data Flows: These are the arrows that connect the components. They indicate the direction of data movement and label the specific information being transferred. Data flows must have a meaningful name describing the content.
Understanding the interaction between these components is the first step in creating a coherent model. Data cannot simply appear or disappear; it must flow from an entity, through a process, and potentially into a store or out to another entity.
Levels of Decomposition 📉
Complex systems cannot be represented adequately in a single view. DFDs use a technique called decomposition to break down complex processes into smaller, manageable parts. This creates a hierarchy of diagrams, often referred to as levels.
Context Diagram (Level 0)
The Context Diagram is the highest level of abstraction. It shows the entire system as a single process and its interaction with external entities. This diagram provides a high-level overview, ensuring that all major inputs and outputs are accounted for. It defines the boundary between the system and its environment.
Level 1 DFD
Once the context is established, the main process is exploded into its major sub-processes. A Level 1 DFD shows the major functional areas of the system. It details the primary data flows between these sub-processes and external entities. This level is often used to communicate with business stakeholders who need to understand the major functions.
Level 2 and Beyond
For more detailed analysis, Level 1 processes can be further decomposed into Level 2 DFDs. This continues until the processes are simple enough to be implemented directly. Each level must maintain balancing, meaning the inputs and outputs of a parent process must match the sum of inputs and outputs of its child processes.
Comparison of DFD Levels
| Level | Focus | Primary Audience | Detail Granularity |
|---|---|---|---|
| Context (Level 0) | System Boundary | Stakeholders, Management | Very High (Single Process) |
| Level 1 | Major Functions | Project Managers, Analysts | High (Sub-processes) |
| Level 2 | Specific Logic | Developers, Technical Leads | Medium (Detailed Steps) |
| Level 3+ | Algorithmic Logic | Programmers | Low (Atomic Operations) |
Rules and Conventions ✅
Adhering to strict conventions ensures that diagrams are readable and accurate. Violating these rules can lead to ambiguity and errors in system design.
- Data Store Interaction: Data must flow between a process and a data store. Processes cannot talk directly to other processes without data flowing through them, and data cannot flow directly from an entity to a store without processing.
- Process Naming: Every process must have a verb-noun name (e.g., “Calculate Tax”, not “Tax”). This clarifies the action being taken.
- Data Flow Naming: Arrows must be labeled with the specific data moving. Avoid generic labels like “Information” or “Data”.
- No Black Holes: A process must not have only inputs and no outputs. Every process must transform data into something else.
- No Miracle Processes: A process must not have only outputs and no inputs. Every output must originate from some input.
- Consistency: Data flow labels must be consistent across all levels of the diagram hierarchy.
Creating a DFD: Step-by-Step Guide 🛠️
Developing a Data Flow Diagram follows a logical progression. It begins with understanding the business context and ends with a detailed technical specification.
Step 1: Identify External Entities
Start by listing all the sources and destinations of data. Who initiates the transaction? Who receives the report? Draw these as rectangles surrounding the system boundary.
Step 2: Define the Central Process
For the Context Diagram, draw a single circle or rounded rectangle in the center. Label it with the name of the system.
Step 3: Map Major Data Flows
Connect the external entities to the central process using arrows. Label each arrow with the data being exchanged. Ensure every entity has at least one connection.
Step 4: Decompose the Process
Expand the central process into sub-processes. Identify the major functions required to achieve the system goals. Draw these as new circles within the boundary.
Step 5: Add Data Stores
Where is data persisted? Add rectangles to represent databases or files. Connect processes to these stores to show where data is read or written.
Step 6: Review and Balance
Check that all inputs and outputs match between the parent and child diagrams. Verify that no data flows violate the rules of interaction.
DFD vs. Other Diagramming Techniques 🔄
While DFDs are powerful, they are often confused with other modeling tools. Understanding the differences ensures the right tool is used for the right job.
- Flowcharts: Flowcharts focus on control flow, decision points, and loops. They describe the logic of a program. DFDs focus on data movement and transformation, ignoring control logic.
- Entity-Relationship Diagrams (ERD): ERDs model the structure of data, specifically relationships between entities and attributes. DFDs model the movement of that data through processes.
- Use Case Diagrams: Use Case diagrams describe functional requirements from a user’s perspective. DFDs describe the internal mechanics of how those functions are processed.
Common Mistakes to Avoid ❌
Even experienced analysts make errors when modeling data flows. Awareness of common pitfalls helps maintain diagram integrity.
- Control Flow in Data Flow: Do not include decision diamonds or loops in a standard DFD. These belong in a flowchart or pseudocode.
- Missing Data Stores: Sometimes analysts forget to include a store for temporary data or logs. Ensure all persistent data is accounted for.
- Inconsistent Naming: If a data flow is called “Order Info” in one diagram, it should not be called “Order Data” in another. Consistency is key for maintenance.
- Over-Complexity: Do not try to fit a whole enterprise system onto one diagram. Use decomposition to manage complexity.
- Ignoring Data Validation: While DFDs don’t show validation logic, ensure that the data entering a process is sufficient for that process to function.
Application in Modern System Design 📝
The utility of Data Flow Diagrams extends beyond legacy systems. They are essential in cloud architecture, microservices design, and business process reengineering.
Microservices Architecture
In distributed systems, understanding data boundaries is critical. DFDs help identify which services need to communicate and what payload they exchange. They assist in defining API contracts and message queues.
Business Process Reengineering
Organizations use DFDs to map current workflows (As-Is) and design future workflows (To-Be). This helps identify bottlenecks, redundant steps, and areas for automation.
Security Analysis
Security professionals use DFDs to identify data sensitivity. By tracing where data flows, they can pinpoint where encryption or access controls are needed. For example, if personal data flows through a public process, a security risk is identified.
Best Practices for Documentation 📋
Documentation accompanies the diagram. It provides context that the visual symbols cannot convey.
- Glossary: Define all terms, acronyms, and data element names used in the diagram.
- Data Dictionary: Maintain a separate document describing the structure of each data store and data flow (field names, types, sizes).
- Process Specifications: For complex processes, provide detailed logic in structured English or pseudocode.
- Version Control: Keep track of changes to the diagrams. Systems evolve, and diagrams must reflect those changes.
Symbol Reference Table 🎨
Refer to this table for standard symbol representations used in structured analysis.
| Element | Shape | Function | Example |
|---|---|---|---|
| External Entity | Rectangle | Source or Sink of Data | Customer, Bank System |
| Process | Rounded Rectangle / Circle | Transformation of Data | Validate Login, Calculate Total |
| Data Store | Open Rectangle / Parallel Lines | Passive Storage | Customer Table, Log File |
| Data Flow | Arrow | Direction of Movement | Order Details, Payment Confirm |
Advanced Considerations 🚀
As systems become more complex, DFDs must adapt. Real-time systems, event-driven architectures, and asynchronous processing introduce nuances that standard DFDs may not fully capture.
- Event Triggers: In event-driven systems, a process might wait for a specific signal. While DFDs don’t explicitly show time, the presence of a specific input can imply a trigger.
- Parallel Processing: When multiple processes occur simultaneously, ensure the diagram shows independent data paths that do not interfere with each other.
- Security Zones: In network diagrams, data flows crossing security boundaries must be clearly marked to indicate encryption or authentication requirements.
Summary of Key Takeaways 🏁
Data Flow Diagrams provide a structured way to visualize system logic. They separate data movement from control logic, making them ideal for requirements analysis. By adhering to the rules of decomposition, balancing, and notation, analysts can create clear, maintainable models.
When building these diagrams, focus on accuracy and clarity. Avoid unnecessary complexity. Ensure every data flow has a purpose and every process has a clear transformation. Regularly review the diagrams with stakeholders to validate understanding. This collaborative approach ensures the final system meets the intended business goals.
The discipline of modeling data flows pays dividends in the development phase. It reduces ambiguity, prevents scope creep, and facilitates better communication among team members. Whether designing a simple database application or a complex enterprise platform, the principles of the Data Flow Diagram remain a cornerstone of effective system design.