In the architecture of information systems, clarity is currency. Two foundational tools dominate the landscape of system analysis and database design: the Data Flow Diagram (DFD) and the Entity Relationship Diagram (ERD). While both serve the purpose of visualizing complex systems, they operate on fundamentally different planes of abstraction. One focuses on movement and transformation; the other on structure and storage. Confusing the two can lead to architectural failures, data inconsistencies, and process bottlenecks. This guide provides a deep dive into the mechanics, applications, and distinctions of these modeling techniques.
Understanding the Data Flow Diagram 🔄
A Data Flow Diagram maps the flow of information through a system. It is a process-oriented model. The primary concern here is not where data lives, but how it moves, changes, and interacts. This diagram type is essential for understanding the logic of a business process or software application.
Core Components of a DFD
To construct a valid DFD, one must understand the four standard symbols used to represent system elements:
- Processes: Represented by circles or rounded rectangles. A process transforms input data into output data. It does not store information but acts upon it. Examples include “Calculate Tax” or “Validate Login”.
- Data Stores: Represented by open-ended rectangles or parallel lines. This indicates where data is held at rest. It is the memory of the system, such as a file, a database table, or a physical archive.
- External Entities: Represented by squares. These are sources or destinations of data outside the system boundary. They can be users, other systems, or hardware devices. They initiate or receive data but do not process it internally.
- Data Flows: Represented by arrows. These show the direction of data movement between processes, stores, and entities. Each flow must have a specific name describing the content, such as “Invoice” or “User Request”.
Levels of DFD Detail
DFDs are hierarchical. They are rarely drawn in a single view. Instead, they are decomposed into levels of detail:
- Context Diagram (Level 0): The highest level view. It shows the entire system as a single process interacting with external entities. It defines the boundaries.
- Level 1 Diagram: Decomposes the main process into major sub-processes. It introduces the first layer of data stores and flows.
- Level 2 and Beyond: Further breakdown of specific sub-processes into granular actions. This level is used for detailed specification.
Understanding the Entity Relationship Diagram 🗃️
An Entity Relationship Diagram focuses on the static structure of data. It is a conceptual model used primarily during the database design phase. The goal is to ensure data integrity, minimize redundancy, and define relationships between different pieces of information.
Core Components of an ERD
The ERD relies on specific notation to define how data entities relate to one another:
- Entities: Represented by rectangles. An entity is a real-world object or concept about which data is stored. Examples include “Customer,” “Product,” or “Order”.
- Attributes: Represented by ovals or listed within the entity rectangle. These describe the properties of an entity. For a “Customer” entity, attributes might include “Name,” “Address,” and “Phone Number”.
- Relationships: Represented by diamonds or lines connecting entities. This defines how entities interact. For instance, a Customer “Places” an Order.
- Cardinality: Defines the quantity of relationships. Is it one-to-one? One-to-many? Many-to-many? This dictates the structural constraints of the database.
Normalization in ERD Design
While DFDs do not typically address normalization, ERDs are deeply tied to it. The design process involves organizing data to reduce duplication. An ERD must reflect the rules of First Normal Form, Second Normal Form, and so on. This ensures that the resulting database is efficient and scalable. Failure to normalize data structures often leads to update anomalies where changing a single piece of information requires edits in multiple places.
Structural Comparison: DFD vs. ERD 📊
To clarify the distinctions, we compare the two models across several dimensions. This table highlights the functional divergence between process flow and data structure.
| Feature | Data Flow Diagram (DFD) | Entity Relationship Diagram (ERD) |
|---|---|---|
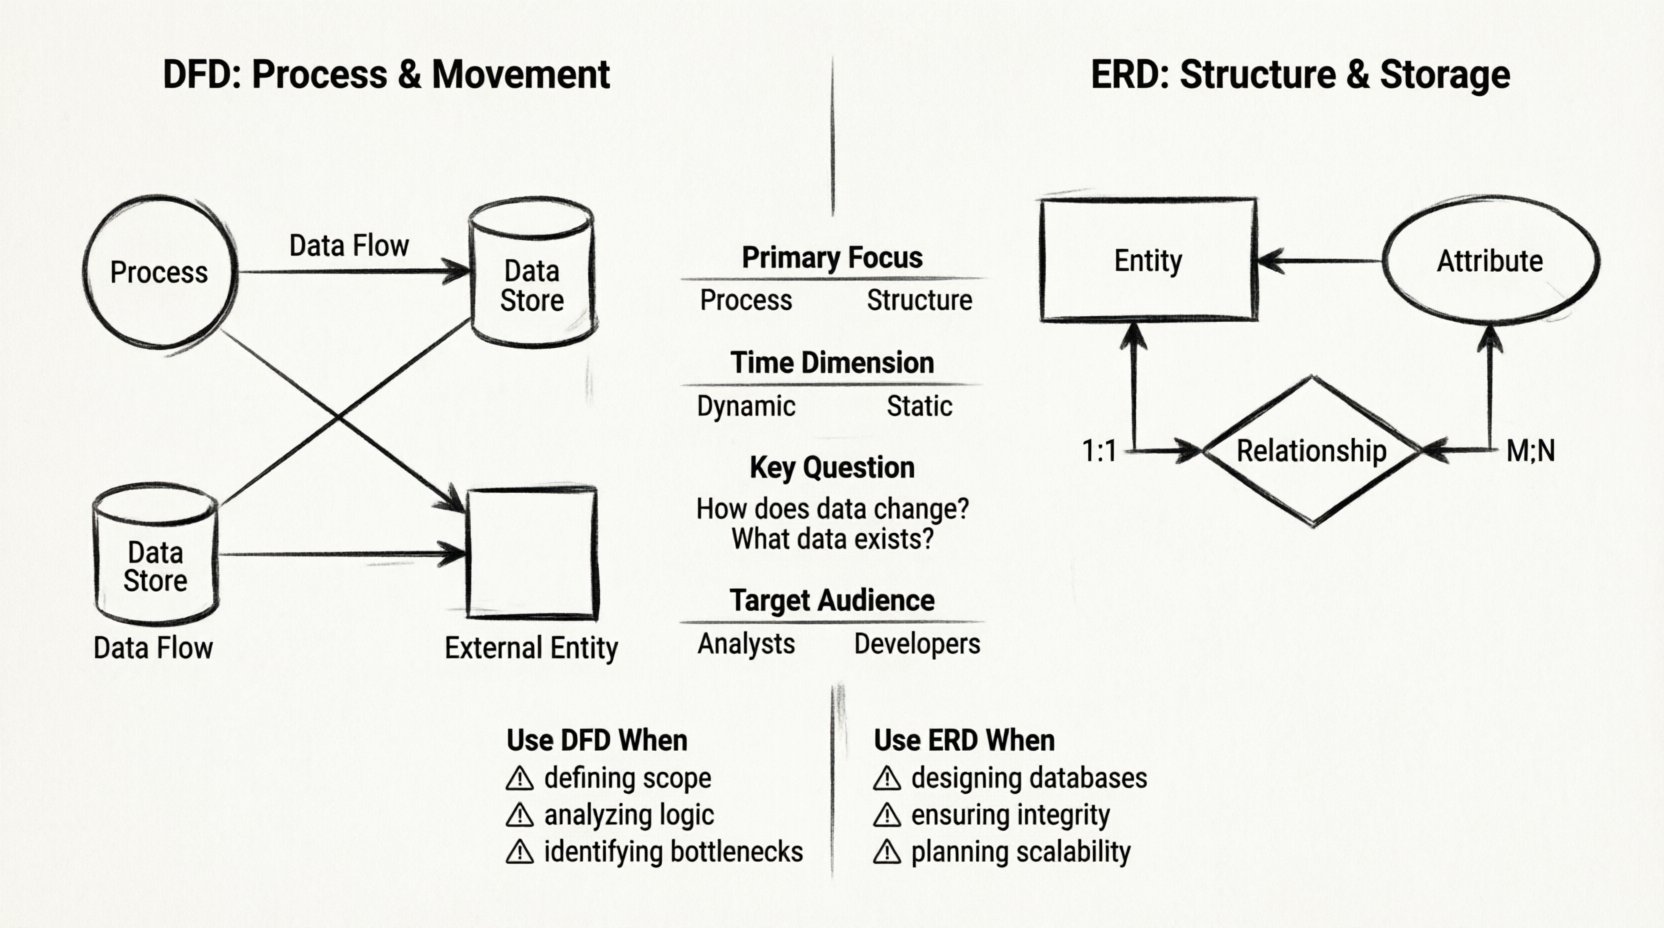
| Primary Focus | Process and Movement | Structure and Storage |
| Time Dimension | Dynamic (Sequence of events) | Static (Snapshot of data) |
| Key Question | How does data change? | What data exists? |
| Target Audience | Business Analysts, Users | Database Administrators, Developers |
| Storage Handling | Generic data stores | Specific tables and keys |
| Logic Representation | Transformations and Logic | Constraints and Rules |
When to Deploy Each Diagram 📅
Choosing the right tool depends on the phase of the project lifecycle. Using an ERD to explain a business process to a stakeholder will confuse them. Using a DFD to explain table relationships to a developer will frustrate them. Here is a breakdown of optimal usage scenarios.
Use DFD When:
- Defining System Scope: You need to show what is inside the system versus what is outside.
- Analyzing Business Logic: You need to trace how a request moves from a user input to a stored record.
- Identifying Bottlenecks: You need to see where data accumulates or where processes stall.
- Communicating with Stakeholders: Non-technical users understand flows better than tables.
Use ERD When:
- Designing Databases: You are setting up the physical or logical storage layer.
- Ensuring Data Integrity: You need to define primary keys, foreign keys, and constraints.
- Planning for Scalability: You need to ensure the data model supports future growth without redundancy.
- API Documentation: You need to define the schema that will be exposed to external consumers.
Building a Data Flow Diagram from Scratch 🛠️
Creating a robust DFD requires a methodical approach. There are no shortcuts in this process if accuracy is the goal. Follow these steps to construct a reliable model.
Step 1: Identify Boundaries
Start by defining the system boundary. What is inside the scope? What is external? Draw a box around the system. Everything inside is part of the system; everything outside is an external entity.
Step 2: Map External Entities
List all the people, departments, or systems that interact with your project. Draw them outside the boundary. Label them clearly.
Step 3: Define Major Processes
Identify the main functions of the system. These become the circles in the diagram. For example, if building a library system, processes might include “Issue Book” and “Return Book”.
Step 4: Connect with Data Flows
Draw arrows connecting entities to processes and processes to data stores. Ensure every arrow has a label. A data flow without a name is meaningless. Ensure data does not flow from an entity directly to another entity without passing through a process.
Step 5: Verify Conservation
Check for data conservation. If a process outputs data, that data must come from somewhere. If a process receives input, it must go somewhere. No data should disappear or appear out of nowhere.
Building an Entity Relationship Diagram from Scratch 🏗️
An ERD requires precision regarding relationships and keys. The structure dictates the performance and reliability of the application.
Step 1: Identify Entities
Scan the requirements for nouns. These are potential entities. Filter out vague nouns. Keep only those that represent distinct objects of value. For example, in a hospital system, “Patient” and “Doctor” are entities. “Treatment” might be an entity or a relationship, depending on complexity.
Step 2: Define Attributes
List the specific details for each entity. Determine which attributes are unique identifiers (Primary Keys). For a “Patient” entity, “Patient ID” is the key. “Name” is an attribute. Ensure attributes are atomic; do not store “Address” as a single field if you need to query by city.
Step 3: Establish Relationships
Determine how entities connect. A Patient is treated by a Doctor. This is a relationship. Determine the cardinality. Does one doctor treat many patients? Yes. Is it many-to-many? Yes. Does one patient have many doctors? Yes.
Step 4: Resolve Many-to-Many
Databases cannot natively store many-to-many relationships. If a Student can take many Courses and a Course has many Students, you must create an associative entity (often called a junction table). This breaks the relationship into two one-to-many relationships.
Step 5: Review Normal Forms
Apply normalization rules. Ensure that non-key attributes depend only on the primary key. If an attribute depends on part of the key, move it to a new entity. This step prevents data anomalies.
Common Pitfalls to Avoid ⚠️
Even experienced architects make mistakes when modeling. Being aware of common errors helps maintain the integrity of the design.
DFD Pitfalls
- Data Flows between Entities: Data must always pass through a process. Direct lines between external entities suggest a lack of system control.
- Black Holes: A process that has input but no output. This is logically impossible in a functioning system.
- Grey Holes: A process with input but no output at all, or output that does not match the input requirements.
- Unlabeled Flows: An arrow without a name provides no information about the content being transferred.
ERD Pitfalls
- Missing Cardinality: Failing to define whether a relationship is one-to-one or one-to-many leads to ambiguity in code implementation.
- Redundant Entities: Creating entities that are essentially duplicates of others, leading to data inconsistency.
- Ignoring Nulls: Failing to decide if an attribute can be empty. This impacts database constraints and application logic.
- Over-normalization: Breaking data into too many tables can make queries slow and complex. Balance is key.
Integrating Both in System Architecture 🏗️
While DFDs and ERDs are distinct, they are not mutually exclusive. A mature system design utilizes both in tandem. The DFD describes the journey of the data, while the ERD describes the destination and storage of the data.
The Integration Process
During the requirements phase, start with a Context Diagram. This sets the stage. As you decompose the system, you will identify data stores. These data stores eventually become the entities in your ERD. The flows in the DFD become the foreign keys and relationships in the ERD.
For example, if a DFD shows an “Update Profile” process moving data to a “User Info” store, the ERD must define a “User” entity with attributes matching that store. The relationship between the process and the store in the DFD informs the read/write permissions and transaction logic in the ERD.
Documentation Consistency
Maintaining consistency between the two diagrams is critical. If the DFD changes to add a new data source, the ERD must be updated to reflect the new table or column. If the ERD changes the structure of a table, the DFD must show the new data flow name or destination. Discrepancies here lead to integration bugs and data loss.
Advanced Considerations for Modern Systems 🚀
While these diagrams originated in the era of mainframes, their principles remain relevant in modern microservices and cloud architectures.
Cloud and DFDs
In cloud environments, data flows often traverse different regions or services. A DFD must explicitly show these boundaries. It helps in understanding latency and data sovereignty requirements. For instance, if data flows from a user in Europe to a server in the US, compliance regulations may apply.
NoSQL and ERDs
Traditional ERDs assume a relational structure. NoSQL databases often use document or graph models. While the core concept of entities and relationships remains, the implementation differs. In a document store, the “Entity” is the document itself. Relationships might be embedded or linked via IDs rather than strict foreign keys. The ERD still serves as a blueprint, but the notation may adapt to the schema-less nature of the technology.
Summary of Differences
The distinction between these two diagrams lies in their intent. The DFD is a map of motion. It answers the question: “What happens to the data?” The ERD is a map of structure. It answers the question: “What is the data?” Both are required for a complete picture of a software system. Relying on one without the other leaves a gap in understanding that can compromise the project.
By mastering the construction and application of both models, you ensure that the system is not only functional in its operations but robust in its data management. This dual approach covers the dynamic and static aspects of information architecture, providing a comprehensive foundation for development and analysis.
Frequently Asked Questions
Can I use one diagram for both purposes?
No. A DFD cannot effectively show table keys or normalization rules. An ERD cannot effectively show process logic or data transformation steps. They serve different stakeholders and phases.
Which should I create first?
Typically, start with the DFD. You need to understand the processes before you know what data needs to be stored. Once the data stores are identified in the DFD, you can expand them into a full ERD.
Do these diagrams work with Agile methodologies?
Yes. In Agile, these diagrams are often created just-in-time for specific user stories rather than as massive upfront documents. They serve as living documentation that evolves with the product.