Creating a clear visual representation of how information moves through a system is fundamental to system analysis and design. A Data Flow Diagram (DFD) serves this exact purpose. It maps the flow of data from external sources into the system and out to destinations, detailing the transformations that occur along the way.
This guide provides a deep dive into the mechanics of constructing DFDs. We will explore the historical context, the core symbols, the hierarchical levels, and the practical steps required to draft a functional diagram without relying on specific proprietary tools. By the end of this tutorial, you will understand the logic behind the lines and be equipped to document complex systems effectively.
🧠 Understanding the Purpose of a DFD
Before drawing a single line, it is essential to understand what a DFD actually represents. Unlike a flowchart, which describes the control flow or logic of a program, a DFD focuses exclusively on the data.
- Focus on Data: It shows where data comes from (sources) and where it goes (sinks).
- Focus on Processes: It illustrates how data is transformed into different forms.
- Focus on Storage: It indicates where data is held for later retrieval.
DFDs are particularly useful during the requirements gathering phase. They help stakeholders visualize the system boundaries and confirm that all necessary inputs and outputs are accounted for. This visual communication bridges the gap between technical teams and business users.
🛠️ Core Components and Notation
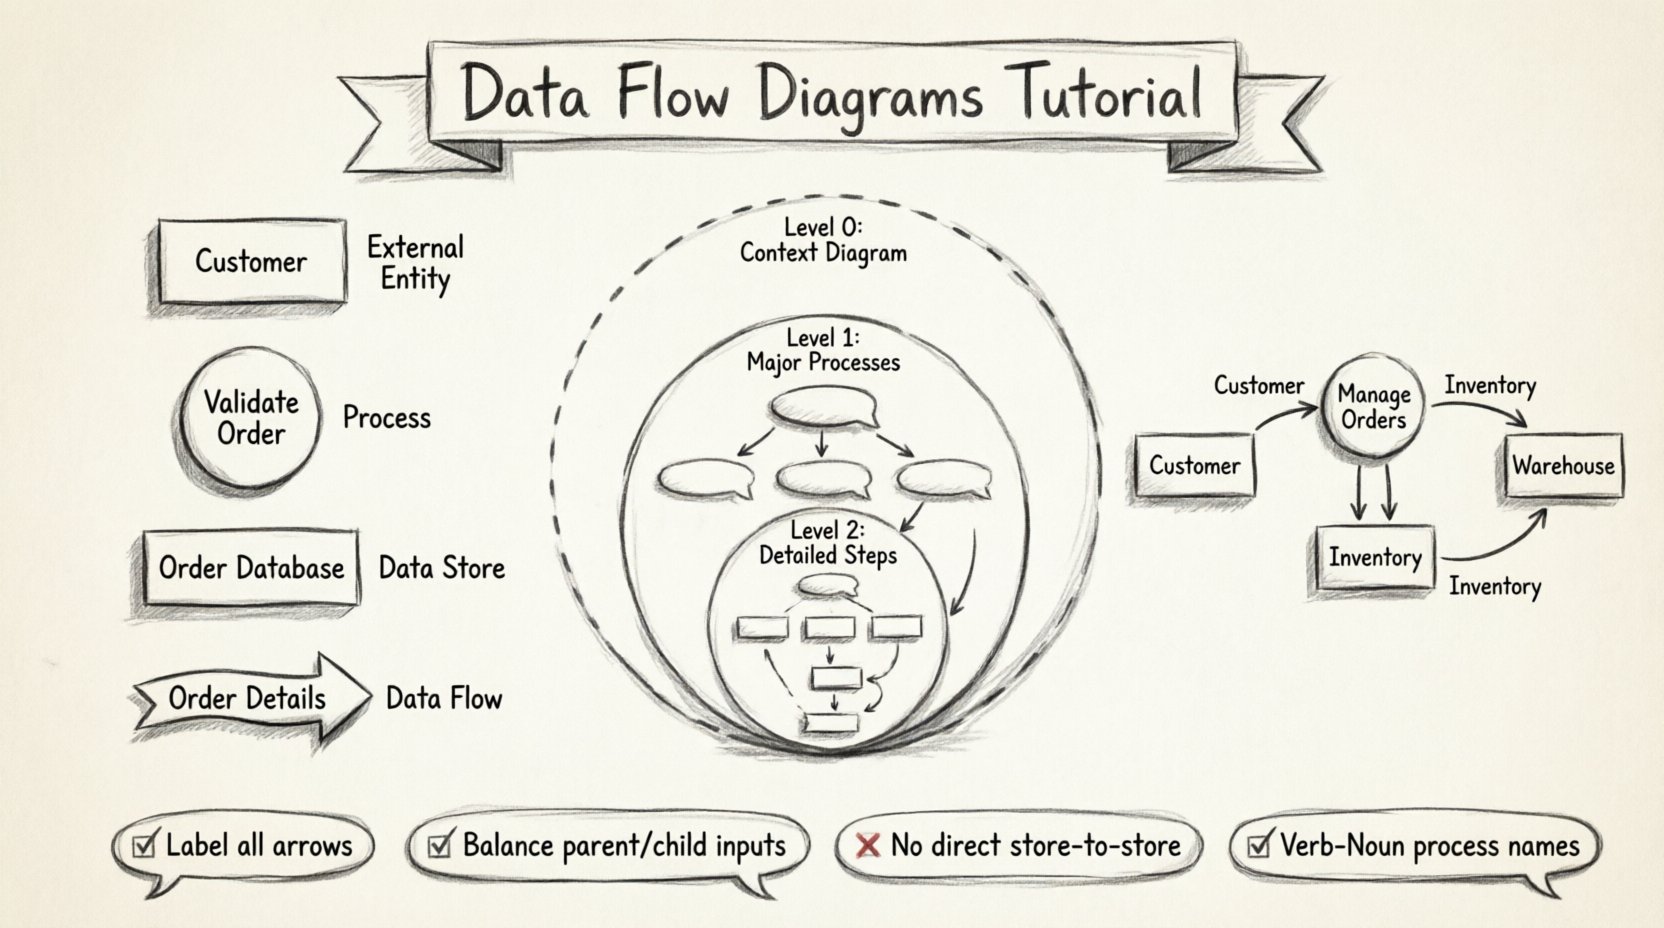
Every Data Flow Diagram is built using a specific set of shapes and lines. While there are two main notations used historically (Yourdon & DeMarco vs. Gane & Sarson), the concepts remain consistent. Below is a breakdown of the four fundamental elements required for any DFD.
1. External Entities (Terminators)
These represent sources or destinations of data that exist outside the system boundaries. They are the people, departments, or other systems that interact with your process.
- Examples: Customer, Supplier, Bank, Government Agency.
- Visual: Typically a rectangle or a human icon.
- Rule: Do not place data stores or processes outside the system boundary.
2. Processes
A process transforms incoming data flows into outgoing data flows. It represents work being done, calculations, or decisions made within the system.
- Examples: “Calculate Tax”, “Validate Order”, “Generate Report”.
- Visual: A circle or a rounded rectangle.
- Rule: Every process must have at least one input and one output.
3. Data Stores
These are repositories where data is saved for future use. This could be a database, a file, a physical filing cabinet, or a temporary buffer.
- Examples: Customer Database, Inventory Log, Order History.
- Visual: Open-ended rectangle or two parallel lines.
- Rule: Processes must read from or write to data stores; they cannot pass data directly from one store to another.
4. Data Flows
These are the pathways that data takes. They represent the movement of data between entities, processes, and stores.
- Examples: “Order Details”, “Payment Confirmation”, “Stock Update”.
- Visual: An arrow with a label describing the data content.
- Rule: Arrows must be labeled. Unlabeled arrows are invalid.
| Component | Symbol Shape (Yourdon & DeMarco) | Symbol Shape (Gane & Sarson) | Function |
|---|---|---|---|
| External Entity | Rectangle | Square with rounded corners | Source or Destination |
| Process | Circle | Rounded Rectangle | Transforms Data |
| Data Store | Open Rectangle | Open-ended Rectangle | Stores Data |
| Data Flow | Arrow | Arrow | Moves Data |
📉 Levels of Abstraction in DFDs
Complex systems cannot be represented in a single diagram. To manage complexity, DFDs are drawn at different levels of detail, similar to zooming in on a map. This hierarchy is known as decomposition.
Level 0: The Context Diagram
This is the highest level view. It shows the entire system as a single process and its interaction with external entities. It defines the system boundary clearly.
- Process Count: 1 (The whole system).
- Detail Level: Minimal. No internal processes shown.
- Usage: Scope definition and high-level agreement.
Level 1: Major Sub-Processes
Here, the single process from the Context Diagram is exploded into its major sub-processes. This is where the internal structure of the system begins to appear.
- Process Count: 3 to 7 is ideal for readability.
- Detail Level: Major functional areas.
- Usage: Understanding major functional modules.
Level 2: Detailed Sub-Processes
This level drills down into specific Level 1 processes. It is used for complex functions that require further breakdown.
- Process Count: Varies per parent process.
- Detail Level: Specific steps within a function.
- Usage: Implementation guidance and detailed logic.
Level 3: Primitive Diagrams
These are rarely drawn unless the system is exceptionally complex. They represent the lowest level of detail, often corresponding to specific code modules or manual procedures.
🚀 Step-by-Step Guide to Drawing a DFD
Follow this structured approach to create a robust Data Flow Diagram for your project.
Step 1: Identify the System Boundary
Define what is inside the system and what is outside. This is crucial for determining which entities are external and which processes are internal. Draw a box around the system processes.
Step 2: Identify External Entities
List all the people, organizations, or external systems that will interact with your system. Place them outside the boundary box. Label them clearly.
Step 3: Draw the Context Diagram (Level 0)
Draw a single circle in the center representing the entire system. Connect the external entities to this circle using arrows. Label these arrows with the data being exchanged (e.g., “Order Request”, “Invoice Sent”).
Step 4: Decompose into Level 1
Expand the single circle into multiple processes. Ask: “What are the main functions of this system?”.
- Identify the input data.
- Identify the output data.
- Identify the data stores required.
- Draw arrows connecting entities, processes, and stores.
Step 5: Apply Balancing Rules
This is the most critical technical rule. The inputs and outputs of a parent process must match the inputs and outputs of its child diagram.
- If a Level 0 process has an input “Customer ID”, a Level 1 child process must also have “Customer ID” flowing in or out.
- If a Level 1 process produces “Report Data”, the Level 0 parent must also output “Report Data” to the external entity.
Step 6: Review and Validate
Check your diagram against the requirements.
- Are all arrows labeled?
- Do all processes have inputs and outputs?
- Is there a path from every entity to a store or process?
- Are there any “spaghetti” lines (crossing over each other unnecessarily)?
🏪 Example Scenario: Online Store System
To illustrate the concepts, let us walk through a simplified Online Store scenario.
Context Diagram (Level 0)
- Entity: Customer.
- Entity: Payment Gateway.
- Entity: Warehouse.
- Process: Online Store System.
- Flows:
- Customer ➔ System: Order Details
- System ➔ Customer: Order Confirmation
- System ➔ Payment Gateway: Payment Info
- Payment Gateway ➔ System: Payment Status
- System ➔ Warehouse: Shipping Request
Level 1 Decomposition
We break the “Online Store System” into three main processes:
- Manage Orders: Receives order details, checks stock.
- Process Payments: Handles credit card info, validates funds.
- Ship Goods: Communicates with the warehouse.
Data Stores
We introduce two data stores:
- Order Database: Stores order history and status.
- Inventory Database: Stores current stock levels.
In this Level 1 diagram, “Manage Orders” writes to the Order Database. “Process Payments” reads from the Order Database to confirm the order exists before charging the card. “Ship Goods” reads from the Inventory Database to confirm items are available before sending the shipping request.
⚠️ Common Mistakes and Pitfalls
Even experienced analysts make errors when drafting DFDs. Avoid these common pitfalls to ensure your diagrams remain valid and useful.
- Control Flows: Do not draw arrows that represent control signals (e.g., “Click Button”, “Error Message”) unless they contain data. DFDs track data, not control logic.
- Direct Store-to-Store Flows: Data cannot move directly from one data store to another. It must pass through a process first. This ensures transformation or validation occurs.
- Unlabeled Arrows: An arrow without a label provides no information. Always name the data flowing through the line.
- Ghost Processes: A process that has no inputs or no outputs is useless. Every bubble must transform something.
- Over-Complication: If a Level 1 diagram has more than 7-9 processes, it is likely too detailed. Split it into logical functional areas.
- Ignoring Black Holes: A process with only inputs and no outputs is a “black hole”. It consumes data but produces nothing.
- Ignoring Miracles: A process with only outputs and no inputs is a “miracle”. It creates data from nothing.
📝 Best Practices for Documentation
Creating the diagram is only half the work. Documentation and maintenance ensure the DFD remains valuable over time.
Consistent Naming Conventions
Use a standard format for naming processes and flows.
- Processes: Use Verb-Noun format (e.g., “Validate User”, “Generate Report”).
- Flows: Use Noun format (e.g., “User Credentials”, “Sales Report”).
- Stores: Use Plural Nouns (e.g., “Customer Records”, “Product List”).
Color Coding
Use colors to distinguish between different types of components or different levels of abstraction.
- Blue for External Entities.
- Green for Processes.
- Orange for Data Stores.
- Red for Critical Data Flows.
Version Control
System requirements change. Your DFDs must reflect these changes.
- Assign version numbers to your diagrams (v1.0, v1.1).
- Keep a change log documenting what was added, removed, or modified.
- Archive old versions to maintain an audit trail.
🔗 Integration with Other Methodologies
DFDs do not exist in isolation. They are often part of a larger structured analysis framework.
Entity-Relationship Diagrams (ERD)
While DFDs show the flow of data, ERDs show the structure of data. When you identify Data Stores in your DFD, you often need to design the tables for them using an ERD. The DFD tells you what data is needed; the ERD tells you how it is structured.
Structured English
For complex processes within the DFD, a simple diagram may not be enough. Structured English is a mix of natural language and programming logic used to describe the logic inside a process bubble.
Data Dictionary
Every data flow, store, and entity should be defined in a Data Dictionary. This document provides the metadata for the diagram, including data types, sizes, and formats (e.g., “Customer ID: Integer, 10 digits”).
🛠️ Tooling and Software Selection
You do not need expensive software to create a DFD. The focus should be on the logic, not the aesthetics.
- Whiteboards & Markers: Excellent for brainstorming and initial drafts with stakeholders.
- Paper & Pencil: The fastest way to iterate on a concept without software constraints.
- General Drawing Tools: Any vector graphics tool can be used to create clean, digital diagrams.
- Specialized Analysis Tools: There are many dedicated tools available for systems analysis. Choose one that supports standard DFD notation and allows for versioning.
Regardless of the tool, ensure it allows you to export the diagrams in a standard format for sharing with the team.
🔄 Maintenance and Lifecycle
A DFD is a living document. When a system evolves, the diagram must evolve.
- Change Requests: When a new feature is requested, update the Level 1 diagram to see the impact.
- Impact Analysis: If a process changes, check which other processes depend on its outputs. Update those diagrams as well.
- Code Reviews: Developers should refer to the DFD during implementation to ensure the code matches the data flow logic.
- Testing: Test cases can be derived from the data flows. If a flow exists, there must be a test to verify data integrity along that path.
📚 Summary of Key Principles
To summarize the essential takeaways for creating effective Data Flow Diagrams:
- Start Simple: Begin with the Context Diagram (Level 0) to define scope.
- Decompose Gradually: Move from Level 0 to Level 1 to Level 2 only when necessary.
- Balance Rigorously: Ensure inputs and outputs match between parent and child levels.
- Label Everything: No unlabeled arrows or processes.
- Focus on Data: Ignore control logic; track only data movement.
- Validate with Stakeholders: Review diagrams with business users to ensure accuracy.
By adhering to these principles, you create a documentation artifact that serves as a reliable map for developers, testers, and business analysts. The clarity of your diagram directly correlates to the efficiency of the system development lifecycle.
🏁 Final Thoughts
Mastering the art of the Data Flow Diagram requires practice and a disciplined approach to system thinking. It is not merely about drawing shapes; it is about understanding the lifecycle of information within an organization. When you can trace a piece of data from its origin to its final destination, you have truly understood the system.
Use this tutorial as a foundation. Practice on real-world scenarios, critique your own diagrams for common mistakes, and always prioritize clarity over complexity. A well-drawn DFD is a silent partner in building robust, reliable software systems.