Moving critical business operations from older infrastructure to modern platforms is a high-stakes endeavor. The complexity often lies not just in the code, but in the hidden logic that dictates how information moves through the system. Data Flow Diagrams (DFDs) serve as the architectural blueprint for this transition. They provide a visual representation of how data enters, processes, and exits a system, making them indispensable during the analysis and migration phases.
When dealing with legacy environments, documentation is frequently incomplete or non-existent. In these scenarios, reverse engineering becomes necessary to reconstruct the data pathways. This guide details the application of DFDs to ensure a structured, transparent, and successful migration strategy. We will explore the technical layers, the mapping processes, and the validation steps required to maintain data integrity throughout the lifecycle.
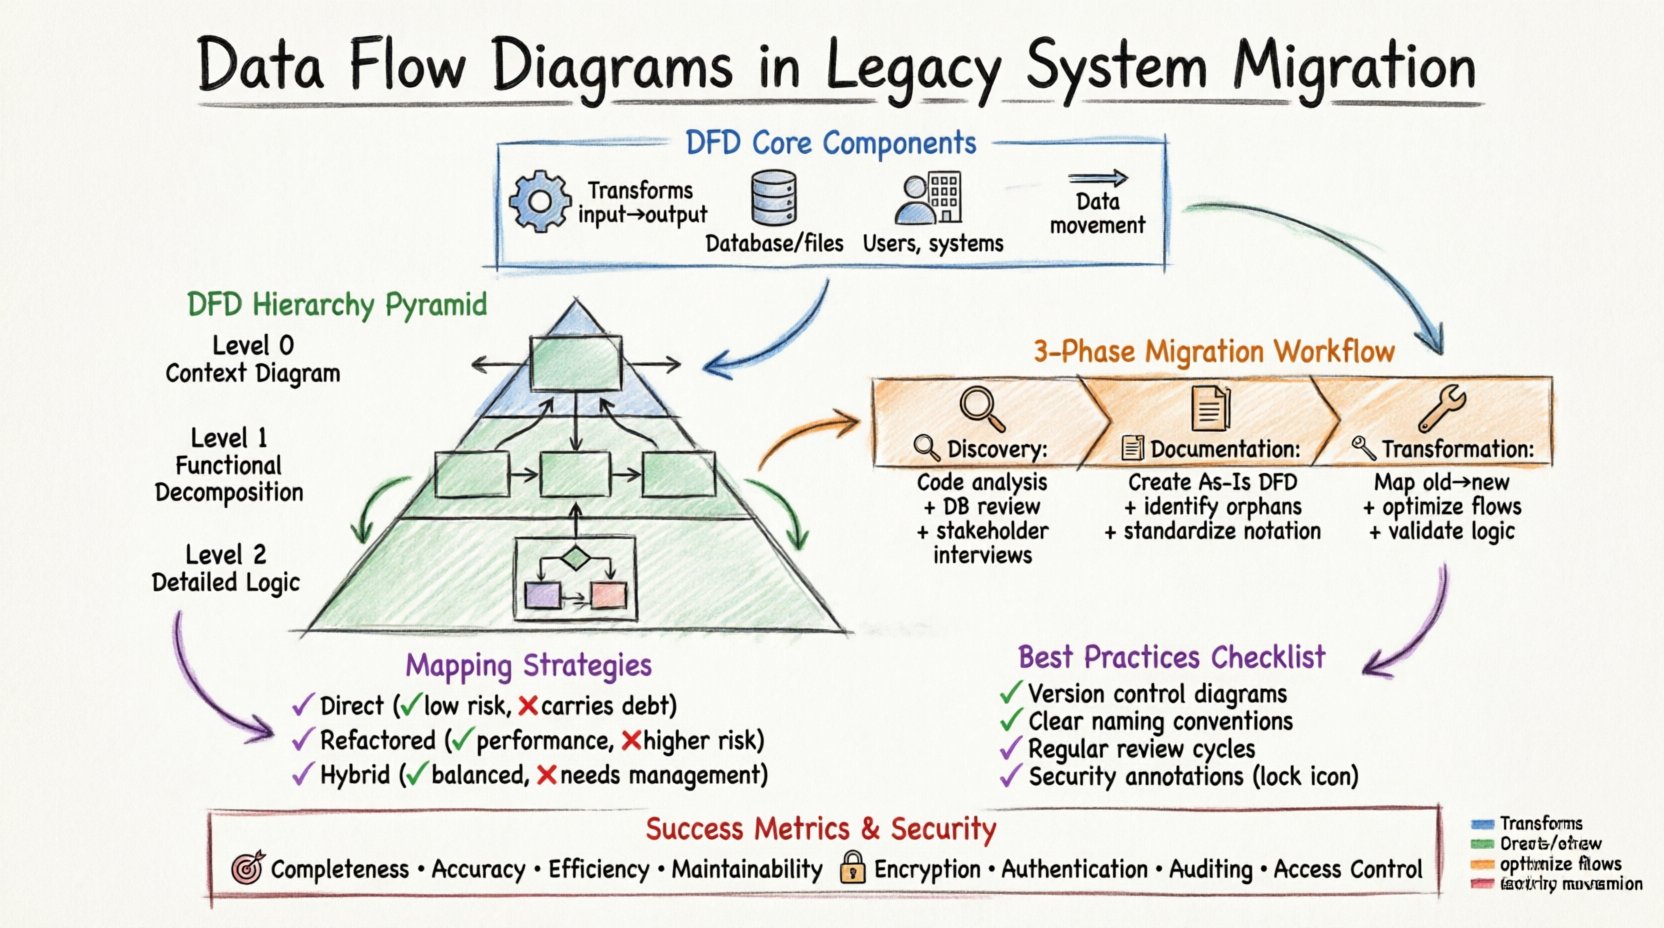
🧩 Understanding Data Flow Diagrams in This Context
A Data Flow Diagram is a graphical representation of the flow of data through an information system. Unlike flowcharts, which focus on control flow and logic decisions, DFDs emphasize the movement of data. In the context of migrating a legacy system, these diagrams help architects and developers understand the dependencies between different modules and external systems.
The core components of a DFD remain consistent regardless of the technology stack:
- Process: A transformation of input data into output data. In legacy systems, this often represents a stored procedure, a batch job, or a business rule embedded in the code.
- Data Store: A repository where data is saved for later retrieval. This could be a relational database, a flat file, or a mainframe sequential file.
- External Entity: A source or destination outside the system boundary. This includes users, other applications, or regulatory bodies.
- Data Flow: The movement of data between processes, stores, and entities. This represents the actual data packets or records being transferred.
When analyzing a legacy environment, identifying these components allows the team to map the current state accurately. This “As-Is” model is the foundation for designing the “To-Be” architecture.
📉 The Hierarchy of DFD Levels
To manage complexity, DFDs are typically created at different levels of abstraction. Each level provides a different granularity of detail. During a migration project, moving through these levels systematically ensures that no critical data path is overlooked.
1. Context Diagram (Level 0)
The Context Diagram provides the highest level of abstraction. It shows the entire system as a single process and its interactions with external entities. For migration purposes, this diagram answers the question: “What data enters the system, and what leaves it?”
- Scope: Defines the boundary of the legacy application.
- Inputs: Identifies all external triggers or data feeds.
- Outputs: Identifies all reports, messages, or state changes sent out.
2. Level 0 Diagram (Functional Decomposition)
This level breaks the single process of the context diagram into major sub-processes. It reveals the major functional areas of the legacy system. For example, a financial system might be broken down into “Order Processing,” “Billing,” and “Inventory Management.”
- Clarity: Helps stakeholders understand the major functional blocks.
- Decomposition: Prepares the ground for further breakdown in Level 1.
- Dependencies: Shows how high-level functions interact with each other.
3. Level 1 and Level 2 Diagrams (Detailed Logic)
These diagrams delve into the specific logic within the major sub-processes. They are essential for developers who need to understand exactly how data is transformed. This level is critical when migrating complex business logic.
- Granularity: Details specific calculations, validations, and routing logic.
- Data Stores: Identifies exactly which tables or files are read or written.
- Logic Flow: Maps out decision points within the data transformation.
🔄 The Migration Workflow Using DFDs
Integrating DFDs into the migration process involves a structured approach. This workflow ensures that the new system mirrors the functional capabilities of the old one while improving performance and maintainability.
Phase 1: Discovery and Reverse Engineering 🔍
The first step is to uncover the existing system behavior. Since legacy documentation is often outdated, the team must analyze the code and database schemas to infer the data flows.
- Code Analysis: Review source code to identify where data is read and written.
- Database Schema Review: Map tables to data stores in the diagram.
- Log Analysis: Examine system logs to identify external interactions and data triggers.
- Stakeholder Interviews: Confirm assumptions with long-term users of the system.
Phase 2: Documentation and Abstraction 📝
Once the data paths are identified, they must be documented formally. This creates a single source of truth for the migration team.
- Create the As-Is DFD: Document the current state accurately.
- Identify Orphans: Find data flows that have no active users or destinations.
- Highlight Risks: Mark areas where data integrity is at risk during transfer.
- Standardize Notation: Ensure the entire team uses the same symbols and conventions.
Phase 3: Gap Analysis and Transformation 🛠️
With the “As-Is” diagram complete, the team designs the “To-Be” architecture. This phase involves comparing the old flows against the requirements of the new system.
- Map Old to New: Define how each legacy process translates to the new platform.
- Optimize Flows: Eliminate unnecessary steps or redundant data stores.
- Define Interfaces: Specify how new services will communicate with external entities.
- Validate Logic: Ensure business rules remain consistent across the migration.
⚠️ Common Challenges in Legacy DFDs
Working with legacy systems presents unique difficulties. The diagrams may not match the code, or the code may not match the business reality. Recognizing these challenges early prevents costly errors.
| Challenge | Impact on Migration | Mitigation Strategy |
|---|---|---|
| Shadow Systems | Manual spreadsheets or side tools used to bypass the main system. | Interview users to find unofficial data sources. |
| Hardcoded Logic | Business rules embedded in code rather than configuration. | Trace code execution paths to extract logic. |
| Data Silos | Data scattered across multiple incompatible formats. | Create a unified data model before mapping. |
| Incomplete Documentation | Missing diagrams or outdated descriptions. | Perform reverse engineering to rebuild documentation. |
| Technical Debt | Legacy structures that are inefficient or unstable. | Refactor during migration rather than lift-and-shift. |
🗺️ Mapping Strategies: From Legacy to Modern
Translating a legacy DFD to a modern architecture requires specific mapping strategies. The goal is to preserve data fidelity while adapting to new architectural patterns.
Direct Mapping (Lift and Shift)
This approach attempts to replicate the existing DFD structure as closely as possible in the new environment. It is useful when the business logic is complex and changing it introduces risk.
- Pros: Low risk of functional regression; familiar to users.
- Cons: Does not leverage new technology benefits; carries over legacy inefficiencies.
Refactored Mapping
This approach analyzes the DFD to identify inefficiencies. Processes are reorganized, and data stores are redesigned for the new platform.
- Pros: Improves performance and scalability; removes technical debt.
- Cons: Higher risk; requires extensive testing and validation.
Hybrid Mapping
A combination of both. Core critical flows are preserved, while non-critical or peripheral flows are modernized.
- Pros: Balances risk and innovation.
- Cons: Requires careful change management.
✅ Best Practices for Documentation
Creating DFDs is only half the battle. Maintaining them throughout the project lifecycle is crucial for team alignment.
- Version Control: Treat diagrams as code. Store them in a repository to track changes over time.
- Naming Conventions: Use clear, descriptive names for all processes and data stores.
- Consistency: Ensure that symbols and notation remain consistent across all diagrams.
- Accessibility: Make diagrams available to all stakeholders, not just technical staff.
- Review Cycles: Schedule regular reviews to update diagrams as requirements evolve.
🧪 Validation and Testing
The final phase of using DFDs in migration is validation. The new system must produce the same outputs for the same inputs as the legacy system.
Data Walkthroughs
Conduct walkthroughs where the team traces a specific data flow through the new system and compares it to the DFD.
- Verify Inputs: Ensure all data entering the process is captured correctly.
- Verify Outputs: Ensure all data leaving the process matches expectations.
- Verify Stores: Ensure data is persisted in the correct format.
Automated Comparison
Use tools to compare the output of the legacy system and the new system for identical test cases.
- Regression Testing: Run historical test cases to ensure no functionality is lost.
- Delta Analysis: Identify any differences in data volume or format.
- Performance Benchmarking: Ensure the new data flows are faster than the old ones.
🔗 Integrating with Other Artifacts
DFDs do not exist in isolation. They must be integrated with other documentation artifacts to provide a complete picture.
- Data Dictionary: Define the structure and meaning of data elements referenced in the DFD.
- Interface Control Documents: Specify the technical details of external integrations shown in the diagram.
- Business Process Models: Align the DFD with the high-level business processes to ensure alignment.
- Security Policies: Ensure data flows comply with security requirements, especially for sensitive information.
📈 Measuring Success
How do you know the migration was successful? The DFD serves as a benchmark for measuring outcomes.
- Completeness: Did we capture all data flows identified in the legacy system?
- Accuracy: Do the new data flows match the intended business logic?
- Efficiency: Have we reduced the number of hops or data stores where appropriate?
- Maintainability: Is the new diagram easier to read and update than the old one?
🛡️ Security Considerations in DFDs
Security must be woven into the DFD design. Every data flow represents a potential point of vulnerability.
- Encryption: Mark data flows that require encryption in transit or at rest.
- Authentication: Identify which entities require authentication before accessing data.
- Auditing: Determine which flows need to be logged for compliance purposes.
- Access Control: Define who can read or write to specific data stores.
🤝 Collaboration and Communication
DFDs are a communication tool. They bridge the gap between business stakeholders and technical teams.
- Visual Language: Stakeholders can understand the flow without reading code.
- Shared Understanding: Reduces ambiguity about how data moves.
- Feedback Loop: Allows stakeholders to validate the model before coding begins.
🔮 Future-Proofing the Diagrams
Legacy systems are often replaced, but the data flows may evolve. Design the DFD process to accommodate future changes.
- Modularity: Design processes to be independent where possible.
- Scalability: Plan for increased data volume in the new flows.
- Flexibility: Allow for new data stores or external entities without breaking the model.
📝 Final Thoughts on Implementation
The migration of a legacy system is a journey of discovery. Data Flow Diagrams provide the map for this journey. By systematically analyzing the As-Is state, planning the To-Be state, and validating the transition, organizations can minimize risk and maximize value.
Remember that a diagram is a living document. It should evolve as the system evolves. Investing time in accurate documentation pays dividends in reduced bugs, clearer communication, and a smoother transition. The goal is not just to move data, but to move understanding.