In the complex landscape of modern enterprise architecture, clarity is currency. Systems grow in size and intricacy, often leading to opaque logic and disconnected modules. This is where the Data Flow Diagram (DFD) serves as a foundational tool. Unlike static architectural blueprints, DFDs map the movement of information across a system, highlighting where data enters, how it transforms, and where it exits. For enterprise system design, understanding this flow is critical to maintaining integrity, compliance, and scalability.
Enterprise environments demand precision. A single misinterpreted data path can lead to significant financial discrepancies or security vulnerabilities. By visualizing the logical movement of data rather than the physical hardware, stakeholders can align on processes before writing a single line of code. This guide details the anatomy, levels, and strategic application of Data Flow Diagrams in large-scale system design.
🧩 The Anatomy of a Data Flow Diagram
At its core, a DFD is a graphical representation of the flow of data. It does not show time or control logic but focuses on the transformation of data. To design effective diagrams for enterprise systems, one must understand the four fundamental components. Every element serves a specific purpose in defining the system boundary and internal logic.
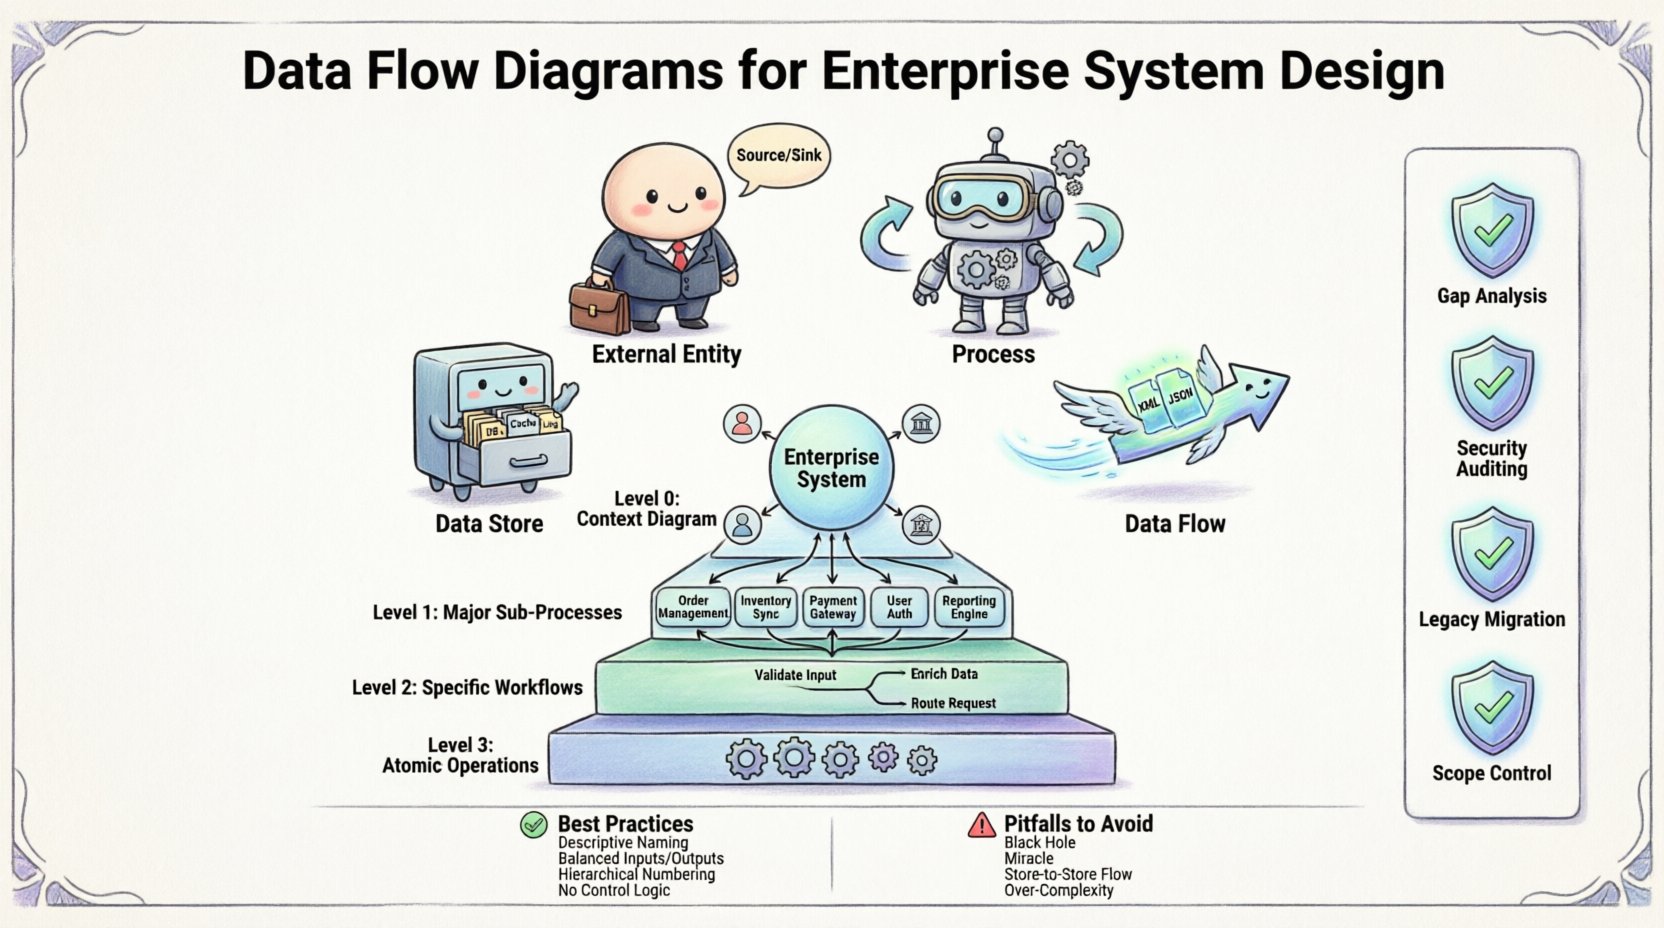
- External Entities: These are the sources or destinations of data outside the system boundary. In an enterprise context, these are often users, departments, or external organizations. They initiate transactions or receive reports but do not change the data.
- Processes: These represent actions that transform data. A process takes input, performs a calculation or logic check, and produces output. In enterprise design, processes are often broken down into sub-processes to manage complexity.
- Data Stores: These are repositories where data is held for future use. They include databases, files, or manual record-keeping systems. A key rule is that data must always flow into or out of a store; it cannot simply appear or vanish.
- Data Flows: These are the arrows connecting the components. They represent the movement of information. Each flow must be labeled to indicate exactly what data is being transmitted.
Understanding the distinction between these components prevents common modeling errors. For instance, confusing a data store with a process is a frequent mistake. A store holds data; a process changes it. In enterprise design, maintaining this distinction ensures that data integrity rules are visually enforced.
📈 Levels of Abstraction in DFDs
Enterprise systems are too complex to be captured in a single diagram. Therefore, DFDs utilize a technique called decomposition. This breaks the system down into manageable layers, starting from a high-level overview and drilling down into specific details. This hierarchical approach allows different stakeholders to view the system at the appropriate level of granularity.
Below is a breakdown of the standard DFD levels:
| Level | Common Name | Focus | Best For |
|---|---|---|---|
| 0 | Context Diagram | System Overview | Stakeholder Alignment |
| 1 | Level 1 DFD | Major Sub-Processes | Architectural Review |
| 2 | Level 2 DFD | Specific Workflows | Functional Design |
| 3 | Level 3 DFD | Atomic Operations | Implementation Details |
Context Diagram (Level 0)
The Context Diagram is the entry point. It depicts the entire system as a single process bubble. This diagram defines the system boundary clearly. It shows only the external entities and the major data flows crossing the boundary. This is the primary tool for communicating with non-technical stakeholders, such as business executives or clients.
- Shows the system as one central process.
- Identifies all external sources and sinks.
- Defines the scope of the project immediately.
- Ensures no external data source is overlooked.
Level 1 DFD
Once the context is established, the central process is exploded into major sub-processes. A Level 1 DFD typically contains between 5 and 9 processes. This level of detail is sufficient for system architects to understand the major functional areas. It ensures that the decomposition is balanced and logical.
- Expands the single process from Level 0.
- Introduces internal data stores.
- Connects processes with data flows.
- Must match all inputs and outputs from Level 0.
Level 2 and Level 3 DFDs
For enterprise systems requiring high precision, further decomposition is necessary. Level 2 diagrams break down specific processes from Level 1. Level 3 diagrams may be used for complex calculations or regulatory compliance workflows. While deeper levels provide clarity, they also increase maintenance overhead. It is crucial to stop decomposing when the processes become atomic enough for developers to implement directly.
🛡️ Strategic Benefits in Enterprise Design
Why invest time in creating these diagrams before development begins? The answer lies in risk mitigation and communication efficiency. Enterprise systems involve multiple teams, legacy integrations, and strict compliance requirements. DFDs provide a shared language that bridges these gaps.
- Gap Analysis: Visualizing flows often reveals missing data sources. You might discover that a specific report requires data that no current system generates.
- Security Auditing: By mapping where sensitive data travels, security teams can identify potential exposure points. If data flows from an unencrypted source to a public endpoint, the diagram highlights the risk immediately.
- Legacy Migration: When modernizing old systems, DFDs help map current behaviors to new architectures. They serve as a baseline for what must be preserved during migration.
- Scope Control: DFDs prevent scope creep. If a new feature is proposed, it must be added to the diagram. If it breaks the flow balance, it signals a design flaw before implementation.
📝 Best Practices for Diagramming
Creating a DFD is an art as much as a science. Without discipline, diagrams become cluttered and lose their value. Adhering to established conventions ensures that the diagrams remain readable and useful over the lifecycle of the project.
Consistent Naming Conventions
Names should be descriptive and consistent. A process named “Process 1” is useless. A process named “Validate User Credentials” is clear. For data flows, use the format [Noun Phrase], such as “Customer Order” or “Payment Details”. Avoid abbreviations that are not standard across the organization.
Balancing Inputs and Outputs
This is a fundamental rule of DFD design. Every process must have at least one input and one output. A process cannot create data out of nothing, nor can it delete data without a destination. Furthermore, the inputs and outputs of a parent process must match the sum of the inputs and outputs of its child processes. This is known as “balancing”.
Numbering Systems
A robust numbering system helps track decomposition. For example, Process 1.0 breaks down into 1.1, 1.2, and 1.3. If 1.2 is decomposed further, it becomes 1.2.1. This hierarchy allows developers to navigate the diagrams easily and link them to code modules or database schemas.
Avoiding Control Logic
DFDs are not flowcharts. They should not contain decision diamonds or loops. Control logic belongs in flowcharts or state diagrams. In a DFD, if a process is conditional, represent the different paths as separate data flows or separate processes. Mixing control logic with data flow confuses the reader about whether they are looking at data movement or decision making.
⚠️ Common Pitfalls to Avoid
Even experienced architects make mistakes when modeling complex systems. Being aware of these common errors can save significant time during the design review phase.
- The Black Hole: This occurs when a process has inputs but no outputs. The data disappears. In reality, this indicates a missing output flow or a failure to store the data.
- The Miracle: The opposite of a black hole. A process has outputs but no inputs. Data cannot be generated without a source. This usually means a missing input flow from a data store or entity.
- Data Flow to Data Store: Arrows must go between a process and a store. Arrows between two stores or two processes without a transformation are often incorrect. A store does not move data; a process moves data.
- Over-Complexity: Trying to fit everything into one Level 1 diagram. If a diagram has more than 10 processes, it is likely too dense. Decompose further to maintain readability.
🔄 Maintenance and Evolution
A DFD is not a one-time deliverable. It is a living document that must evolve with the system. Enterprise requirements change, new compliance laws are enacted, and integrations are added. If the diagrams are not updated, they become misleading artifacts that cause more harm than good.
- Version Control: Treat diagrams like code. Store them in a repository where changes are tracked. Maintain a changelog that notes which diagram was updated and why.
- Sync with Code: During code reviews, verify that the implementation matches the DFD. If the code deviates, update the diagram. This keeps the documentation accurate.
- Stakeholder Reviews: Schedule periodic reviews with business owners. Ask them if the flows still represent their business reality. This ensures the model remains relevant.
- Integration Points: When adding third-party APIs, update the External Entity section of the diagram. Ensure the new data flows are documented with the same rigor as internal processes.
🔗 Integration with Other Models
While DFDs are powerful, they are not the only tool in the design toolkit. They work best when integrated with other modeling techniques to provide a complete picture of the system.
- Entity Relationship Diagrams (ERD): ERDs define the structure of data stores. DFDs define how that data moves. Using them together ensures that the data being moved actually exists in the database schema.
- Use Case Diagrams: Use Cases describe user interactions. DFDs describe the backend processing of those interactions. Mapping Use Cases to DFD processes helps trace user actions to system logic.
- Sequence Diagrams: Sequence Diagrams show timing and order. DFDs show structure and flow. Use Sequence Diagrams for complex transactional logic, and DFDs for high-level architectural views.
🎯 Final Considerations
Designing enterprise systems requires a balance between abstraction and detail. Data Flow Diagrams provide the necessary bridge between business requirements and technical implementation. By adhering to the principles of decomposition, balancing, and clear naming, teams can create blueprints that are robust and maintainable.
The investment in creating these diagrams pays dividends in reduced rework and clearer communication. When the data flow is understood, the system is built on solid ground. As you move forward with your next enterprise project, prioritize the visual mapping of your data. It is the skeleton upon which the rest of the system relies.
Remember that the goal is not to create art, but to create clarity. A simple, accurate diagram is worth more than a complex, confusing masterpiece. Keep the focus on the movement of information, and the architecture will follow.