In the evolving landscape of information technology, the Data Flow Diagram (DFD) remains a foundational artifact for system analysis. While originally conceived during the structured programming era of the 1970s, the utility of visualizing how data moves through a system has not diminished. Instead, it has transformed. As organizations grapple with machine learning models, distributed storage systems, and real-time processing streams, the need to map data trajectories has become more critical than ever.
This guide explores the adaptation of DFDs to modern computational environments. It examines how traditional diagrams must evolve to represent artificial intelligence workflows, big data architectures, and cloud-native infrastructures without relying on specific vendor tools. The focus remains on the conceptual integrity of data movement, security, and transformation.
🏛️ The Foundation: Understanding Data Flow Diagrams
Before addressing modern complexities, it is essential to establish the baseline definition. A Data Flow Diagram is a graphical representation of the flow of data through an information system. It models the movement of information from external sources to destinations and internal processes.
Key components define a standard DFD:
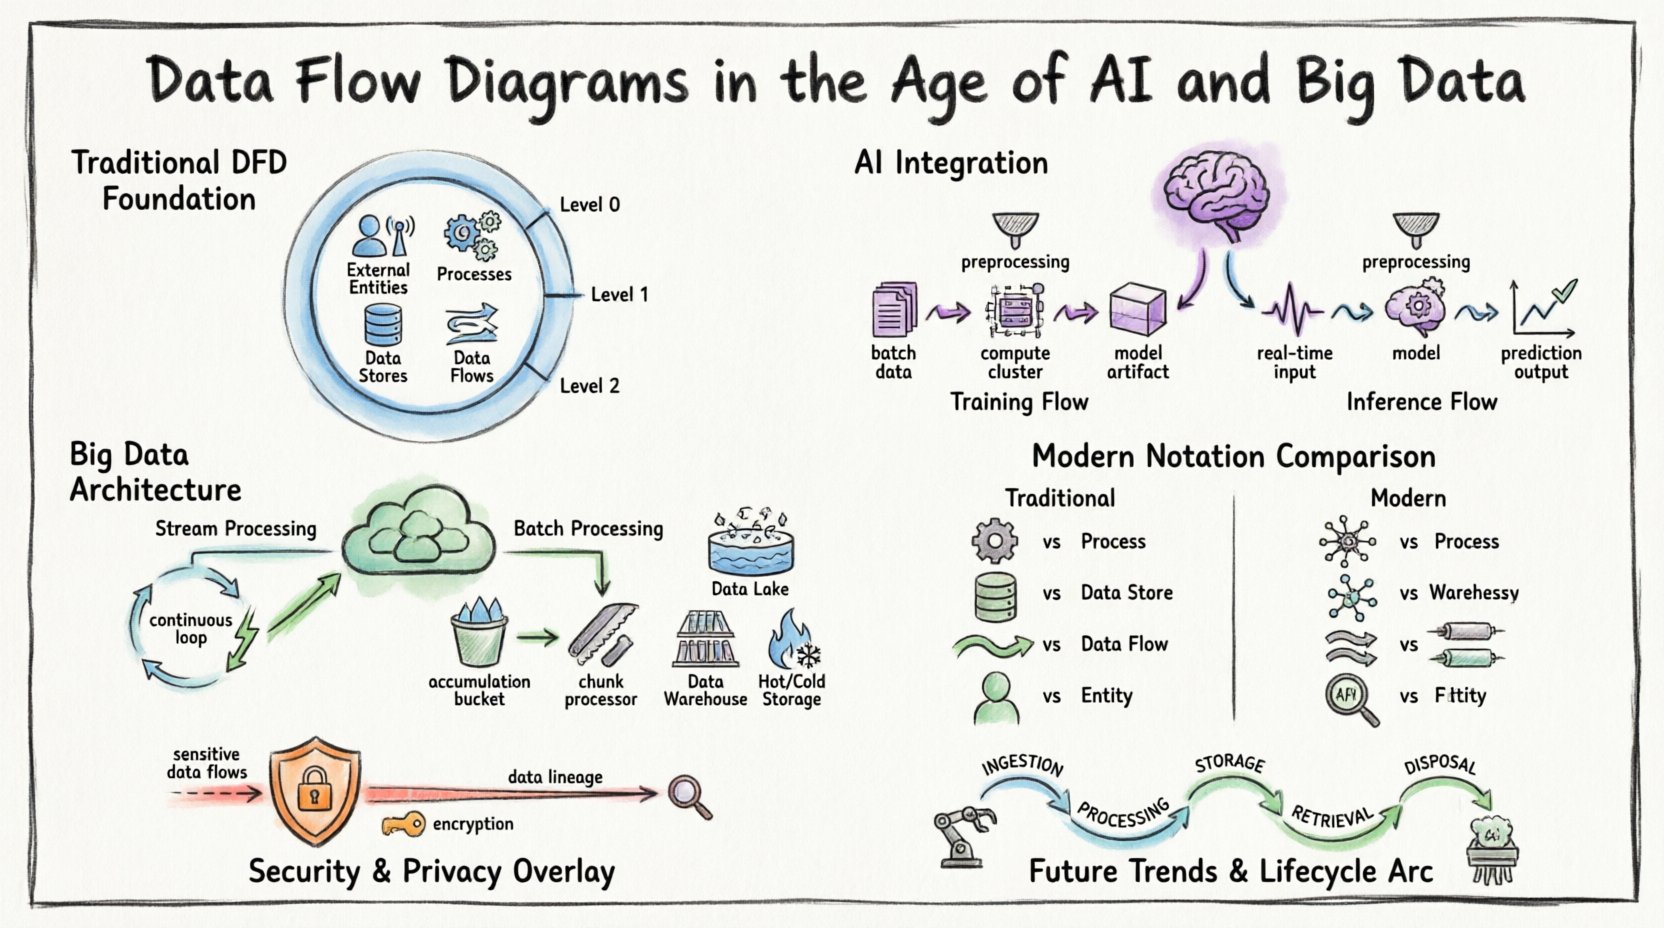
- External Entities: Sources or destinations outside the system boundary (e.g., users, other systems, sensors).
- Processes: Transformations that change input data into output data.
- Data Stores: Repositories where data is held for later use (e.g., databases, file systems).
- Data Flows: The movement of data between entities, processes, and stores.
In traditional contexts, these diagrams were often drawn at multiple levels of abstraction:
- Context Diagram (Level 0): Shows the system as a single process and its interactions with external entities.
- Level 1 Diagram: Decomposes the main process into major sub-processes.
- Level 2 Diagram: Further decomposes specific sub-processes for granular detail.
While this hierarchy remains valid, the nature of the “process” has changed. A process is no longer just a batch job; it is often a continuous service or a predictive model.
🧠 AI Integration: Modeling Intelligence in Flows
The integration of Artificial Intelligence (AI) introduces new variables into data flow mapping. In traditional systems, logic is explicit. In AI-driven systems, logic is often probabilistic. This distinction requires a shift in how we visualize the “Process” component of a DFD.
1. Training vs. Inference Flows
Machine learning pipelines differ significantly from standard application logic. A DFD for an AI system must distinguish between the training phase and the inference phase.
- Training Flow: Involves large datasets moving from storage to computation clusters. The output is a trained model artifact. This flow is often batch-oriented and resource-intensive.
- Inference Flow: Involves real-time or near-real-time data entering the model to generate predictions. This flow prioritizes low latency and high throughput.
When mapping these flows, it is crucial to note that the model itself acts as a black box process. The internal logic is hidden, but the input requirements and output formats must be clearly defined in the diagram.
2. Data Preprocessing as a Process
Before data reaches an AI model, it undergoes significant transformation. Feature engineering, normalization, and cleaning are critical steps that must be visible in the DFD. Ignoring these steps leads to incomplete system understanding.
- Normalization: Scaling data to fit model expectations.
- Encoding: Converting categorical data into numerical vectors.
- Imputation: Handling missing values within the flow.
These preprocessing steps are processes. They consume time and computational resources, and they introduce potential points of failure that must be tracked in the data flow.
🌊 Big Data: Handling Volume, Velocity, and Variety
Big data architectures challenge the linear nature of traditional DFDs. Data often arrives in streams, sits in data lakes, and is processed via distributed computing. A static diagram cannot easily capture the dynamic nature of these environments.
1. Streaming vs. Batch Processing
Modern systems often employ a hybrid approach. Some data is processed in real-time streams, while other data is aggregated for batch analysis. The DFD must clearly demarcate these two paths.
- Stream Processing: Data flows continuously. The diagram should represent the pipeline as a continuous loop rather than a start-and-stop sequence.
- Batch Processing: Data accumulates over time and is processed in chunks. The diagram should reflect the accumulation point (Data Store) before the process begins.
2. Distributed Storage Visualization
In a monolithic database, a data store is a single box. In a big data environment, storage is distributed. The DFD should indicate that a “Data Store” may actually represent a cluster of nodes or a partitioned storage system.
- Data Lakes: Raw data storage where structure is applied later.
- Data Warehouses: Structured storage optimized for querying.
- Hot vs. Cold Storage: Differentiating between frequently accessed data and archival data.
This distinction is vital for understanding latency. A flow from a hot storage node will behave differently than a flow from a cold storage archive.
📐 Modernizing the Notation
To effectively communicate complex systems, the notation used in DFDs must adapt. While the core symbols remain similar, their application requires nuance.
| Component | Traditional DFD | Modern AI/Big Data DFD |
|---|---|---|
| Process | Single transformation step | Microservice, Model Inference, or Pipeline Stage |
| Data Store | File or Database Table | Data Lake, Distributed Cache, or Object Store |
| Data Flow | Request/Response or File Transfer | Event Stream, API Payload, or Message Queue |
| Entity | Human User or Legacy System | IoT Device, Third-party API, or Autonomous Agent |
1. Event-Driven Architecture
Many modern systems rely on events rather than direct requests. A DFD for an event-driven system uses triggers to initiate processes. Instead of a process waiting for data, the data arrival triggers the process.
- Message Queues: Act as buffers between producers and consumers.
- Event Logs: Immutable records of state changes that serve as data stores for auditing.
Visualizing these queues as data stores helps clarify backpressure issues. If a process cannot keep up with the inflow, the queue grows. This risk must be mapped.
2. Microservices and Boundaries
As systems break into microservices, the system boundary in a DFD becomes more porous. Data flows often cross service boundaries via APIs. It is important to label the protocol used (e.g., REST, gRPC, GraphQL) on the data flow lines to indicate compatibility requirements.
- Service Discovery: Dynamic routing of data flows.
- Load Balancing: Distribution of data flows across multiple instances.
🔒 Security and Privacy in Data Flows
Security cannot be an afterthought in a data flow diagram. With regulations like GDPR and CCPA, understanding where sensitive data resides and moves is mandatory.
1. Identifying Sensitive Data
Data flows carrying Personally Identifiable Information (PII) or Protected Health Information (PHI) must be highlighted. Use distinct line styles or colors to denote sensitive flows.
- Encryption in Transit: All flows crossing network boundaries should indicate encryption protocols (e.g., TLS).
- Encryption at Rest: Data stores containing sensitive data must be marked.
2. Data Lineage
Understanding the origin of data is critical for compliance. A DFD serves as a high-level lineage map. It shows where data enters the system and how it transforms.
- Consent Tracking: Flows involving user consent data must be tracked separately.
- Right to Erasure: Diagrams must show where data is stored to facilitate deletion requests.
If a DFD does not show where data is stored, compliance audits become impossible. Every data store must have a defined owner and retention policy.
⚙️ Challenges in Modern DFD Creation
Creating accurate diagrams for complex systems presents specific hurdles. The volume of data and the speed of change often outpace documentation efforts.
1. Dynamic Systems
Auto-scaling groups change the number of process instances dynamically. A static diagram cannot show this. The diagram must represent the *capability* of the system, not just the current state.
- Use generic labels like “Compute Cluster” rather than specific instance IDs.
- Indicate scaling triggers in the process description.
2. Complexity Management
As systems grow, DFDs become unreadable. Abstraction is key. Do not map every API endpoint. Map the logical data movement.
- Grouping: Combine related processes into a single super-process.
- Linking: Use cross-references to link detailed sub-diagrams to high-level overviews.
3. Real-Time Dependencies
In streaming systems, the order of operations matters. A DFD shows connectivity, but not always timing. Supplement DFDs with sequence diagrams if timing is critical.
- Indicate timeouts and retries in the process descriptions.
- Note if data flows are synchronous or asynchronous.
🚀 Future Trends: Automation and Self-Documentation
The future of DFDs lies in automation. As systems become more code-centric, diagrams should be generated from the codebase rather than drawn manually.
1. Infrastructure as Code (IaC)
When infrastructure is defined in code, the data flow is implicitly defined. Tools can parse IaC files to generate DFDs automatically.
- Ensure consistency between the diagram and the actual infrastructure.
- Use version control for the diagram definitions themselves.
2. Continuous Discovery
Network monitoring tools can detect actual data flows. Integrating these tools with DFD software allows for “live” diagrams that update as traffic patterns change.
- Alert when new data flows appear that were not documented.
- Flag unused data stores that can be decommissioned.
3. AI-Assisted Diagramming
Artificial Intelligence can suggest improvements to diagrams. It can identify bottlenecks, redundant paths, or security gaps based on best practices.
- Automated validation of data flow rules (e.g., no direct flow from database to external entity without a process).
- Suggestion of optimal process decomposition.
🛠️ Best Practices for Implementation
To maintain the value of DFDs in a modern context, adhere to the following practices.
- Standardize Notation: Ensure all team members use the same symbols and conventions. Consistency reduces cognitive load.
- Define Naming Conventions: Processes should be named with Verb-Noun structures (e.g., “Validate User Input”). Data stores should be named as Nouns (e.g., “User Profiles”).
- Review Regularly: A diagram that is not reviewed becomes a lie. Schedule reviews during sprint planning or architecture refinement meetings.
- Focus on Value: Only map data flows that are necessary for the business logic. Remove redundant internal flows that do not impact the end-user.
- Document Assumptions: If a flow assumes a certain latency or throughput, document it. These assumptions affect system design.
🔄 The Lifecycle of a Data Flow
Understanding the lifecycle helps in mapping the diagram accurately. Data moves through several stages:
- Ingestion: Data enters the system boundary. This is often the most volatile point.
- Processing: Data is transformed, enriched, or analyzed.
- Storage: Data is persisted for future use.
- Retrieval: Data is accessed for reporting or action.
- Disposal: Data is archived or deleted according to policy.
Each stage represents a potential process or store in the DFD. A complete diagram accounts for the disposal phase, ensuring data does not linger unnecessarily.
📊 Summary of Key Components
For quick reference, here is a breakdown of how traditional components map to modern equivalents.
| Traditional Concept | Modern Equivalent | Consideration |
|---|---|---|
| Input | API Gateway / Ingestion Pipeline | Authentication and Rate Limiting |
| Output | Dashboard / Notification Service | Formatting and Delivery Channel |
| Process | Function / Container / Model | Statelessness and Scaling |
| Store | Object Store / NoSQL DB | Partitioning and Indexing |
| Flow | Event Message / HTTP Request | Latency and Reliability |
By aligning these concepts, teams can create diagrams that serve as effective communication tools across engineering, data science, and business stakeholders. The goal is not perfection, but clarity. A diagram that aids in decision-making is successful.
🔮 Final Thoughts on Data Flow Visualization
The principles of Data Flow Diagrams are timeless, but their application requires adaptation. As data becomes the core asset of modern enterprises, the ability to visualize its movement is a strategic advantage. Whether managing a simple database or a complex neural network pipeline, the DFD provides the necessary structure to understand, secure, and optimize the flow of information.
Staying current with these methodologies ensures that system architectures remain transparent and maintainable. The shift from static documentation to dynamic, automated visualization is inevitable. Teams that embrace this shift will find themselves better equipped to handle the complexities of the digital age.
Focus on the data. Follow the flow. Ensure the logic holds. This remains the core mandate of effective system design.