In the landscape of system analysis and software architecture, clarity is currency. A Data Flow Diagram (DFD) serves as the visual contract between technical teams and stakeholders, mapping how information moves through a system. However, many diagrams created today become obsolete within months, leading to technical debt and confusion. For long-term projects, the goal is not just to document the current state, but to create a living artifact that remains accurate and useful as the system evolves.
This guide outlines the principles for constructing DFDs that stand the test of time. We will explore structural integrity, naming standards, visual discipline, and maintenance protocols. By adhering to these practices, teams ensure that their documentation supports rather than hinders development.
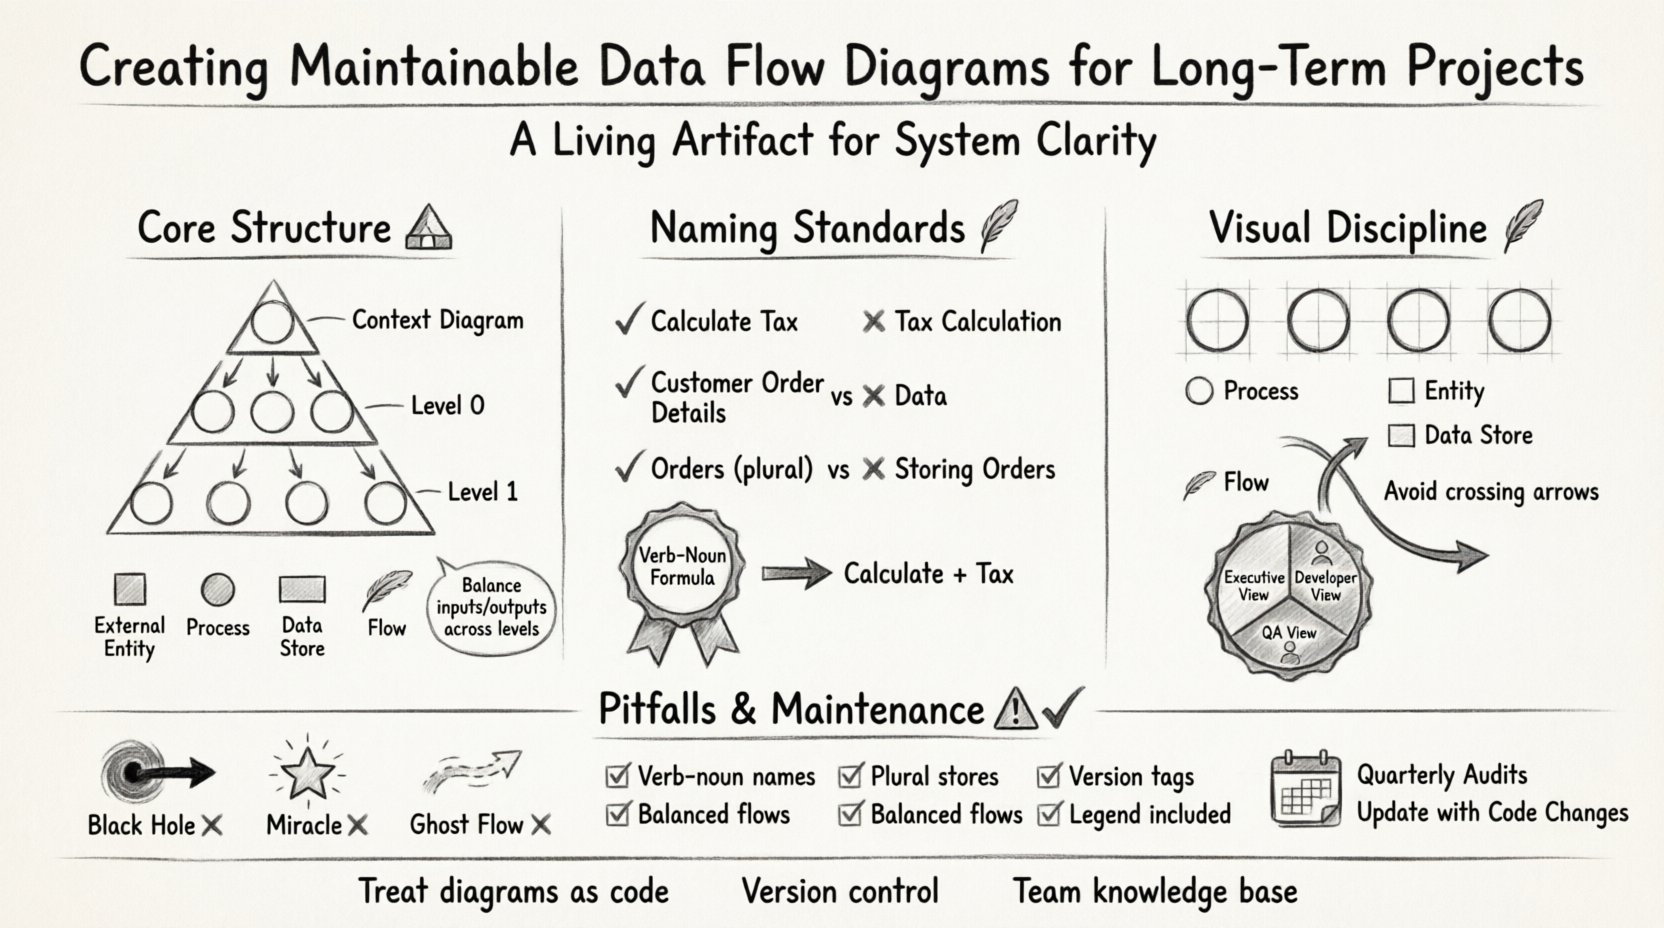
Understanding the Core Structure 🏗️
A robust DFD relies on a hierarchical approach. Starting from a high-level overview and drilling down into specific processes allows for manageable complexity. This structure ensures that the diagram remains readable without sacrificing detail.
The Context Diagram: The Big Picture
The context diagram is the starting point. It represents the entire system as a single process bubble interacting with external entities. Its primary purpose is to define the boundaries of the system.
External Entities: Represent users, organizations, or other systems that interact with your system. They exist outside the boundary.
Single Process: The entire system is shown as one bubble.
Data Flows: Arrows showing input and output between entities and the system.
When maintaining this over years, ensure that the boundary does not expand indefinitely. If the system grows significantly, consider splitting the context into sub-systems rather than adding more arrows to a single bubble.
Level 0 and Level 1: Decomposition
Once the context is defined, you must decompose the single process into major sub-processes. This is typically the Level 0 diagram. Level 1 diagrams then break down specific Level 0 processes.
Consistency: The inputs and outputs on a parent diagram must match the inputs and outputs of the child diagram. This is known as balancing.
Granularity: Keep processes at a logical level of detail. If a process is too complex, decompose it further. If it is too simple, merge it with a neighbor.
Reusability: If a sub-process appears in multiple places, maintain a single definition and reference it.
Naming Conventions and Data Accuracy 📝
Labels are the most critical element for readability. Ambiguous names lead to misinterpretation. A maintainable diagram requires strict adherence to naming standards.
Process Naming Rules
Every process bubble must be named with a verb-noun combination. This describes what action is taking place on the data.
Verb First: Always start with an action. Use words like Calculate, Generate, Validate, or Update.
Noun Second: Follow with the object being acted upon. Calculate Tax is better than Tax Calculation.
No Nouns Only: Avoid names like Orders. This implies data storage, not processing.
No Verbs Only: Avoid names like Process. This provides no information about the function.
Data Flow Naming Rules
Arrows represent movement. The label should describe the data packet moving from one point to another.
Specificity: Instead of Data, use Customer Order Details.
State: Indicate if the data is a request, a response, or a report. Order Request vs. Order Confirmation.
Direction: Ensure the arrow direction matches the logical flow of the document or data packet.
Data Store Naming Rules
Data stores represent where information is held. They are distinct from processes.
Plural Nouns: Since a store holds multiple records, names should be plural. Use Orders, Users, Transactions.
No Verbs: A store does not act. Do not name it Storing Orders.
Logical vs. Physical: Use logical names. Database Table 1 is a physical name. Inventory Log is a logical name that remains valid even if the underlying technology changes.
Visual Consistency and Layout 🎨
A diagram that looks chaotic suggests a system that is chaotic. Visual consistency aids in quick comprehension and reduces cognitive load during maintenance.
Alignment and Spacing
Consistent spacing between elements prevents the diagram from appearing cluttered. Use a grid system to align processes vertically and horizontally.
Vertical Alignment: Align processes that share inputs or outputs.
Horizontal Spacing: Maintain equal gaps between major process groups to allow room for labels.
Arrow Routing: Avoid arrows crossing over other arrows whenever possible. If crossing is necessary, use a bridge or clear the path on a separate level.
Color and Shape Semantics
While avoiding CSS styles, you can use standard shapes to denote specific types of objects. Consistency in shape usage helps readers identify elements instantly.
Processes: Circles or rounded rectangles.
Entities: Squares or rectangles.
Stores: Open-ended rectangles or parallel lines.
Flows: Solid lines with arrowheads.
Managing Complexity Through Decomposition 🧩
As projects grow, diagrams can become overwhelming. The strategy is to manage complexity through controlled decomposition and abstraction.
Abstraction Layers
Not every stakeholder needs to see every detail. Create different views of the diagram for different audiences.
Executive View: High-level context and major business processes.
Developer View: Detailed Level 1 and Level 2 diagrams showing specific data transformations.
QA View: Diagrams highlighting data validation points and error handling flows.
Handling Loops and Feedback
Complex systems often have feedback loops. These should be clearly marked to avoid confusion about where the data originates.
Explicit Return Flows: Draw the arrow all the way back to the source if the data returns to an entity.
State Indicators: Label flows with the state of the data, such as Rejected Request or Approved Order.
Termination Points: Ensure every flow has a clear destination. A flow should not end in mid-air.
Documentation and Versioning Strategies 📚
A diagram is only useful if the team knows which version is current. Documentation management is as important as the drawing itself.
Version Control Integration
Diagrams should be treated as code. They belong in the same repository as the application source.
Commit Messages: When updating a diagram, write a commit message explaining the change. Updated Order Process to include validation step.
Tagging: Tag diagrams with version numbers that match the software release (e.g., v1.2.0).
History: Keep previous versions accessible for audit trails.
Linking and Cross-References
Large systems require many diagrams. Linking them prevents duplication and ensures consistency.
Callouts: Use callout boxes to reference specific child diagrams from a parent diagram.
Page Numbers: If exporting to PDF, include page numbers for easy navigation.
Table of Contents: Maintain a master document listing all diagram versions and their locations.
Common Pitfalls and Corrections ⚠️
Even experienced architects make mistakes. Recognizing common errors early prevents long-term maintenance issues.
The Black Hole
A black hole is a process that consumes data but produces no output. This usually indicates a design flaw.
Identification: Check every process bubble. Does every input result in an output?
Correction: If data is discarded, label the output Deleted Record or Error Log.
The Miracle
A miracle is a process that produces output without input. This implies magic or hidden logic.
Identification: Look for processes with only outgoing arrows.
Correction: Ensure all necessary data sources are connected. If the data comes from a hidden source, document it explicitly.
Ghost Flows
A ghost flow is an arrow that does not connect to anything or connects to the wrong object.
Identification: Trace every line from start to finish.
Correction: Remove orphaned arrows or correct the connection points.
Maintenance Checklist ✅
Use the following checklist during every review cycle to ensure diagram integrity.
Check Item | Status | Notes |
|---|---|---|
All processes have a verb-noun name | ||
All stores have plural noun names | ||
Input/Output flows balance across levels | ||
No black holes (inputs without outputs) | ||
No miracles (outputs without inputs) | ||
Version number is current | ||
Legend is included and up-to-date | ||
No overlapping arrows |
Sustaining the Diagram Over Time ⏳
Documentation decay is a natural enemy of software projects. To counter this, integrate diagram maintenance into the standard development workflow.
Change Requests
When a change request is approved, it should include a task to update the DFD. Do not allow code changes to happen without updating the visual representation.
Trigger: Any code change affecting data movement triggers a DFD update.
Review: The diagram update must be reviewed alongside the code review.
Approval: The diagram is not considered complete until it matches the deployed code.
Regular Audits
Schedule periodic audits where the diagram is compared against the live system.
Frequency: Perform a full audit quarterly or per major release.
Team: Involve both architects and developers to ensure technical accuracy and business alignment.
Feedback: Encourage team members to flag outdated diagrams immediately.
Knowledge Sharing
Diagrams should not be locked in a single person’s mind. Ensure the diagram is part of the team’s shared knowledge base.
Onboarding: New developers should review the DFD as part of their training.
Workshops: Use diagrams during sprint planning to visualize data dependencies.
Standards: Document the naming and drawing standards in a style guide for the team.
Conclusion on Longevity
Building a Data Flow Diagram that lasts requires discipline. It is not enough to draw the initial map; the team must commit to keeping it updated. By following these structural, naming, and maintenance guidelines, you create a resource that provides clarity and value throughout the project lifecycle. The effort invested in maintainability pays off in reduced errors, faster onboarding, and clearer communication among stakeholders.
Remember that the diagram is a tool for understanding, not just a requirement for documentation. Treat it with the respect of a primary system asset. When the code changes, the diagram changes. When the business logic evolves, the diagram evolves. This synchronization is the key to long-term project success.