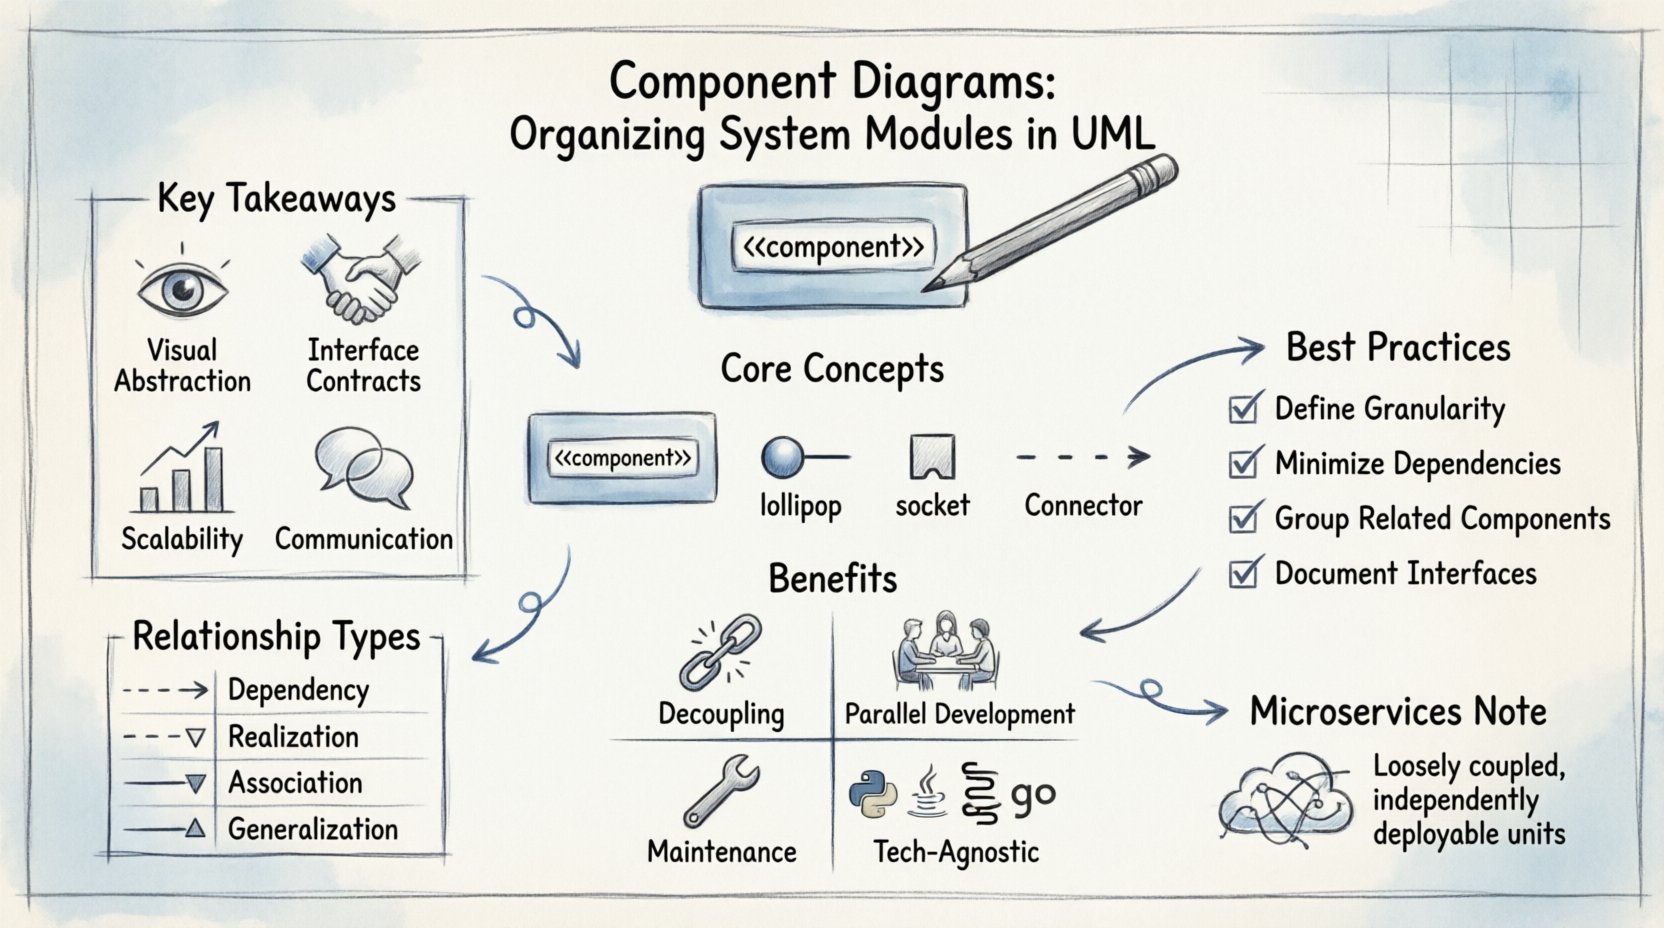
💡 Key Takeaways
- Visual Abstraction: Component diagrams provide a high-level view of system architecture, focusing on logical modules rather than code details.
- Interface Contracts: They define clear boundaries through provided and required interfaces, reducing coupling between modules.
- Scalability: Effective organization allows systems to grow by adding new components without disrupting existing structures.
- Communication: They serve as a universal language for architects and developers to discuss system structure and dependencies.
In the complex landscape of software architecture, clarity is the currency of efficiency. As systems grow in size and complexity, the ability to visualize how different parts interact becomes critical. Component diagrams serve this purpose within the Unified Modeling Language (UML) framework. They act as the blueprint for the structural organization of a system, focusing on modules, their interfaces, and the relationships between them. Unlike class diagrams which dive into implementation details, component diagrams operate at a higher level of abstraction, allowing architects to reason about the system as a collection of deployable units.
This guide explores the mechanics, benefits, and best practices of using component diagrams to organize system modules. By understanding these constructs, technical teams can ensure maintainability, scalability, and clear communication throughout the development lifecycle.
Understanding the Core Concepts 🔍
A component diagram represents the physical and logical components of a system. A component is a modular, replaceable part of a system that encapsulates implementation details. It exposes functionality through interfaces while hiding internal complexity. This encapsulation is fundamental to modern software design principles.
1. Components
A component is essentially a physical or logical unit of software. In a web application, this might be an authentication service, a database layer, or a user interface module. In a legacy system, it could be a specific library or a compiled binary. The defining characteristic of a component is that it can be deployed and replaced independently, provided its interface contracts remain satisfied.
2. Interfaces
Interfaces are the mechanisms through which components interact. They define the operations a component offers to the outside world. In UML, interfaces are often depicted as a circle (lollipop notation) for provided interfaces or a half-circle (socket notation) for required interfaces. This visual distinction helps developers quickly identify what a module needs versus what it offers.
3. Connectors
Connectors represent the relationships between components. They illustrate how data or control flows from one module to another. These can be physical connections in a deployment context or logical associations in a design context. Properly defined connectors ensure that dependencies are explicit and intentional.
Why Organize System Modules? 🧩
The primary goal of a component diagram is to reduce complexity. Without a structured view of the system, codebases can become tangled webs of dependencies. Organizing modules into distinct components offers several tangible benefits:
- Decoupling: By defining clear interfaces, components become loosely coupled. Changes in one module do not necessitate changes in others, as long as the contract is upheld.
- Parallel Development: Different teams can work on different components simultaneously. The diagram serves as the contract defining the boundaries of their work.
- Maintenance: When a bug arises, the diagram helps pinpoint which module is responsible. It simplifies the debugging process by isolating functional areas.
- Technology Agnosticism: Component diagrams focus on logic rather than implementation language. A component can be written in Java, Python, or C++, as long as it adheres to the defined interface.
Structuring the Diagram 📐
Creating an effective component diagram requires a disciplined approach. It is not merely about drawing boxes and lines; it is about defining the architecture of the system. The following sections outline the standard notation and structural considerations.
Notation Standards
UML standardizes the visual representation of components. A component is typically drawn as a rectangle with a stereotype label “<<component>>” at the top. The name of the component is placed prominently within the box. If necessary, a small icon resembling a rectangle with two smaller rectangles on the side is used to denote the component stereotype clearly.
Relationships and Dependencies
Understanding the relationships between components is crucial. The most common relationship is the dependency. This is depicted as a dashed line with an open arrow pointing from the client (the component needing the service) to the supplier (the component providing the service). Other relationships include association and realization.
| Relationship Type | Visual Representation | Meaning |
|---|---|---|
| Dependency | Dashed line with open arrow | One component uses another. |
| Realization | Dashed line with hollow triangle | A component implements an interface. |
| Association | Solid line | A structural link between components. |
| Generalization | Solid line with hollow triangle | One component is a specialized version of another. |
Best Practices for Clarity ✨
To ensure that component diagrams remain useful assets rather than outdated documentation, adhere to the following best practices.
1. Define Granularity Carefully
The size of a component is subjective. If a component is too small, the diagram becomes cluttered with hundreds of boxes. If it is too large, it loses its value as a modular abstraction. A good rule of thumb is to align component boundaries with logical business capabilities or deployment units. If a module can be deployed independently, it is likely a component.
2. Minimize Cross-Module Dependencies
High coupling is the enemy of maintainability. Aim for a structure where components interact primarily through well-defined interfaces. Avoid direct references to internal implementation details of other components. If Component A needs to access data in Component B, it should request it through an interface, not reach into B’s private code.
3. Group Related Components
Use packages or folders to group related components together. This helps in organizing the diagram spatially. For example, all security-related components might reside in a “Security” package. This reduces cognitive load when scanning the diagram.
4. Document Interfaces Explicitly
An interface is a contract. It should be documented with clear operation signatures. If a component provides a “UserManagement” interface, list the methods available (e.g., login(), logout(), createUser()). This ensures that developers using the component know exactly what is available to them.
Common Pitfalls to Avoid ⚠️
Even experienced architects can fall into traps when designing component diagrams. Being aware of these common mistakes can save significant time during the development phase.
- Confusing Class with Component: A class diagram details the internal structure of a single unit. A component diagram details the units themselves. Do not clutter component diagrams with class-level attributes and methods.
- Ignoring Deployment: Components often map to physical artifacts. Ensure the diagram reflects the deployment topology. A component that runs on a server is different from one that runs in a browser, even if the logic is similar.
- Over-Engineering: Do not create a component diagram for every single class. Reserve this level of abstraction for the high-level system structure. Use class diagrams for the internal details of a specific component.
- Stale Documentation: Diagrams become obsolete quickly if the code changes. Integrate diagram updates into the review process. If the code changes, the diagram should be reviewed and updated.
Component Diagrams in Microservices 🌐
The rise of microservices architecture has renewed interest in component diagrams. In a microservices environment, each service is essentially a component. The diagram becomes a map of the service mesh. It helps in understanding how services communicate, where data flows, and where bottlenecks might occur.
When modeling microservices, the focus shifts slightly. Instead of just logical modules, the diagram must account for network protocols, API gateways, and service discovery mechanisms. The interfaces become REST endpoints, gRPC methods, or message queue subscriptions. The component diagram remains relevant but adapts to the distributed nature of the system.
Refactoring with Diagrams 🔄
Legacy systems often suffer from structural debt. Refactoring is the process of restructuring existing code without changing its external behavior. Component diagrams are invaluable during refactoring. They provide a snapshot of the current state, allowing teams to plan the transition to a new architecture.
By identifying high-coupling components, teams can prioritize which modules to refactor first. The goal is to reduce the number of dependencies and increase modularity. The diagram serves as the target state, guiding the refactoring effort towards a cleaner architecture.
Conclusion 📝
Component diagrams are more than just visual artifacts; they are tools for thought. They force architects to think about boundaries, contracts, and dependencies. By organizing system modules effectively, teams can build software that is robust, scalable, and maintainable. The discipline required to create these diagrams pays dividends in the clarity of the resulting codebase. Whether designing a new system or evolving an existing one, the component diagram remains a fundamental instrument in the software architect’s toolkit.
Focus on the interfaces. Define the boundaries. Keep the dependencies explicit. These principles will guide the creation of diagrams that stand the test of time and change.