Data Flow Diagrams (DFDs) serve as a critical visual language for understanding how information moves through a system. They provide a structured view of processes, data stores, external entities, and the flows that connect them. However, creating an accurate diagram is more than just drawing boxes and arrows. It requires a disciplined approach to logic, consistency, and data integrity. When these elements are overlooked, the resulting model becomes confusing, misleading, or entirely invalid for development purposes. This guide examines the most frequent errors encountered during the modeling process and provides clear, actionable strategies to prevent them.
🧩 Understanding the Core Components
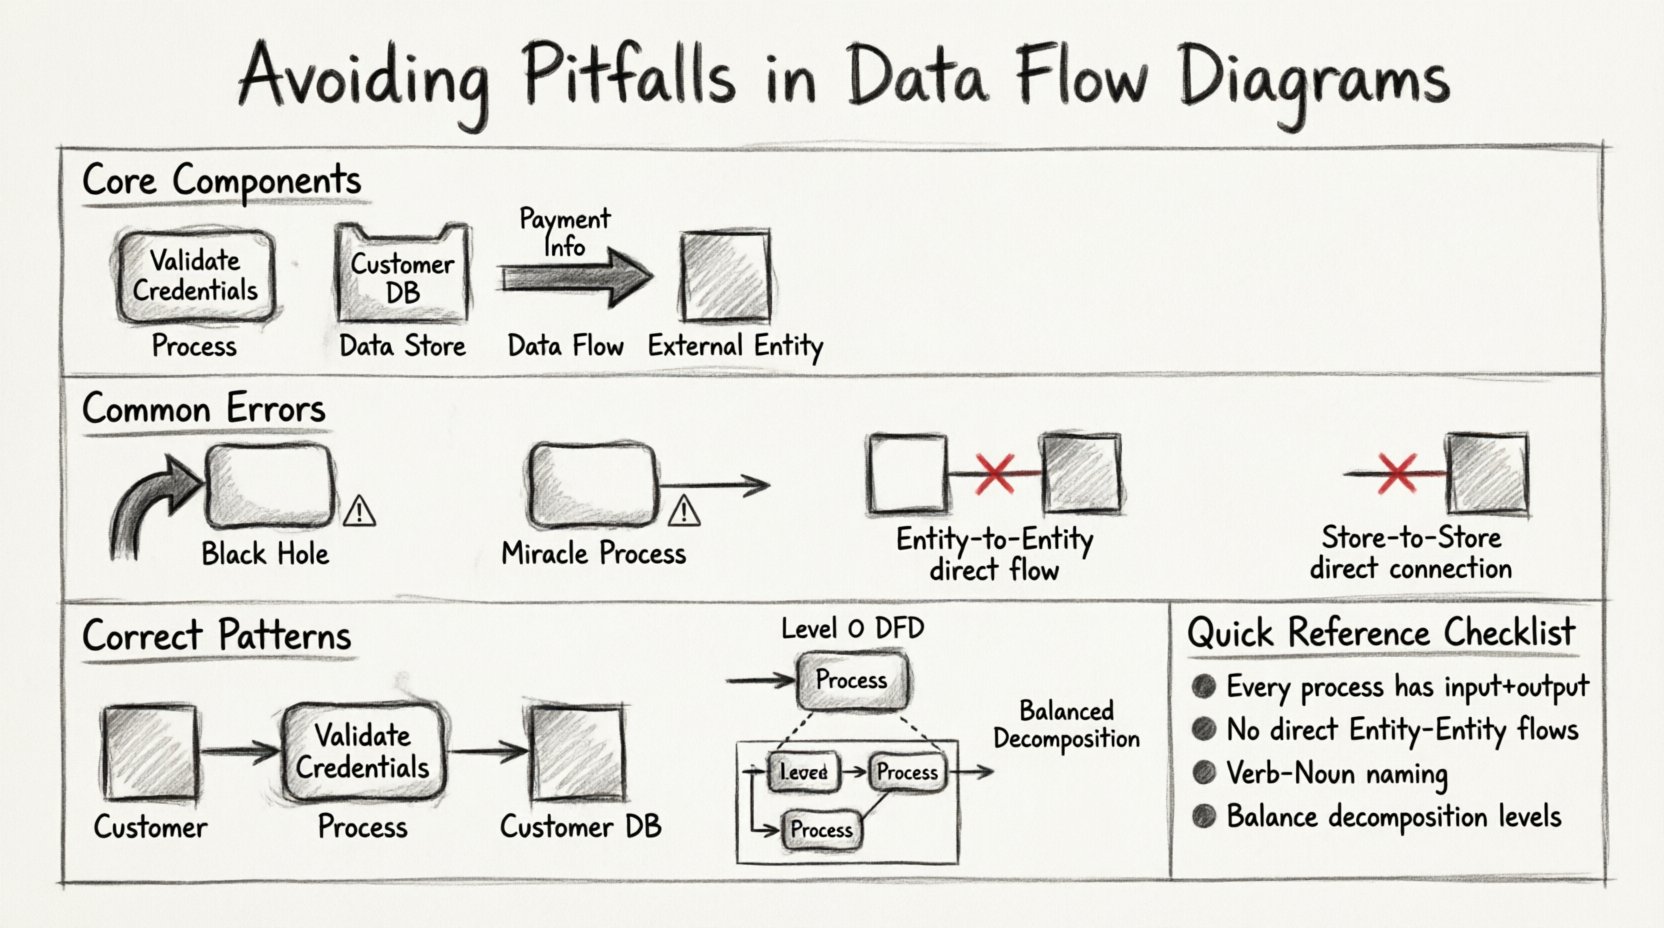
Before diving into errors, it is essential to establish a firm grasp of the four fundamental components that make up every Data Flow Diagram. A mistake in one area often ripples through the entire model. These components are not interchangeable, and confusing them is a primary source of structural failure.
- Processes: These represent actions that transform data. They are not static storage; they are active changes. In standard notation, they appear as rounded rectangles or circles.
- Data Stores: These are repositories where information rests between processes. They indicate persistence. They are usually depicted as open-ended rectangles or parallel lines.
- Data Flows: These are the arrows showing the movement of data. They represent inputs and outputs but never storage themselves.
- External Entities: These are sources or destinations of data outside the system boundary. They interact with the system but are not controlled by it.
Confusion often arises when a data flow is treated like a process, or when a data store is drawn with an arrowhead pointing directly into it without a connecting process. Precision here prevents the majority of downstream modeling errors.
⚠️ The “Black Hole” and “Miracle” Processes
Two of the most severe logical errors in DFD modeling involve the conservation of data. Every process must respect the law of conservation of matter, adapted here for information: data cannot simply appear or vanish without a trace.
1. The Black Hole Process
A Black Hole occurs when a process has inputs but no outputs. The data enters the process, and nothing leaves. In a functional system, this is impossible. If data is consumed, it must be transformed into something else, stored, or passed on.
- The Symptom: An arrow points into a process, but no arrows exit.
- The Cause: The modeler assumes the data is “handled” without specifying the result. This often happens when documenting legacy systems where the output was ignored or lost.
- The Consequence: Developers building the system will not know what to do with the input data. It halts the logic flow.
- The Fix: Ensure every input has a corresponding output. If the data is stored, draw a flow to a data store. If it is reported, draw a flow to an external entity.
2. The Miracle Process
Conversely, a Miracle Process is one that has outputs but no inputs. The system magically produces information out of thin air. While a system might have default values, the creation of data usually requires a trigger or an initial state.
- The Symptom: An arrow exits a process, but no arrows enter it.
- The Cause: The modeler forgets to trace where the initial data comes from. They assume the process generates the data autonomously.
- The Consequence: The system logic is broken. Without input, the process cannot function. It implies a dependency that does not exist.
- The Fix: Trace the output back to its source. Is there an external entity providing it? Is it coming from a data store? Is it a result of a previous process?
🔗 The Data Flow Between Entities
One of the most common violations of DFD rules involves the direct connection between two external entities. In strict methodology, data cannot flow directly from one external entity to another. It must pass through the system boundary.
| Incorrect Pattern | Correct Pattern | Reasoning |
|---|---|---|
| Entity A ────> Entity B | Entity A ───> Process ───> Entity B | The system must be involved in the transaction. |
| Customer ───> Vendor | Customer ───> Order Process ───> Vendor | The ordering system mediates the relationship. |
This rule ensures that the system boundary is respected. If two entities interact directly, the process they are using is outside the scope of the current diagram. Including this flow suggests the system is bypassed, which defeats the purpose of modeling the system itself.
🏷️ Naming Conventions and Ambiguity
A diagram is useless if the reader cannot understand what the symbols represent. Generic naming is a subtle but pervasive pitfall. Labels like “Process 1” or “Data A” provide no value. However, overly complex names can make the diagram cluttered. The goal is clarity and specificity.
Process Naming
Processes should be named with a verb followed by a noun. This describes the action being performed.
- Bad: “Process 1”, “The Login”, “Handle Data”
- Good: “Validate User Credentials”, “Calculate Tax”, “Generate Invoice”
Using verbs ensures that the reader understands the transformation taking place. If a name is just a noun, it suggests a data store, not a process.
Data Flow Naming
Data flows represent the information moving. They should be labeled with the specific data packet being transferred.
- Bad: “Data”, “Info”, “Details”
- Good: “Payment Information”, “Customer ID”, “Shipping Address”
Consistency is key. If you call it “Customer ID” in one place, do not call it “Client Number” in another. This creates confusion during the review process.
⚖️ Balancing and Decomposition
DFDs are hierarchical. You start with a Context Diagram (Level 0) and then decompose the single process into a Level 1 DFD. This is where the most technical errors occur. The principle of balancing dictates that the inputs and outputs of a parent process must match the aggregate inputs and outputs of the child processes in the sub-diagram.
The Balancing Rule
If the Context Diagram shows a flow of “Order” entering the system, the Level 1 DFD must show that same “Order” flow entering one of the child processes. You cannot lose data during decomposition.
- Common Error: The Level 1 diagram adds a new input that was not present in the Level 0 diagram.
- Common Error: The Level 1 diagram removes an output that existed in the Level 0 diagram.
Why Balancing Matters
When a diagram is unbalanced, the scope of the system has changed without documentation. It implies new functionality or lost functionality. During development, this leads to missing features or unexpected bugs. To maintain balance:
- List all inputs and outputs for the parent process.
- Draw the child processes.
- Verify that every parent input appears as a child input.
- Verify that every parent output appears as a child output.
- If data appears in the child but not the parent, expand the parent context or remove the data from the child.
🗄️ Data Store Connections
Data stores are the memory of the system. They are passive. They do not move data; processes move data to and from them. A frequent mistake is connecting two data stores directly with a data flow.
Incorrect: Data Store A ───> Data Store B
Correct: Data Store A ───> Process ───> Data Store B
There is no mechanism for data to migrate between repositories without a process moving it. If you draw a direct line, you are implying an automated transfer that requires a specific process to execute the movement. Always route data store connections through a process.
🔄 External Entity Duplication
It is common to draw the same external entity multiple times on a single diagram to save space or reduce line crossings. This is a visual convenience that introduces logical errors.
- The Rule: An external entity should appear only once on a given diagram.
- The Reason: If “Customer” appears twice, it looks like two different people or roles. It implies two separate data sources.
- The Fix: If lines are too long, use a connector symbol or redraw the layout. Do not duplicate the box.
🛡️ Review Checklist for Model Accuracy
To ensure your diagrams are robust, use this checklist before finalizing any model. This helps catch errors that are easy to miss when focused on drawing.
- Input/Output Check: Does every process have at least one input and one output?
- Flow Direction: Do all arrows point correctly? Data flows must move from source to destination.
- Entity Isolation: Are there any direct flows between two external entities?
- Store Isolation: Are there any direct flows between two data stores?
- Naming Consistency: Are all labels clear, specific, and consistent throughout the document?
- Balancing: Does the Level 1 diagram match the inputs/outputs of the Level 0 context diagram?
- Boundary: Are all external entities outside the system boundary?
📊 Comparison of Errors and Solutions
The following table summarizes the critical pitfalls and the specific corrective actions required to resolve them.
| Error Category | Visual Indicator | Corrective Action |
|---|---|---|
| Black Hole | Input arrow exists, no output arrow | Add an output flow to a store or entity |
| Miracle | Output arrow exists, no input arrow | Trace the source and add an input flow |
| Entity-to-Entity | Arrow between two boxes (Entities) | Insert a process between them |
| Store-to-Store | Arrow between two open rectangles | Route through a process |
| Duplicate Entity | Same entity name appears twice | Merge into a single instance |
| Unbalanced Levels | Mismatched IO between levels | Adjust flows to match parent scope |
💡 The Impact of Poor Modeling
Why does this level of detail matter? When a DFD contains these errors, the gap between the model and the reality of the software increases. Developers rely on these diagrams to write code. If the diagram says data goes from A to B, but the code expects it to go to C, the system fails.
Furthermore, maintenance becomes a nightmare. When a system needs an update, the development team looks at the diagram to understand the impact. If the diagram is full of black holes or miracles, the team cannot determine what will break. This leads to “spaghetti code” and technical debt.
Accurate modeling is an investment in the lifecycle of the software. It reduces the cost of changes later in the project. A clean, logical DFD acts as a contract between the business requirements and the technical implementation.
🛠️ Tooling vs. Methodology
It is important to distinguish between the tool used to draw the diagram and the methodology used to create it. Many modeling tools offer features to automate validation, such as highlighting unbalanced flows. However, no tool can replace human judgment regarding the logic of the business.
- Automation: Tools can check for syntax errors, like missing labels or broken connections.
- Logic: Humans must verify if the flow makes sense in the business context.
Do not rely solely on the software to validate your model. A diagram can be syntactically perfect but logically flawed. For example, a tool might allow a data flow from an entity to an entity, but the methodology dictates this is incorrect. Always apply the rules of DFD theory regardless of the tool’s permissions.
🔍 Validation Through Walkthroughs
Once the diagram is drawn, it must be validated. The best way to do this is through a walkthrough with stakeholders. This involves walking through the diagram step-by-step.
- Start at the Context: Verify the boundary with the client. Does this cover everything they expect?
- Follow the Flow: Trace a specific piece of data from entry to exit. Does it make sense?
- Ask “Why”: Why is this data needed here? Why is it stored here?
- Check Assumptions: Are there any assumptions about how the data is processed that are not documented?
This collaborative review is often where the most significant errors are found. Stakeholders may realize that a process they thought was automated is actually manual, or vice versa. This changes the DFD significantly.
📝 Final Thoughts on Precision
Creating a Data Flow Diagram is an exercise in logic and communication. It is not merely a drawing task; it is a definition of how the system works. By avoiding the common pitfalls outlined in this guide, you ensure that your diagrams are reliable references for development and maintenance.
Focus on the four components. Respect the rules of flow and storage. Maintain consistency in naming. Balance your levels. Validate with others. When these practices are followed, the DFD becomes a powerful tool for clarity rather than a source of confusion.
Remember that the goal is understanding. If a diagram is confusing, it has failed, regardless of how many boxes it contains. Prioritize clarity over complexity. A simple, accurate diagram is always superior to a complex, flawed one.
🚀 Summary of Key Takeaways
- Never lose data: Avoid Black Holes (inputs without outputs) and Miracles (outputs without inputs).
- Respect boundaries: No direct flows between external entities or data stores.
- Maintain balance: Inputs and outputs must match across all levels of decomposition.
- Use clear names: Verb-Noun for processes, specific nouns for data flows.
- Review rigorously: Use checklists and walkthroughs to catch logical errors.
Adhering to these guidelines will result in a robust model that serves the project effectively from conception through deployment. The effort spent on accuracy now saves significant time and resources during the coding and testing phases. Treat every diagram as a critical document that defines the system’s behavior.