💡 Key Takeaways
- Core Function: Activity diagrams visualize the flow of control and object flow within a system, similar to flowcharts but with UML semantics.
- Concurrency: They uniquely support modeling parallel processing using fork and join nodes to represent simultaneous actions.
- Swimlanes: Partitioning activities into swimlanes clarifies responsibility and ownership without needing separate sequence diagrams.
- Integration: These diagrams complement use case diagrams by detailing the internal logic behind specific use cases.
Understanding the Purpose of Activity Diagrams 🎯
Activity diagrams are a fundamental component of the Unified Modeling Language (UML). They provide a high-level view of the system’s behavior, focusing on the sequence of actions and the conditions under which they occur. Unlike static diagrams that describe structure, activity diagrams describe dynamic behavior. They are particularly useful when modeling business processes, complex algorithms, or the internal logic of a single use case.
The primary goal is clarity. A well-constructed diagram allows stakeholders to understand the workflow without getting lost in code-level details. It bridges the gap between business requirements and technical implementation. By mapping logic visually, teams can identify bottlenecks, redundant steps, or potential errors before writing any code.
Core Components and Notation 🔍
To build an activity diagram, one must understand the standard notation. The diagram consists of nodes and edges. Nodes represent states or actions, while edges represent the flow of control or data between them.
Initial and Final Nodes
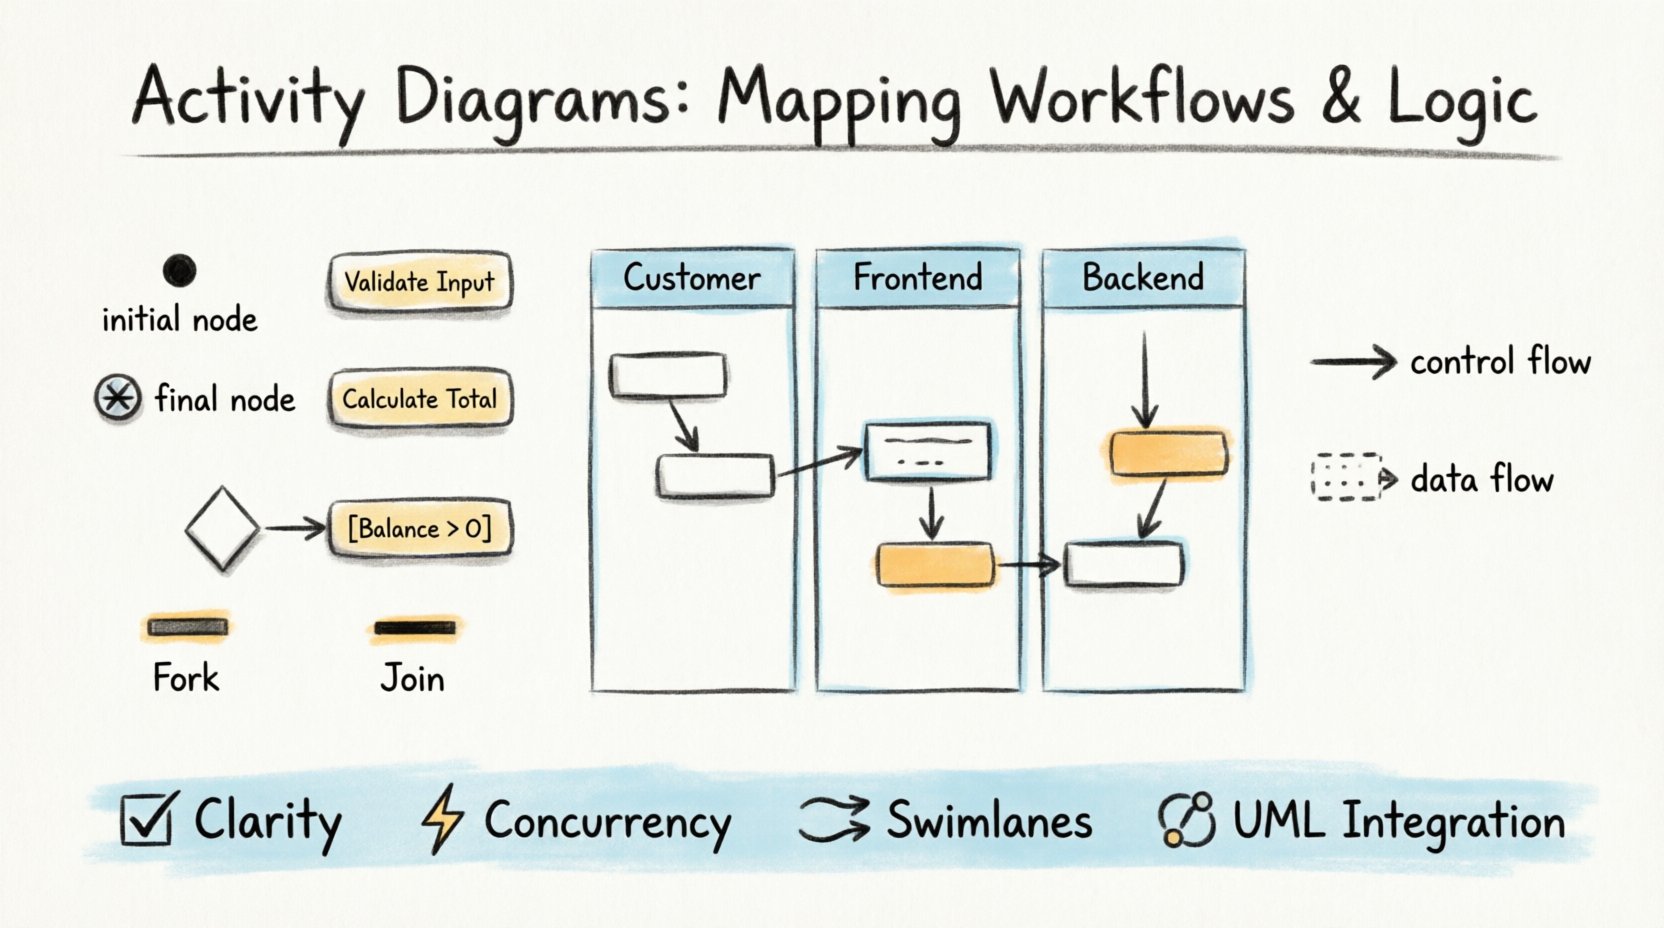
Every activity diagram begins with an initial node, typically represented as a filled black circle. This marks the entry point where the process starts. Conversely, the process concludes at a final node, shown as a circle with a cross inside (or a double-ringed circle). There can be multiple final nodes, representing different termination points based on success or failure conditions.
Activity States
Activities are represented by rounded rectangles. These denote an action that takes time to complete. They can be atomic (a single step) or compound (a sub-process that can be broken down further). Labels within the activity state describe the specific action, such as “Validate User Input” or “Calculate Total”.
Control Flow Edges
Control flow edges are solid lines with arrowheads. They indicate the order in which activities are performed. The flow moves from one node to the next unless directed otherwise by decision or fork nodes.
Managing Logic and Decisions 🔄
Real-world workflows are rarely linear. They involve choices, loops, and complex conditions. Activity diagrams handle this through specific nodes.
Decision and Merge Nodes
A decision node, represented by a diamond shape, allows the flow to branch. Only one outgoing path is taken based on a guard condition. For example, if a payment fails, the flow might go to a “Retry” path. If it succeeds, it goes to “Confirm Order”.
A merge node, also a diamond, combines multiple incoming paths into a single outgoing path. This is useful when different branches of logic converge back into a common process step.
Guard Conditions
Guard conditions are written in square brackets next to the control flow edge leaving a decision node. They define the criteria required to traverse that specific edge. For instance, [Balance > 0] ensures that funds are available before proceeding to a transaction.
Concurrency with Fork and Join ⚡
One of the most powerful features of activity diagrams is the ability to model concurrency. In many systems, multiple actions happen at the same time. Sequential modeling fails here; activity diagrams succeed.
Fork Nodes
A fork node splits a single incoming flow into multiple concurrent flows. It is represented by a thick horizontal or vertical bar. Once the flow reaches the fork, all outgoing paths are initiated simultaneously. This is essential for modeling processes like sending an email notification and updating a database log at the same time.
Join Nodes
A join node waits for all incoming concurrent flows to complete before allowing the process to continue. It is also represented by a thick bar. This ensures synchronization. For example, a system might wait for both a payment verification and an inventory check to finish before generating an invoice.
Partitioning with Swimlanes 🏊
When workflows involve multiple actors, departments, or system components, clarity can be lost in a dense web of lines. Swimlanes solve this problem. They partition the diagram into distinct regions, each representing a specific responsibility.
Types of Swimlanes
- Actor Swimlanes: Divide activities by human roles, such as “Customer,” “Admin,” or “Support Agent”.
- System Swimlanes: Divide activities by system modules, such as “Frontend,” “Backend,” or “Database”.
- Department Swimlanes: Divide activities by organizational units, such as “Sales” and “Finance”.
Activities within a swimlane are owned by that entity. Control flow edges crossing swimlane boundaries represent interactions between entities. This visual separation makes it immediately obvious who is responsible for each step.
Object Flows and Data Movement 📦
While control flow manages the logic, object flow manages the data. Objects are represented by rectangles with a small rectangle in the top left corner. An object flow edge connects an activity that produces an object to an activity that consumes it.
This distinction is crucial. A control flow edge indicates that the first activity must finish before the second starts. An object flow edge indicates that the first activity creates data that the second activity needs. An activity can have multiple input and output objects, creating a clear data lineage.
Best Practices for Effective Modeling 🛠️
Creating a diagram is one thing; creating a useful one is another. Adhering to best practices ensures the diagram remains readable and valuable.
Keep it Readable
Do not attempt to model the entire system in a single diagram. Break complex processes into sub-activities or separate diagrams. A diagram that covers the entire system lifecycle is often too complex to interpret. Use hierarchical modeling, where a high-level diagram references detailed sub-processes.
Consistent Naming
Use clear, consistent labels for all nodes and edges. Avoid abbreviations unless they are standard industry terminology. An activity labeled “Proc” is less clear than “Process Order”. Consistency helps stakeholders navigate the diagram quickly.
Limit Branching
Too many decision nodes create a maze. If a process has many conditions, consider grouping them or using a table to define the logic separately. The diagram should highlight the main flow and exceptions, not every minor edge case.
Common Pitfalls to Avoid ⚠️
Even experienced modelers can fall into traps that reduce the value of their diagrams.
Mixing Control and Object Flow
Do not confuse control flow with object flow. Using object flow to represent a sequence of actions is incorrect. Object flow is strictly for data movement. Using it for control flow creates ambiguity about whether the activity is waiting for data or simply proceeding.
Over-Partitioning
While swimlanes are useful, too many of them can clutter the diagram. If a diagram has more than five or six swimlanes, the horizontal space required makes it difficult to view. Consider splitting the diagram into multiple views.
Neglecting Termination
Ensure every path in the diagram leads to a final node. Dead ends are confusing and suggest incomplete logic. If a path represents an error, it should still terminate, perhaps in a specific error-handling final node.
Integrating with Other UML Diagrams 🔗
Activity diagrams do not exist in isolation. They integrate with other UML diagrams to provide a complete picture of the system.
Use Case Diagrams
Use case diagrams identify the actors and high-level interactions. Activity diagrams detail the internal steps of a specific use case. For example, a “Place Order” use case might have a corresponding activity diagram showing the steps from cart validation to payment processing.
Sequence Diagrams
Sequence diagrams focus on the interaction between objects over time. Activity diagrams focus on the algorithm or workflow. They complement each other. Use sequence diagrams for detailed object interactions and activity diagrams for the overall process flow.
Class Diagrams
Class diagrams define the static structure. Activity diagrams define the dynamic behavior. The objects flowing through an activity diagram correspond to the classes defined in the class diagram. This ensures consistency between the system’s structure and its behavior.
Conclusion 🏁
Activity diagrams are a robust tool for mapping workflows and logic. They provide a clear, visual representation of complex processes, making them accessible to both technical and non-technical stakeholders. By mastering the core components, managing concurrency effectively, and adhering to best practices, teams can create diagrams that serve as a reliable blueprint for development. The effort invested in modeling pays off in reduced ambiguity, fewer errors, and a shared understanding of the system’s behavior.