Integrating a new engineer into an existing software system is often one of the most time-consuming and resource-intensive tasks a team undertakes. The traditional approach relies heavily on reading code, sifting through static documentation, and attending lengthy meetings. However, this method frequently results in fragmented understanding and prolonged ramp-up times. A more effective strategy involves visualizing the architecture at a granular yet accessible level. The C4 model offers a structured framework for creating these visualizations, specifically designed to aid communication and comprehension.
This guide explores how leveraging C4 component diagrams can significantly reduce the time it takes for a developer to become productive. By shifting focus from abstract text to structured visual hierarchy, teams can provide a clearer mental model of the system. This approach minimizes ambiguity and accelerates the path from onboarding to contribution.
🧩 The Challenge of Modern Onboarding
Software systems today are complex, distributed, and often polyglot. A new hire must understand not just the code, but the interactions between services, the data flow, and the external dependencies. Without a clear map, developers often guess or make assumptions that lead to technical debt or bugs.
Common pain points include:
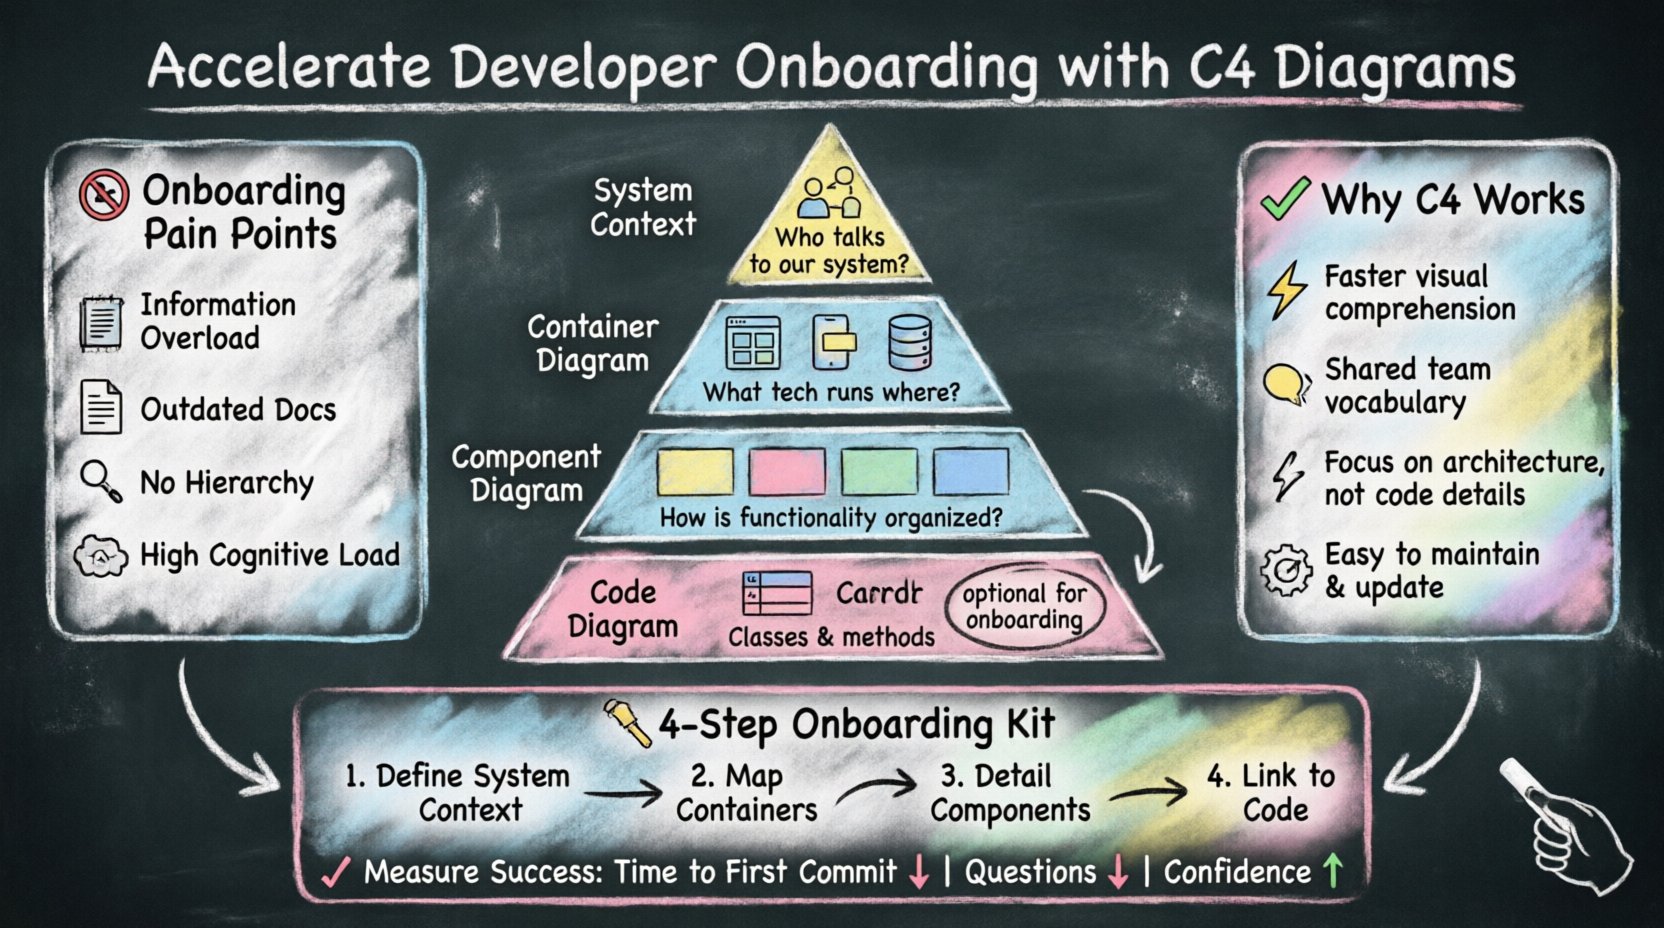
Information Overload: Accessing a repository with thousands of files provides no immediate context.
Outdated Documentation: Text-based guides often lag behind code changes, leading to confusion.
Lack of Hierarchy: Understanding the system requires knowing what matters most and what is secondary.
Cognitive Load: Trying to visualize architecture from code alone requires significant mental effort.
Addressing these issues requires a standardized way to document architecture. The C4 model provides this standardization, allowing teams to create diagrams that are easy to read, maintain, and update.
🏗️ Understanding the C4 Model
The C4 model is a hierarchical approach to software architecture diagrams. It breaks down the system into four levels of abstraction, allowing viewers to zoom in and out as needed. This scalability is crucial for onboarding, as it allows a new developer to start with a high-level view and drill down into specifics only when necessary.
The Four Levels of Abstraction
Each level serves a specific purpose and targets a different audience or stage of understanding:
Level 1: System Context Diagrams: This shows the system being built and its relationship with users and other systems. It answers the question, “What is this system and who talks to it?”
Level 2: Container Diagrams: This breaks down the system into high-level runtime environments, such as web applications, mobile apps, or databases. It answers, “What technology is running where?”
Level 3: Component Diagrams: This decomposes containers into logical groups of code, such as microservices or modules. It answers, “How is the functionality organized inside the container?”
Level 4: Code Diagrams: This shows the classes and functions within a component. It answers, “What are the specific classes and methods?”
For onboarding purposes, Levels 1 through 3 are typically the most valuable. Level 4 is often too detailed and changes too frequently to be a primary onboarding resource.
🚀 Why C4 Diagrams Accelerate Onboarding
Using C4 diagrams transforms the onboarding experience from a scavenger hunt into a guided tour. Here is why this specific modeling technique works so well for new engineers:
1. Reduced Cognitive Load
Human brains process visual information faster than text. A diagram allows a developer to grasp the system landscape in seconds. By presenting information in a standardized format, the cognitive effort required to interpret the diagram is minimized.
2. Shared Vocabulary
When everyone uses the C4 model, terms like “container” and “component” have specific, agreed-upon meanings. This eliminates ambiguity during discussions and ensures that documentation is understood consistently across the team.
3. Focus on Architecture, Not Implementation
C4 diagrams abstract away the specific implementation details (like variable names or specific algorithms) and focus on the structure. This helps new hires understand the “why” and “how” of the system design without getting bogged down in the “what” of the code immediately.
4. Easier Maintenance
Because the C4 model is simple, it is easier to keep up to date. Diagrams that are maintained are trusted. New developers are more likely to rely on documentation that is known to be accurate.
📊 Comparing Documentation Approaches
To understand the value of C4, it helps to compare it against other common documentation methods used during onboarding.
Method | Strengths | Weaknesses | Best For |
|---|---|---|---|
Raw Code | Always accurate, detailed | Hard to navigate, high cognitive load | Deep debugging, specific logic |
Wiki/Markdown | Text-based, easy to search | Can become outdated, lacks visual context | API references, configuration details |
UML Class Diagrams | Standardized, detailed | Complex, often too technical for high-level overview | Legacy system analysis, strict typing |
C4 Model | Scalable, visual, simple, maintainable | Requires discipline to update | System Architecture, Onboarding |
🛠️ Building an Onboarding Kit with C4
Creating a comprehensive set of diagrams is not a one-time task. It requires a strategy to ensure the new developer has the right information at the right time. The following steps outline how to build this kit.
Step 1: Define the System Context
Start with the big picture. Create a Level 1 diagram that places the system in the landscape. Identify:
Who are the primary actors (users, other systems)?
What are the key data flows?
What are the external dependencies?
This diagram gives the new hire a sense of ownership and boundaries. It answers, “Where does my work fit in the world?”
Step 2: Map the Containers
Once the context is clear, break down the system itself. Create a Level 2 diagram. Identify:
The runtime technology (e.g., web app, API, database).
Communication protocols (e.g., HTTP, gRPC, messages).
Deployment boundaries (e.g., cloud, on-premise).
This helps the developer understand the technological stack they need to configure and deploy.
Step 3: Detail the Components
For the core systems, create Level 3 diagrams. These show:
Logical groupings of functionality.
Interfaces between components.
Data stores within the container.
This is the most critical layer for understanding how to write code. It shows the boundaries of the modules they will be modifying.
Step 4: Link to Code
Diagrams should never exist in a vacuum. Each component should ideally link to the relevant repository or package. This allows the developer to jump from the abstract diagram to the concrete implementation seamlessly.
🔄 Maintaining Diagrams Over Time
A common pitfall in software documentation is creating diagrams that become outdated quickly. If a diagram no longer matches the code, it loses credibility. To ensure the C4 diagrams remain a useful onboarding tool, adopt the following practices:
Version Control: Store diagrams alongside the code they describe. This ensures they are reviewed during the same pull requests.
Automation: Where possible, use tools that generate diagrams from code or configuration files to reduce manual effort.
Review Process: Make diagram updates a requirement for architectural changes. If the architecture changes, the diagram must change.
Simplicity: Keep diagrams simple. If a diagram becomes cluttered, it is likely trying to do too much. Split it into smaller, focused diagrams.
📈 Measuring the Impact
To justify the effort of creating and maintaining C4 diagrams, teams should track specific metrics related to onboarding efficiency. These metrics help validate whether the diagrams are actually helping new developers.
Key performance indicators include:
Time to First Commit: Measure the duration from the day a developer starts to their first merged pull request.
Support Ticket Reduction: Track the number of questions asked by new hires regarding system architecture or data flow.
Bug Rate in Initial Weeks: Monitor the frequency of bugs introduced by new developers in their first month.
Self-Service Confidence: Survey new hires on how confident they feel navigating the system after one week.
🧠 The Psychology of Learning Architecture
Understanding why C4 works requires looking at how developers learn. When a person enters a new environment, they build a mental model. If the information provided is inconsistent or confusing, the model is flawed.
Diagrams act as external memory aids. They offload the burden of holding the entire system structure in working memory. By externalizing the architecture, developers can focus their mental energy on solving problems rather than recalling where things live.
Furthermore, C4 diagrams support different learning styles. Visual learners benefit from the layout, while logical learners appreciate the hierarchical structure. This inclusivity ensures that more team members can effectively onboard.
⚠️ Common Pitfalls to Avoid
Even with the best intentions, teams can stumble when implementing C4 diagrams. Being aware of these pitfalls helps ensure success.
Over-Detailing: Including too much information in a single diagram makes it unreadable. Stick to the abstraction levels defined by the model.
Ignoring the Audience: Do not create a Level 4 diagram for a Level 1 context. Match the diagram level to the question being asked.
Lack of Ownership: If no one is responsible for updating the diagrams, they will rot. Assign ownership to a senior engineer or a documentation team.
Static Files Only: Avoid storing diagrams only as images. Use source formats that allow for easy editing and versioning.
🤝 Integrating into Team Culture
For C4 diagrams to be effective, they must be part of the team culture, not just a compliance exercise. This means:
Code Reviews: Ask reviewers to check if diagrams match the proposed code changes.
Architecture Decision Records: Link diagrams to ADRs to show the rationale behind architectural choices.
Knowledge Sharing: Encourage senior engineers to create diagrams during pair programming or workshops to transfer knowledge.
New Hire Walkthroughs: Use the diagrams as the primary slide deck when explaining the system to a new joiner.
🌐 The Long-Term Value
The benefits of C4 diagrams extend beyond the initial onboarding phase. They become a living artifact of the system’s history and evolution. Over time, these diagrams serve as a knowledge base that preserves institutional memory. If a key engineer leaves, the diagrams ensure that the system structure remains understandable.
Additionally, they facilitate better communication with stakeholders. Non-technical managers can understand the System Context diagram without needing to read technical specifications. This alignment reduces friction between engineering and business teams.
🔑 Key Takeaways
Implementing the C4 model for developer onboarding is a strategic investment in your team’s efficiency. It provides a clear, scalable, and maintainable way to visualize complex systems. By reducing cognitive load and standardizing communication, teams can onboard developers faster and with higher quality.
To succeed, focus on:
Starting with the System Context to provide high-level orientation.
Maintaining diagrams as close to the code as possible.
Training team members on the C4 standard.
Measuring the impact on onboarding speed and quality.
By adopting this structured approach, organizations can transform onboarding from a bottleneck into a streamlined process, ensuring that every new developer contributes effectively from day one.