


Software architecture diagrams serve as the blueprint for development teams. They communicate how systems interact, where data flows, and how components are structured. However, a standard C4 model diagram often lacks a critical dimension: security. Without visualizing security boundaries, architects and developers may inadvertently create systems where trust assumptions are unclear, leading to vulnerabilities that are costly to fix later. Integrating security boundaries into C4 container diagrams ensures that risk management is embedded into the design phase rather than added as an afterthought.
This guide explores how to effectively represent security controls, trust zones, and data protection mechanisms within the C4 model framework. By following established conventions, teams can create diagrams that are not only structurally clear but also security-aware. This approach facilitates better communication between security engineers, developers, and business stakeholders.
🏗️ The C4 Model Context for Security
The C4 model provides a hierarchical approach to documenting software architecture. It consists of four levels: System Context, Container, Component, and Code. For security visualization, the Container Level is typically the most critical. This level depicts high-level software building blocks such as web applications, mobile apps, APIs, and databases.
When introducing security boundaries, the goal is to clarify where trust ends and untrusted environments begin. A container diagram without security context might show that System A talks to System B, but it does not reveal if that connection is encrypted, authenticated, or traverses a public network. Adding security boundaries fills this information gap.
- Level 1 (System Context): Useful for identifying external dependencies and high-level trust relationships between your system and users or third parties.
- Level 2 (Container): The primary focus for this guide. Here, you define internal zones, network segments, and data classification levels.
- Level 3 (Component): Can be used for detailed security logic, such as authentication modules, but often becomes too granular for high-level security reviews.
By focusing on the Container level, architects can maintain a balance between abstraction and detail. This ensures that security decisions are visible without overwhelming the diagram with implementation specifics.
🧱 Defining Security Boundaries
A security boundary represents a perimeter where trust changes. Crossing a boundary requires specific controls, such as authentication, authorization, or encryption. In a diagram, these boundaries group containers that share a common security posture or reside within the same network segment.
Types of Boundaries
Understanding the different types of boundaries helps in selecting the right visual representation:
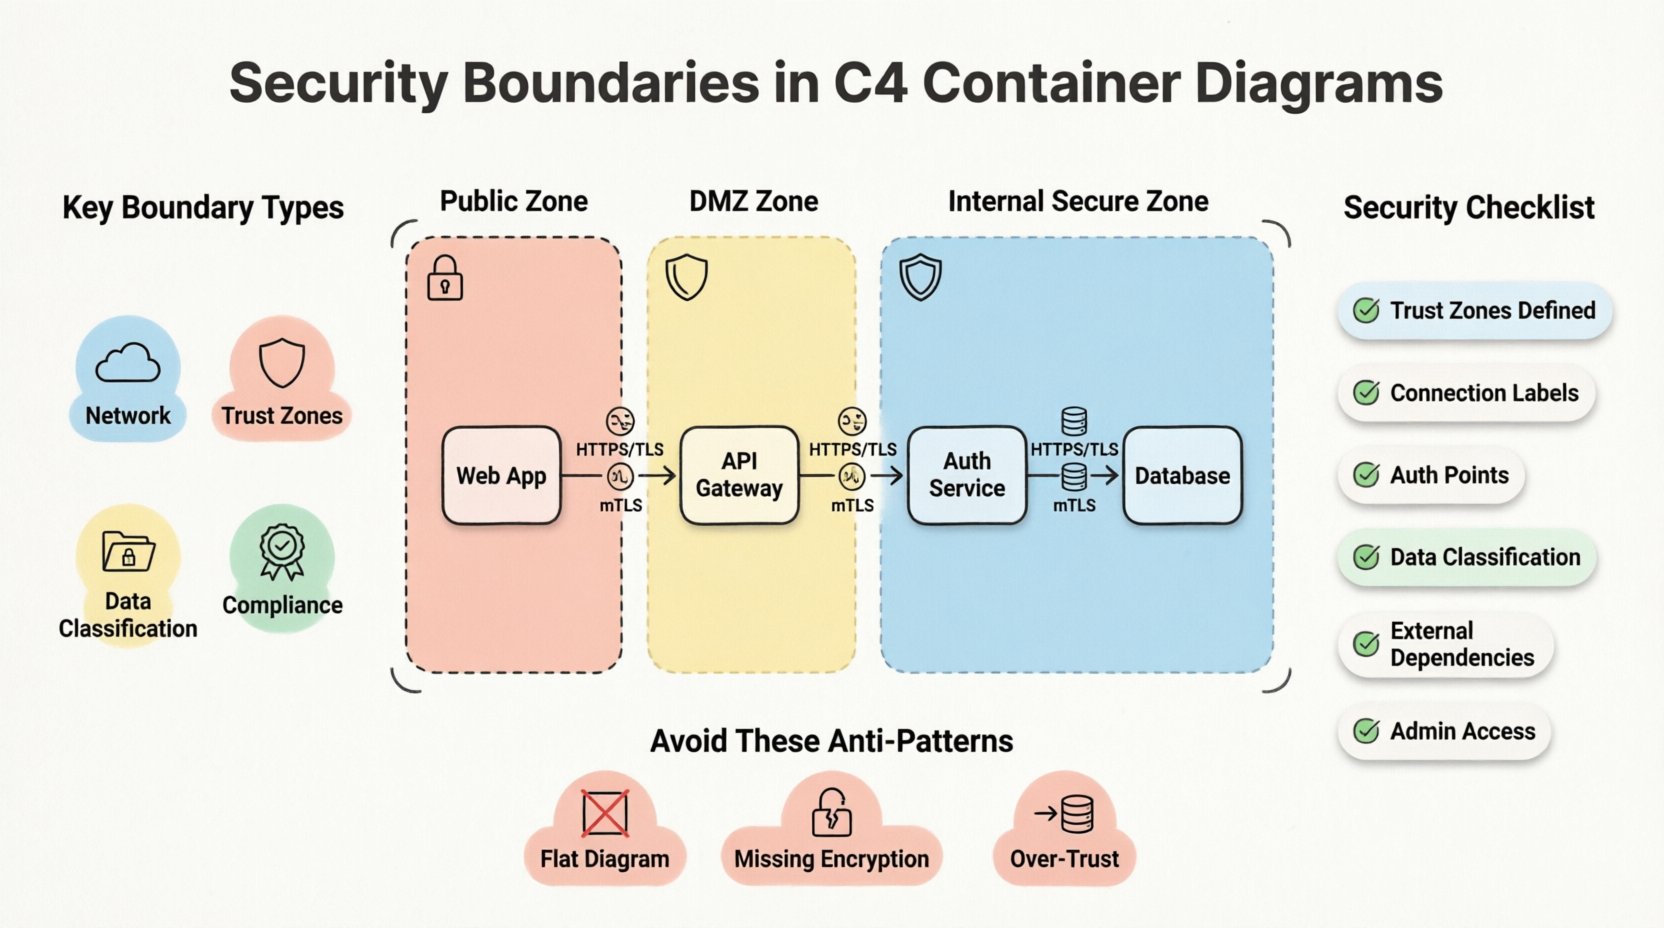
- Network Boundaries: Distinguish between internal private networks, public internet access, and isolated environments like DMZs (Demilitarized Zones).
- Trust Zones: Differentiate between fully trusted internal services and partially trusted external interfaces.
- Data Classification: Group containers that handle sensitive data (PII, financial records) separately from public-facing services.
- Compliance Zones: Separate systems based on regulatory requirements, such as systems requiring GDPR compliance versus general operational tools.
Trust and Data Flow
Security is fundamentally about trust. Every connection between containers implies a trust relationship. If Container A sends data to Container B, A trusts B to handle that data correctly. If B is compromised, A is at risk.
Visualizing this trust is vital. Arrows in a C4 diagram represent data flow, but they should also imply trust direction. A boundary line indicates that crossing it requires a security check. For example, moving from the Public Zone to the Internal Zone should trigger an authentication step.
🎨 Visualizing Boundaries in Container Diagrams
Consistency in visual language is key to effective documentation. When drawing security boundaries, the notation should be intuitive. There is no single universal standard, but industry conventions have emerged that work well within the C4 model.
Notation Standards
Most tools used to create C4 diagrams support custom shapes and styling. To represent security boundaries, consider the following standard practices:
- Dashed Lines: Use dashed lines to enclose a group of containers. This suggests a logical grouping rather than a physical wall.
- Shaded Areas: A light background color can indicate a zone. For example, a light red background might indicate a high-risk public zone, while green indicates a trusted internal zone.
- Icons: Add a small lock or shield icon next to the boundary label to signal security controls are active.
- Labels: Clearly name the boundary. Use terms like Public Network, Secure Zone, or DMZ.
Color Coding Strategies
Color is a powerful signal. However, it must be used deliberately. Avoid using colors arbitrarily. Instead, map colors to security states:
- Red/Orange: High risk, public facing, untrusted input sources.
- Yellow: Intermediate risk, DMZ, or semi-trusted interfaces.
- Green/Blue: Low risk, internal, trusted services.
- Grey: Legacy systems or deprecated components that require careful handling.
Ensure that color choices are accessible. Use patterns or labels in addition to color to ensure the diagram remains readable for users with color vision deficiencies.
🔒 Implementing Security Controls in Diagrams
Once boundaries are drawn, the next step is to annotate the connections crossing those boundaries. A line crossing a security boundary is a security event. It requires specific controls.
Encryption and Protocols
Label the connections with the protocols used. This informs the reader about the security posture of the data in transit.
- HTTPS/TLS: Standard for web traffic. Indicate the version if relevant (e.g., TLS 1.3).
- mTLS: Mutual TLS is common in microservices architectures. This indicates strong identity verification.
- SSH: For administrative access or internal file transfers.
- Unencrypted: Explicitly label any unencrypted traffic. This highlights a risk that needs remediation.
Authentication and Authorization
Where does the user authenticate? Which service validates the token? These questions should be answerable from the diagram.
- API Gateways: Often act as the entry point. Mark them as the boundary where authentication occurs.
- OAuth/SSO: Show the flow of tokens between the user, the gateway, and the backend services.
- Service Accounts: Indicate if services authenticate using machine identities rather than user tokens.
🔄 Common Architecture Patterns
Certain architectural patterns appear frequently in modern software systems. These patterns have specific security boundary considerations.
1. The DMZ Pattern
A Demilitarized Zone sits between the public internet and the internal network. It hosts components that must be accessible externally but should not have direct access to sensitive data.
- Boundary: Enclose the web servers or load balancers in a DMZ zone.
- Connection: The DMZ talks to the internal zone via a restricted port or API endpoint.
- Security Goal: Limit the blast radius if the public-facing component is compromised.
2. Microservices with Service Mesh
In microservices architectures, services talk to each other frequently. A service mesh handles traffic management and security.
- Boundary: Each service is its own container. The mesh creates a logical overlay.
- Connection: All internal traffic is encrypted (mTLS).
- Security Goal: Zero Trust. Every service must verify every other service.
3. Database Segmentation
Not all databases should be treated equally. Sensitive data stores should be isolated.
- Boundary: Place sensitive databases in a dedicated subnet or security zone.
- Connection: Only specific application containers can connect to the database.
- Security Goal: Prevent lateral movement. If an app container is breached, the attacker cannot access the database directly.
📊 Security Review Checklist
Before finalizing a diagram, perform a security review. Use the following checklist to ensure all necessary boundaries and controls are represented.
| Check Item | Criteria | Why It Matters |
|---|---|---|
| Trust Zones Defined | Are all containers assigned to a trust zone? | Clarifies where security controls are needed. |
| Connection Labels | Are protocols and encryption methods labeled? | Ensures data in transit is secure. |
| Authentication Points | Is the entry point for authentication clear? | Identifies where access control happens. |
| Data Classification | Are sensitive data stores separated? | Protects high-value assets. |
| External Dependencies | Are third-party services marked? | Highlights supply chain risks. |
| Admin Access | Is administrative access bounded? | Prevents unauthorized system control. |
This table serves as a quick reference during code reviews or architecture decision records (ADRs). It ensures that security is not overlooked during the design phase.
⚠️ Security Anti-Patterns
Avoiding mistakes is just as important as following best practices. The following anti-patterns often appear in diagrams that lack security boundaries.
- The Flat Diagram: Drawing all containers in one box without zones. This implies all components are equally trusted, which is rarely true.
- Missing Encryption Labels: Showing arrows without specifying HTTPS. This creates ambiguity about data protection.
- Over-Trust: Connecting a public-facing container directly to a database container without an intermediary. This is a classic vulnerability vector.
- Static Boundaries: Failing to update the diagram when the infrastructure changes. A diagram showing an old network topology is worse than no diagram at all.
- Ignoring Data Flow: Focusing only on static structure and ignoring how data moves across boundaries. Security is dynamic.
📈 Maintenance and Evolution
Security boundaries are not static. As systems evolve, new services are added, and threats change. The diagrams must evolve with them. Treating the diagram as a living document is essential for long-term security.
Version Control
Store diagrams in version control alongside the code. This allows teams to track how security boundaries changed over time. When a security incident occurs, reviewing the diagram history can reveal if the boundary was missing or misconfigured.
Automated Generation
Where possible, generate diagrams from code or infrastructure-as-code configurations. This reduces the gap between the documentation and the actual system. If the infrastructure changes, the diagram updates automatically, ensuring the security boundaries remain accurate.
Regular Audits
Schedule periodic reviews of the architecture diagrams. During these reviews, ask specific security questions:
- Has any new dependency been added that crosses a boundary?
- Are the encryption standards still up to date?
- Do the trust zones still align with the current network topology?
- Are there any unused containers that should be removed to reduce the attack surface?
🔍 Conclusion
Integrating security boundaries into C4 container diagrams transforms them from simple structural maps into comprehensive security guides. This practice clarifies trust relationships, highlights data protection requirements, and facilitates better communication across teams. By adhering to consistent notation, labeling protocols, and maintaining the diagrams over time, organizations can build more resilient systems.
Security is not a product; it is a process. Diagrams are a tool in that process. They make the invisible visible, allowing architects to identify risks before they become incidents. Investing time in accurate, security-focused documentation pays dividends in reduced vulnerability and faster incident response.
Start by auditing your current diagrams. Identify where trust boundaries are missing. Add the necessary zones, labels, and colors. Over time, this habit will become second nature, embedding security into the very language you use to describe your architecture.